Jump to a detailed profile or search site with Google Custom Search

Northeast Tarrant, TX (Texas) Houses and Residents

Estimated median house or condo value in 2022: $392,867 (it was $111,600 in 2000)
Northeast Tarrant:

$392,867
Texas:

$275,400
Lower value quartile - upper value quartile: $280,565 - $526,241

Total population: 472,730 (Urban population: 398,363, Rural population: 3,748 (111 farm, 3,637 nonfarm))

Houses: 155,788 (149,489 occupied: 101,491 owner occupied, 47,998 renter occupied)

% of renters here:

32%
State:

38%

Housing density: 753 houses/condos per square mile

Median price asked for vacant for-sale houses and condos in 2022 in this county: $307,354.

Median contract rent in 2022: $1,386 (lower quartile is $1,127, upper quartile is $1,762)


Median rent asked for vacant for-rent units in 2022: $1,420


Median gross rent in Northeast Tarrant, TX in 2022: $1,568

Housing units in Northeast Tarrant with a mortgage: 77,313 (5,649 second mortgage, 4,029 home equity loan, 88 both second mortgage and home equity loan)
Houses without a mortgage: 18,262

Compare current foreclosures near Northeast Tarrant, TX:

Check out more offers near Northeast Tarrant, TX.
Powered by Foreclosure.com


Northeast Tarrant, Texas Age and Sex of Residents

Household type by relationship:

Households: 1,788,400
  • In family households: 1,536,808 (312,748 male householders, 142,285 female householders)
    329,737 spouses, 579,348 children (536,537 natural, 11,643 adopted, 31,168 stepchildren), 46,562 grandchildren, 22,396 brothers or sisters, 18,327 parents, foster children, 30,603 other relatives, 40,309 non-relatives
  • In nonfamily households: 251,592 (98,137 male householders (75,854 living alone)), 103,964 female householders (87,705 living alone)), 49,491 nonrelatives
  • In group quarters: 20,634 (12,393 institutionalized population)

275,554 married couples with children.
88,485 single-parent households (18,988 men, 69,497 women).

86.0% of residents of Northeast Tarrant speak English at home.
8.4% of residents speak Spanish at home (61% speak English very well, 17% speak English well, 16% speak English not well, 7% don't speak English at all).
2.6% of residents speak other Indo-European language at home (71% speak English very well, 20% speak English well, 8% speak English not well, 1% don't speak English at all).
2.6% of residents speak Asian or Pacific Island language at home (49% speak English very well, 30% speak English well, 18% speak English not well, 3% don't speak English at all).
0.4% of residents speak other language at home (77% speak English very well, 17% speak English well, 6% speak English not well).

Foreign born population: 64,331 (10.7%)
(54.4% of them are naturalized citizens)

Median number of rooms in houses and condos:
Here:

6.4
State:

6.3

Median number of rooms in apartments
Here:

4.0
State:

4.0

Owner-occupied Renter-occupied
Bedrooms in owner-occupied houses and condos in Northeast Tarrant, Texas
  • Bedrooms in owner-occupied houses and condos in Northeast Tarrant, Texas
  • 538no bedroom
  • 1,2271 bedroom
  • 8,6072 bedrooms
  • 57,1273 bedrooms
  • 28,9474 bedrooms
  • 5,0455+ bedrooms
Bedrooms in renter-occupied apartments in Northeast Tarrant, Texas
  • Bedrooms in renter-occupied apartments in Northeast Tarrant, Texas
  • 3,041no bedroom
  • 17,7681 bedroom
  • 17,1522 bedrooms
  • 8,7773 bedrooms
  • 1,1664 bedrooms
  • 945+ bedrooms
Owner-occupied Renter-occupied
Cars and other vehicles available in Northeast Tarrant in owner-occupied houses/condos
  • Cars and other vehicles available in Northeast Tarrant in owner-occupied houses/condos
  • 1,327no vehicle
  • 20,0331 vehicle
  • 55,8072 vehicles
  • 18,5003 vehicles
  • 4,4984 vehicles
  • 1,3265+ vehicles
Cars and other vehicles available in Northeast Tarrant in renter-occupied apartments
  • Cars and other vehicles available in Northeast Tarrant in renter-occupied apartments
  • 3,273no vehicle
  • 24,9451 vehicle
  • 16,6012 vehicles
  • 2,5873 vehicles
  • 4904 vehicles
  • 1025+ vehicles
Owner-occupied Renter-occupied
Rooms in owner-occupied houses in Northeast Tarrant, Texas
  • Rooms in owner-occupied houses in Northeast Tarrant, Texas
  • 251 room
  • 3282 rooms
  • 2,7533 rooms
  • 4,1144 rooms
  • 20,9715 rooms
  • 25,0266 rooms
  • 17,6467 rooms
  • 13,1918 rooms
  • 17,4379+ rooms
Rooms in renter-occupied apartments in Northeast Tarrant, Texas
  • Rooms in renter-occupied apartments in Northeast Tarrant, Texas
  • 2,6601 room
  • 5,8872 rooms
  • 11,2933 rooms
  • 12,3484 rooms
  • 9,8035 rooms
  • 3,8326 rooms
  • 1,4517 rooms
  • 4918 rooms
  • 2339+ rooms
Year house built
Breakdown of mean house values by ages of householders
Owners and renters by unit type in Northeast Tarrant, TX
  • Northeast Tarrant, TX household income distribution

  • Distribution of median household income in Northeast Tarrant, TX in 2022
  • 46,302Less than $10,000
  • 51,262$10,000 to $19,999
  • 63,056$20,000 to $29,999
  • 81,165$30,000 to $39,999
  • 78,552$40,000 to $49,999
  • 75,269$50,000 to $59,999
  • 99,902$60,000 to $74,999
  • 127,142$75,000 to $99,999
  • 103,821$100,000 to $124,999
  • 69,910$125,000 to $149,999
  • 96,812$150,000 to $199,999
  • 109,398$200,000 or more

Percentage of workers working in this county: 70.9%
Number of people working at home: 51,863 (15.8% of all workers)

Travel time to work (commute)

  • Less than 5 minutes: 3,837
  • 5 to 9 minutes: 16,435
  • 10 to 14 minutes: 25,620
  • 15 to 19 minutes: 30,172
  • 20 to 24 minutes: 33,249
  • 25 to 29 minutes: 15,517
  • 30 to 34 minutes: 34,785
  • 35 to 39 minutes: 6,796
  • 40 to 44 minutes: 8,379
  • 45 to 59 minutes: 17,735
  • 60 to 89 minutes: 8,610
  • 90 or more minutes: 4,039

Means of transportation to work:

  • Drove a car alone: 179,949 (84.8%)
  • Carpooled: 20,798 (9.8%)
  • Bus or trolley bus: 99 (0.0%)
  • Streetcar or trolley car: 15 (0.0%)
  • Subway or elevated: 52 (0.0%)
  • Railroad: 39 (0.0%)
  • Ferryboat: 8 (0.0%)
  • Taxi: 166 (0.1%)
  • Motorcycle: 260 (0.1%)
  • Bicycle: 404 (0.2%)
  • Walked: 1,962 (0.9%)
  • Other means: 1,422 (0.7%)
  • Worked at home: 7,037 (3.3%)
Class of Workers in 2000
Year of entry for the foreign-born population in Northeast Tarrant, Texas
  • Year of entry for the foreign-born population in Northeast Tarrant, Texas
  • 9,8031995 to March 2000
  • 6,0441990 to 1994
  • 4,8871985 to 1989
  • 4,7501980 to 1984
  • 3,5151975 to 1979
  • 1,4831970 to 1974
  • 1,1341965 to 1969
  • 1,955Before 1965

Most common places of birth for foreign-born residents (%):

Mexico
Northeast Tarrant:

31.1% (10,452)
Texas:

64.8% (1,879,369)

Vietnam
Northeast Tarrant:

8.4% (2,830)
Texas:

3.7% (107,027)

India
Northeast Tarrant:

5.6% (1,876)
Texas:

2.7% (78,388)

Laos
Northeast Tarrant:

4.7% (1,587)
Texas:

0.3% (8,307)

United Kingdom
Northeast Tarrant:

3.6% (1,200)
Texas:

1.2% (36,176)

Canada
Northeast Tarrant:

3.5% (1,171)
Texas:

1.3% (36,802)

Pakistan
Northeast Tarrant:

3.1% (1,053)
Texas:

0.9% (26,981)

Germany
Northeast Tarrant:

2.7% (914)
Texas:

1.4% (39,249)

Philippines
Northeast Tarrant:

2.1% (708)
Texas:

1.6% (45,907)

Korea
Northeast Tarrant:

2.1% (706)
Texas:

1.2% (35,986)

Place of birth for U.S.-born residents:

  • This state: 209,232
  • Other state: 154,452
  • Northeast: 21,886
  • Midwest: 52,648
  • South: 50,134
  • West: 29,784

46% of Northeast Tarrant residents lived in the same house 5 years ago.
   Out of people who lived in different houses, 55% lived in this county.
   Out of people who lived in different counties, 46% lived in Texas.

Education attainment for males 25 years and older:

  • No schooling: 740
  • Nursery to 4th grade: 237
  • 5th and 6th grade: 1,203
  • 7th and 8th grade: 1,584
  • 9th grade: 1,749
  • 10th grade: 1,929
  • 11th grade: 2,095
  • 12th grade, no diploma: 3,019
  • High school graduate (or equivalency): 24,278
  • Less than 1 year of college: 9,978
  • Some college more than 1 year, no degree: 24,514
  • Associate degree: 8,994
  • Bachelor's degree: 31,177
  • Master's degree: 9,375
  • Professional school degree: 2,331
  • Doctorate degree: 1,154
Educational Attainment for Males

Education attainment for females 25 years and older:

  • No schooling: 962
  • Nursery to 4th grade: 260
  • 5th and 6th grade: 1,135
  • 7th and 8th grade: 1,958
  • 9th grade: 1,789
  • 10th grade: 2,495
  • 11th grade: 2,449
  • 12th grade, no diploma: 3,175
  • High school graduate (or equivalency): 33,119
  • Less than 1 year of college: 13,057
  • Some college more than 1 year, no degree: 24,280
  • Associate degree: 9,571
  • Bachelor's degree: 28,707
  • Master's degree: 7,786
  • Professional school degree: 1,116
  • Doctorate degree: 450
Educational Attainment for Females
Northeast Tarrant marital status for males
Northeast Tarrant marital status for females

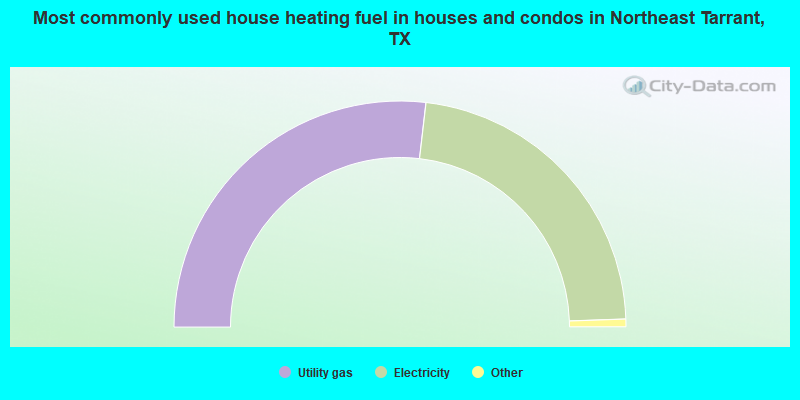
Housing units in structures:

  • One, detached: 107,896
  • One, attached: 4,338
  • Two: 1,581
  • 3 or 4: 6,441
  • 5 to 9: 10,691
  • 10 to 19: 8,633
  • 20 to 49: 3,267
  • 50 or more: 9,630
  • Mobile homes: 3,295
  • Boats, RVs, vans, etc.: 16

Median worth of mobile homes: $67,151

Housing units lacking complete plumbing facilities: 0.2%

Housing units lacking complete kitchen facilities: 0.4%
Year householders moved into residence in Northeast Tarrant
Houses and condos Apartments
Most commonly used house heating fuel in houses and condos in Northeast Tarrant, TX
  • 53.7%Utility gas
  • 45.2%Electricity
  • 0.9%Bottled, tank, or LP gas
  • 0.1%No fuel used
Most commonly used house heating fuel in apartments in Northeast Tarrant, TX
  • 84.5%Electricity
  • 14.3%Utility gas
  • 0.6%Bottled, tank, or LP gas
  • 0.4%No fuel used

Private vs. public school enrollment:

Students in private schools in grades 1 to 8 (elementary and middle school): 4,281
Here:

8.1%
Texas:

6.8%

Students in private schools in grades 9 to 12 (high school): 1,544
Here:

6.4%
Texas:

6.2%

Students in private undergraduate colleges: 2,481
Here:

15.9%
Texas:

15.4%
School Enrollment by Level of School for Male Students
School Enrollment by Level of School for Female Students
Age and Sex of Sensory-Disabled Noninstitutionalized Residents
Age and Sex of Physically-Disabled Noninstitutionalized Residents
Age and Sex of Mentally-Disabled Noninstitutionalized Residents
Age and Sex of Self-Care Disabled Noninstitutionalized Residents
Age and Sex of Go-Outside-Home Disabled Noninstitutionalized Residents
Age and Sex of Noninstitutionalized Residents with Employment Disability