Opa-locka, FL (Florida) Houses and Residents
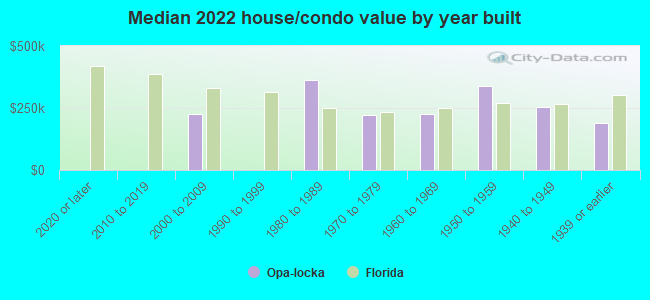
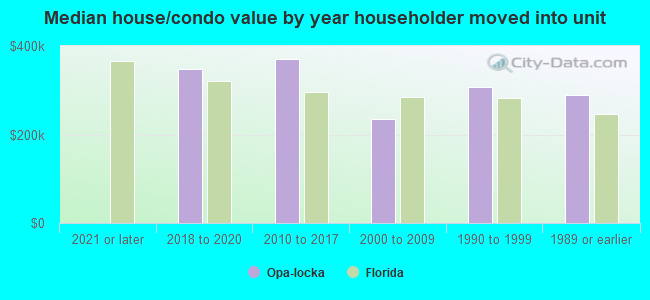
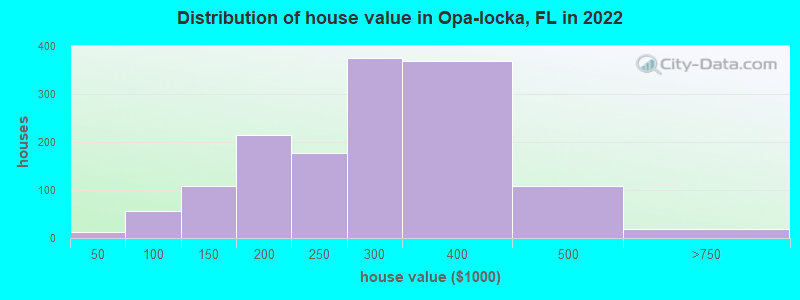
Estimated median house or condo value in 2022: $304,074 (it was $69,300 in 2000 )
Opa-locka:
$304,074Florida:
$354,100
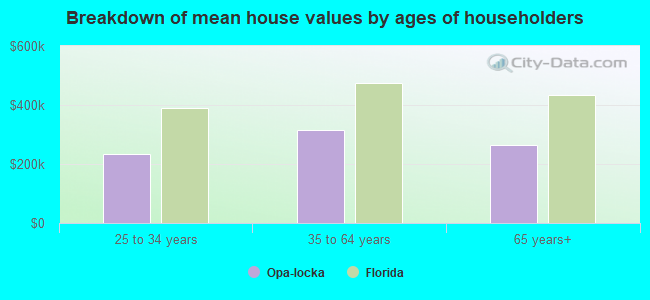
Lower value quartile - upper value quartile: $227,246 - $366,803Mean price in 2022: Detached houses: $316,454 Here:
$316,454State:
$500,941
Townhouses or other attached units: $247,680 Here:
$247,680State:
$370,869
In 5-or-more-unit structures: $203,715 Here:
$203,715State:
$447,145
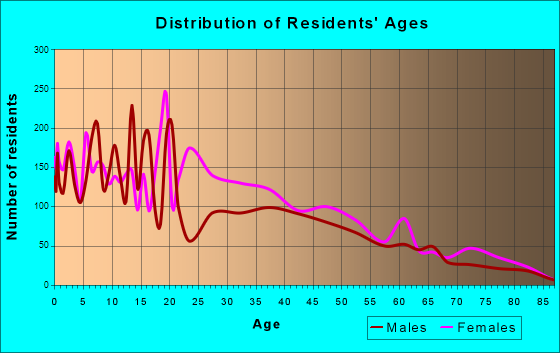
Total population: 16,460 (Urban population: 15,245, Rural population: 0)
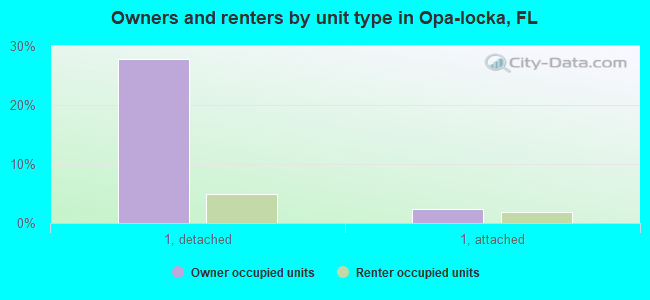
Houses: 6,771 (6,348 occupied: 2,056 owner occupied, 4,376 renter occupied )
% of renters here:
68%State:
33%
Housing density: 1,563 houses/condos per square mile
Median price asked for vacant for-sale houses and condos in 2022: $1,769,529.
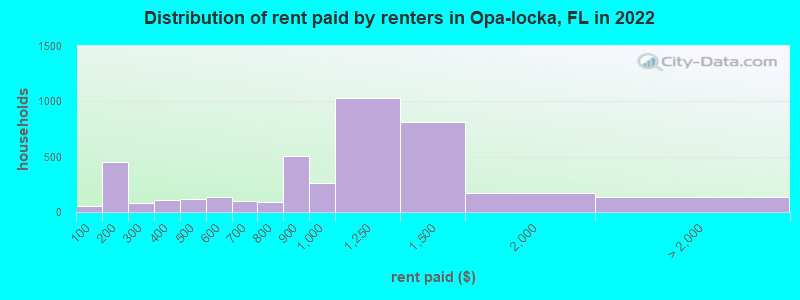
Median contract rent in 2022: $1,066 (lower quartile is $661, upper quartile is $1,330)
Median rent asked for vacant for-rent units in 2022: $1,551
Median gross rent in Opa-locka, FL in 2022: $1,143
Housing units in Opa-locka with a mortgage: 1,296 (94 second mortgage, 0 home equity loan, 62 both second mortgage and home equity loan )Houses without a mortgage: 0
Median household income for houses/condos with a mortgage: $72,819
Median monthly housing costs: $1,144
Data:
Median house or condo value ($)
Median house or condo value ($ change since 2000)
Median house or condo value ($) - White
Median house or condo value ($) - Black or African American
Median house or condo value ($) - Asian
Median house or condo value ($) - Hispanic or Latino
Median house or condo value ($) - American Indian and Alaska Native
Median house or condo value ($) - Multirace
Median house or condo value ($) - Other Race
Median price asked for mobile homes ($)
Household density (households per square mile)
Mean house or condo value by units in structure - 1, detached ($)
Mean house or condo value by units in structure - 1, attached ($)
Mean house or condo value by units in structure - 2 ($)
Mean house or condo value by units in structure by units in structure - 3 or 4 ($)
Mean house or condo value by units in structure - 5 or more ($)
Mean house or condo value by units in structure - Boat, RV, van, etc. ($)
Mean house or condo value by units in structure - Mobile home ($)
Median contract rent ($)
Median contract rent - Lower quartile ($)
Median contract rent - Upper quartile ($)
Median gross rent ($)
Urban houses (%)
Rural houses (%)
Houses occupied (%)
Houses occupied (% change since 2000)
Houses owner occupied (%)
Houses owner occupied (% change since 2000)
Houses renter occupied (%)
Houses renter occupied (% change since 2000)
Vacant housing units - For rent (%)
Vacant housing units - For rent (% change since 2000)
Vacant housing units - For sale only (%)
Vacant housing units - For sale only (% change since 2000)
Vacant housing units - Rented or sold, not occupied (%)
Vacant housing units - Rented or sold, not occupied (% change since 2000)
Vacant housing units - For seasonal, recreational, or occasional use (%)
Vacant housing units - For seasonal, recreational, or occasional use (% change since 2000)
Vacant housing units - For migrant workers (%)
Vacant housing units - For migrant workers (% change since 2000)
Vacant housing units - Other vacant (%)
Vacant housing units - Other vacant (% change since 2000)
Median monthly housing costs ($)
Median household income for houses/condos with a mortgage ($)
Median household income for houses/condos without a mortgage ($)
Median household income ($)
Median household income ($) - White
Median household income ($) - Black or African American
Median household income ($) - Asian
Median household income ($) - Hispanic or Latino
Median household income ($) - American Indian and Alaska Native
Median household income ($) - Multirace
Median household income ($) - Other Race
Mortgage status - with mortgage (%)
Mortgage status - with second mortgage (%)
Mortgage status - with home equity loan (%)
Mortgage status - with both second mortgage and home equity loan (%)
Mortgage status - without a mortgage (%)
Median year house/condo built
Median year apartment built
Household type by relationship - Male householder living alone (%)
Household type by relationship - Male householder not living alone (%)
Household type by relationship - Female householder living alone (%)
Household type by relationship - Female householder not living alone (%)
Household type by relationship - Opposite-Sex spouse (%)
Household type by relationship - Same-Sex spouse (%)
Household type by relationship - Opposite-Sex unmarried partner (%)
Household type by relationship - Same-Sex unmarried partner (%)
Household type by relationship - In group quarters (%)
Size of family households - 2-person household (%)
Size of family households - 3-person household (%)
Size of family households - 4-person household (%)
Size of family households - 5-person household (%)
Size of family households - 6-person household (%)
Size of family households - 7-or-more-person household (%)
Size of nonfamily households - 1-person household (%)
Size of nonfamily households - 2-person household (%)
Size of nonfamily households - 3-person household (%)
Size of nonfamily households - 4-person household (%)
Size of nonfamily households - 5-person household (%)
Size of nonfamily households - 6-person household (%)
Size of nonfamily households - 7-or-moreperson household (%)
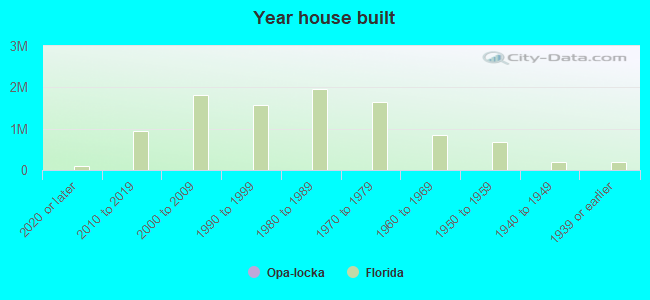
Year house built - Built 2010 or later (%)
Year house built - Built 2000 to 2009 (%)
Year house built - Built 1990 to 1999 (%)
Year house built - Built 1980 to 1989 (%)
Year house built - Built 1970 to 1979 (%)
Year house built - Built 1960 to 1969 (%)
Year house built - Built 1950 to 1959 (%)
Year house built - Built 1940 to 1949 (%)
Year house built - Built 1939 or earlier (%)
Median number of rooms in houses and condos
Median number of rooms in apartments
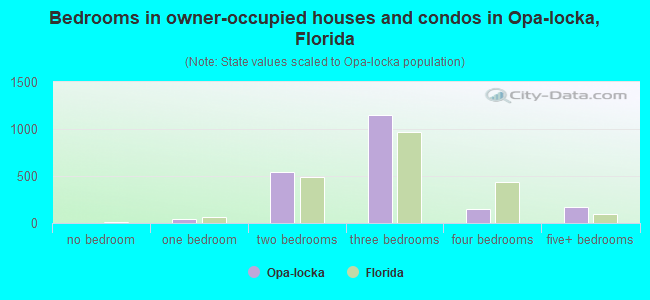
Median number of bedrooms in owner occupied houses
Mean number of bedrooms in owner occupied houses
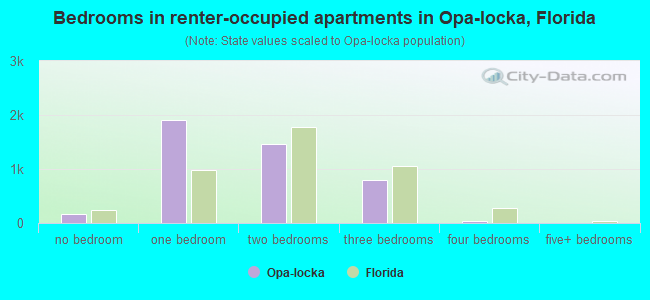
Median number of bedrooms in renter occupied houses
Mean number of bedrooms in renter occupied houses
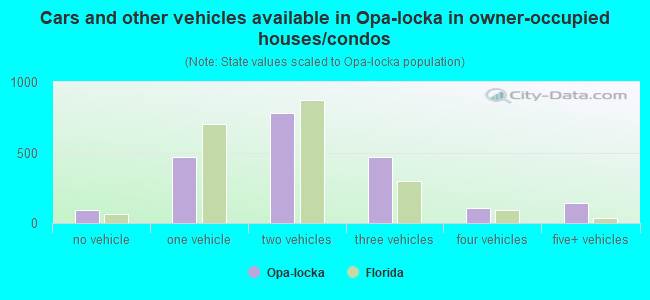
Median number of vehichles in owner occupied houses
Mean number of vehichles in owner occupied houses
Median number of vehichles in renter occupied houses
Mean number of vehichles in renter occupied houses
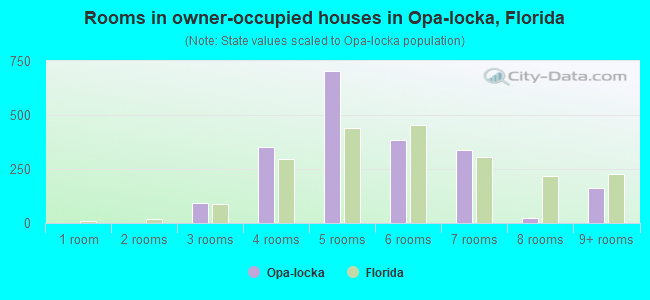
Rooms in owner-occupied houses - 1 room (%)
Rooms in owner-occupied houses - 2 rooms (%)
Rooms in owner-occupied houses - 3 rooms (%)
Rooms in owner-occupied houses - 4 rooms (%)
Rooms in owner-occupied houses - 5 rooms (%)
Rooms in owner-occupied houses - 6 rooms (%)
Rooms in owner-occupied houses - 7 rooms (%)
Rooms in owner-occupied houses - 8 rooms (%)
Rooms in owner-occupied houses - 9+ rooms (%)
Rooms in renter-occupied houses - 1 room (%)
Rooms in renter-occupied houses - 2 rooms (%)
Rooms in renter-occupied houses - 3 rooms (%)
Rooms in renter-occupied houses - 4 rooms (%)
Rooms in renter-occupied houses - 5 rooms (%)
Rooms in renter-occupied houses - 6 rooms (%)
Rooms in renter-occupied houses - 7 rooms (%)
Rooms in renter-occupied houses - 8 rooms (%)
Rooms in renter-occupied houses - 9+ rooms (%)
Bedrooms in owner-occupied houses - no bedrooms (%)
Bedrooms in owner-occupied houses - 1 bedroom (%)
Bedrooms in owner-occupied houses - 2 bedrooms (%)
Bedrooms in owner-occupied houses - 3 bedrooms (%)
Bedrooms in owner-occupied houses - 4 bedrooms (%)
Bedrooms in owner-occupied houses - 5+ bedrooms (%)
Bedrooms in renter-occupied houses - no bedrooms (%)
Bedrooms in renter-occupied houses - 1 bedroom (%)
Bedrooms in renter-occupied houses - 2 bedrooms (%)
Bedrooms in renter-occupied houses - 3 bedrooms (%)
Bedrooms in renter-occupied houses - 4 bedrooms (%)
Bedrooms in renter-occupied houses - 5+ bedrooms (%)
Vehicles available in owner-occupied houses - no vehicle available (%)
Vehicles available in owner-occupied houses - 1 vehicle available(%)
Vehicles available in owner-occupied houses - 2 Vehicles available (%)
Vehicles available in owner-occupied houses - 3 Vehicles available (%)
Vehicles available in owner-occupied houses - 4 Vehicles available (%)
Vehicles available in owner-occupied houses - 5+ Vehicles available (%)
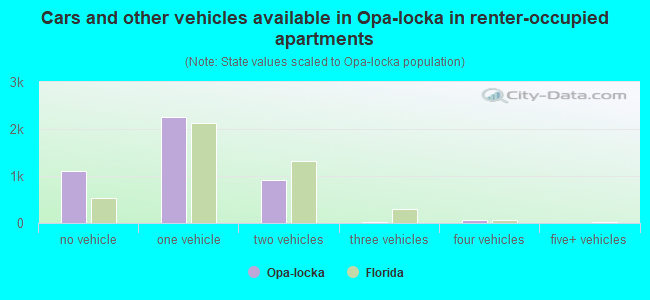
Vehicles available in renter-occupied houses - no vehicle available (%)
Vehicles available in renter-occupied houses - 1 vehicle available (%)
Vehicles available in renter-occupied houses - 2 Vehicles available (%)
Vehicles available in renter-occupied houses - 3 Vehicles available (%)
Vehicles available in renter-occupied houses - 4 Vehicles available (%)
Vehicles available in renter-occupied houses - 5+ Vehicles available (%)
Housing units in structures - 1, detached (%)
Housing units in structures - 1, attached (%)
Housing units in structures - 2 (%)
Housing units in structures - 3 or 4 (%)
Housing units in structures - 5 to 9 (%)
Housing units in structures - 10 to 19 (%)
Housing units in structures - 20 to 49 (%)
Housing units in structures - 50 or more (%)
Housing units in structures - Mobile home (%)
Housing units in structures - Boat, RV, van, etc. (%)
Housing units in structures - Owners - 1, detached (%)
Housing units in structures - Owners - 1, attached (%)
Housing units in structures - Owners - 2 (%)
Housing units in structures - Owners - 3 or 4 (%)
Housing units in structures - Owners - 5 to 9 (%)
Housing units in structures - Owners - 10 to 19 (%)
Housing units in structures - Owners - 20 to 49 (%)
Housing units in structures - Owners - 50 or more (%)
Housing units in structures - Owners - Mobile home (%)
Housing units in structures - Owners - Boat, RV, van, etc. (%)
Housing units in structures - Renters - 1, detached (%)
Housing units in structures - Renters - 1, attached (%)
Housing units in structures - Renters - 2 (%)
Housing units in structures - Renters - 3 or 4 (%)
Housing units in structures - Renters - 5 to 9 (%)
Housing units in structures - Renters - 10 to 19 (%)
Housing units in structures - Renters - 20 to 49 (%)
Housing units in structures - Renters - 50 or more (%)
Housing units in structures - Renters - Mobile home (%)
Housing units in structures - Renters - Boat, RV, van, etc. (%)
House/condo owner moved in on average (years ago)
Renter moved in on average (years ago)
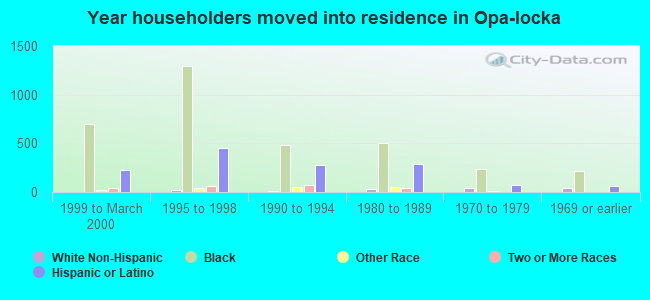
Year householder moved into unit - Moved in 1999 to March 2000 (%)
Year householder moved into unit - Moved in 1999 to March 2000 (%) - White
Year householder moved into unit - Moved in 1999 to March 2000 (%) - Black or African American
Year householder moved into unit - Moved in 1999 to March 2000 (%) - Asian
Year householder moved into unit - Moved in 1999 to March 2000 (%) - Hispanic or Latino
Year householder moved into unit - Moved in 1999 to March 2000 (%) - American Indian and Alaska Native
Year householder moved into unit - Moved in 1999 to March 2000 (%) - Multirace
Year householder moved into unit - Moved in 1999 to March 2000 (%) - Other Race
Year householder moved into unit - Moved in 1995 to 1998 (%)
Year householder moved into unit - Moved in 1995 to 1998 (%) - White
Year householder moved into unit - Moved in 1995 to 1998 (%) - Black or African American
Year householder moved into unit - Moved in 1995 to 1998 (%) - Asian
Year householder moved into unit - Moved in 1995 to 1998 (%) - Hispanic or Latino
Year householder moved into unit - Moved in 1995 to 1998 (%) - American Indian and Alaska Native
Year householder moved into unit - Moved in 1995 to 1998 (%) - Multirace
Year householder moved into unit - Moved in 1995 to 1998 (%) - Other Race
Year householder moved into unit - Moved in 1990 to 1994 (%)
Year householder moved into unit - Moved in 1990 to 1994 (%) - White
Year householder moved into unit - Moved in 1990 to 1994 (%) - Black or African American
Year householder moved into unit - Moved in 1990 to 1994 (%) - Asian
Year householder moved into unit - Moved in 1990 to 1994 (%) - Hispanic or Latino
Year householder moved into unit - Moved in 1990 to 1994 (%) - American Indian and Alaska Native
Year householder moved into unit - Moved in 1990 to 1994 (%) - Multirace
Year householder moved into unit - Moved in 1990 to 1994 (%) - Other Race
Year householder moved into unit - Moved in 1980 to 1989 (%)
Year householder moved into unit - Moved in 1980 to 1989 (%) - White
Year householder moved into unit - Moved in 1980 to 1989 (%) - Black or African American
Year householder moved into unit - Moved in 1980 to 1989 (%) - Asian
Year householder moved into unit - Moved in 1980 to 1989 (%) - Hispanic or Latino
Year householder moved into unit - Moved in 1980 to 1989 (%) - American Indian and Alaska Native
Year householder moved into unit - Moved in 1980 to 1989 (%) - Multirace
Year householder moved into unit - Moved in 1980 to 1989 (%) - Other Race
Year householder moved into unit - Moved in 1970 to 1979 (%)
Year householder moved into unit - Moved in 1970 to 1979 (%) - White
Year householder moved into unit - Moved in 1970 to 1979 (%) - Black or African American
Year householder moved into unit - Moved in 1970 to 1979 (%) - Asian
Year householder moved into unit - Moved in 1970 to 1979 (%) - Hispanic or Latino
Year householder moved into unit - Moved in 1970 to 1979 (%) - American Indian and Alaska Native
Year householder moved into unit - Moved in 1970 to 1979 (%) - Multirace
Year householder moved into unit - Moved in 1970 to 1979 (%) - Other Race
Year householder moved into unit - Moved in 1969 or earlier (%)
Year householder moved into unit - Moved in 1969 or earlier (%) - White
Year householder moved into unit - Moved in 1969 or earlier (%) - Black or African American
Year householder moved into unit - Moved in 1969 or earlier (%) - Asian
Year householder moved into unit - Moved in 1969 or earlier (%) - Hispanic or Latino
Year householder moved into unit - Moved in 1969 or earlier (%) - American Indian and Alaska Native
Year householder moved into unit - Moved in 1969 or earlier (%) - Multirace
Year householder moved into unit - Moved in 1969 or earlier (%) - Other Race
Housing units lacking complete plumbing facilities (%)
Housing units lacking complete kitchen facilities (%)
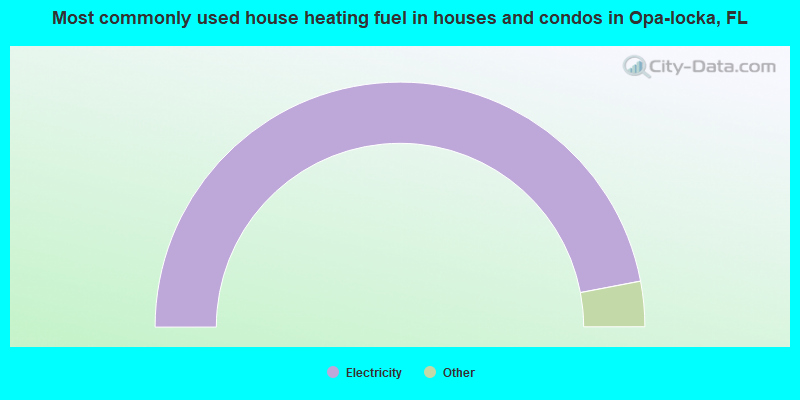
House heating fuel used in houses and condos - Utility gas (%)
House heating fuel used in houses and condos - Bottled, tank, or LP gas (%)
House heating fuel used in houses and condos - Electricity (%)
House heating fuel used in houses and condos - Fuel oil, kerosene, etc. (%)
House heating fuel used in houses and condos - Coal or coke (%)
House heating fuel used in houses and condos - Wood (%)
House heating fuel used in houses and condos - Solar energy (%)
House heating fuel used in houses and condos - Other fuel (%)
House heating fuel used in houses and condos - No fuel used (%)
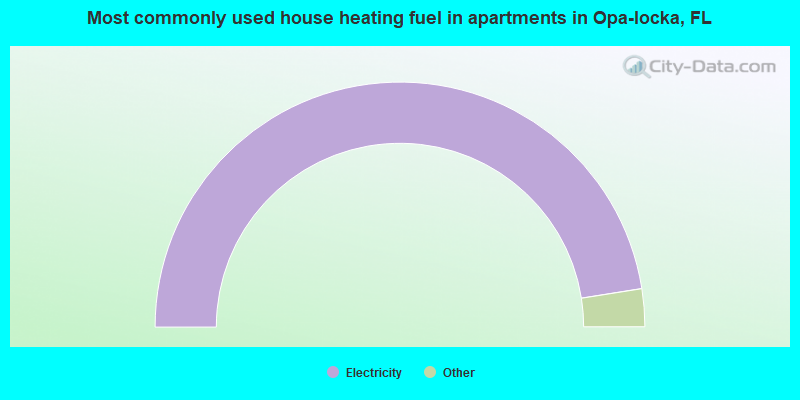
House heating fuel used in apartments - Utility gas (%)
House heating fuel used in apartments - Bottled, tank, or LP gas (%)
House heating fuel used in apartments - Electricity (%)
House heating fuel used in apartments - Fuel oil, kerosene, etc. (%)
House heating fuel used in apartments - Coal or coke (%)
House heating fuel used in apartments - Wood (%)
House heating fuel used in apartments - Solar energy (%)
House heating fuel used in apartments - Other fuel (%)
House heating fuel used in apartments - No fuel used (%)
Latest news about housing in Opa-locka, FL collected exclusively by city-data.com from local newspapers, TV, and radio stations
Median year house/condo built: 1958Median year apartment built: 1972Household type by relationship:
Households: 16,143
Male householders: 2,918 (1,267 living alone ), Female householders: 3,279 (836 living alone )1,485 spouses (1,404 opposite-sex spouses ), 478 unmarried partners , (478 opposite-sex unmarried partners ), 5,489 children (5,143 natural , 51 adopted , 294 stepchildren ), 630 grandchildren , 373 brothers or sisters , 405 parents , 0 foster children , 725 other relatives , 318 non-relatives In group quarters: 38
Size of family households: 1,582 2-persons , 1,030 3-persons , 792 4-persons , 376 5-persons , 99 6-persons , 158 7-or-more-persons .
Size of nonfamily households: 2,254 1-person , 138 2-persons .
792 married couples with children. single-parent households (451 men , 1,876 women ).
49.2% of residents of Opa-locka speak English at home. of residents speak Spanish at home (47% speak English very well , 16% speak English well , 20% speak English not well , 17% don't speak English at all ).of residents speak other Indo-European language at home (70% speak English very well , 30% speak English well ).of residents speak Asian or Pacific Island language at home (100% speak English not well ).of residents speak other language at home (14% speak English very well , 86% speak English well ).
Foreign born population: 5,952 (36.9%)of them are naturalized citizens )
Median number of rooms in houses and condos:
Median number of rooms in apartments
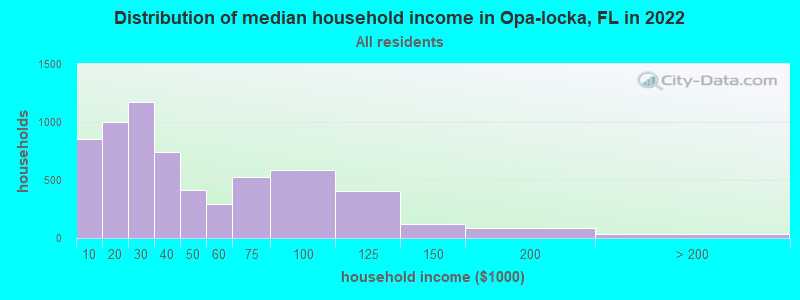
Opa-locka, FL household income distribution 850 Less than $10,0001,004 $10,000 to $19,9991,171 $20,000 to $29,999744 $30,000 to $39,999411 $40,000 to $49,999289 $50,000 to $59,999528 $60,000 to $74,999590 $75,000 to $99,999409 $100,000 to $124,999125 $125,000 to $149,99983 $150,000 to $199,99937 $200,000 or more
Home value of owner - occupied houses in 2022 in Opa-locka, FL 12 $20,000 to $24,99935 $80,000 to $89,99920 $90,000 to $99,99972 $100,000 to $124,99935 $125,000 to $149,99984 $150,000 to $174,999130 $175,000 to $199,999176 $200,000 to $249,999376 $250,000 to $299,999369 $300,000 to $399,999108 $400,000 to $499,99918 $500,000 to $749,999Rent paid by renters in 2022 in Opa-locka, FL 52 Less than $100113 $100 to $149341 $150 to $19951 $200 to $24925 $250 to $29994 $300 to $34913 $350 to $39940 $400 to $44973 $450 to $49993 $500 to $54943 $550 to $59954 $600 to $64948 $650 to $69924 $700 to $74969 $750 to $799502 $800 to $899265 $900 to $9991,028 $1,000 to $1,249811 $1,250 to $1,499170 $1,500 to $1,999134 $2,000 to $2,499
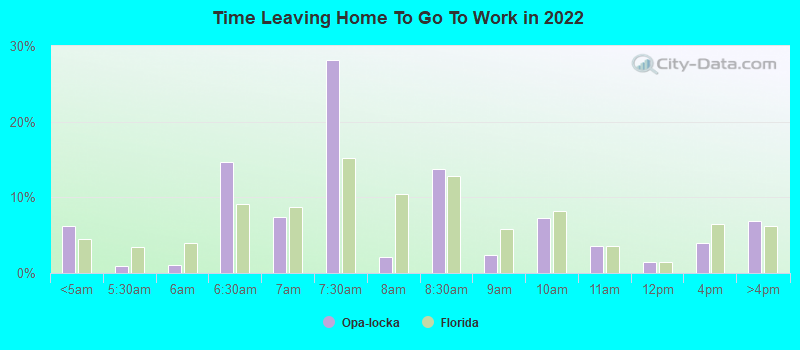
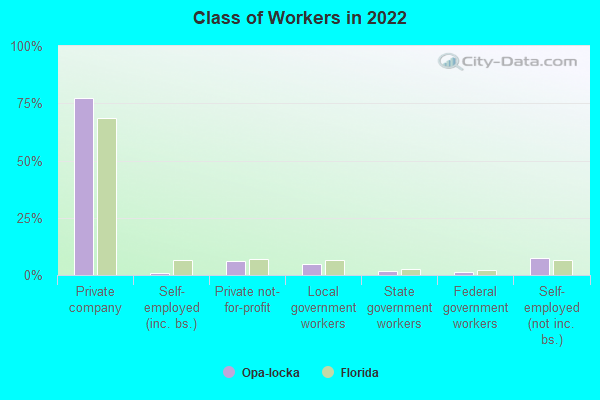
Percentage of workers working in this county: 91.5%Number of people working at home: 416 (6.0% of all workers )
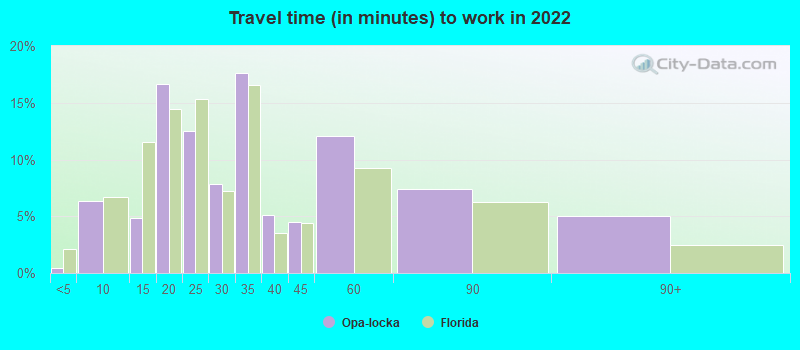
Travel time to work (commute)
Less than 5 minutes: 1315 to 9 minutes: 50010 to 14 minutes: 64015 to 19 minutes: 82420 to 24 minutes: 1,02525 to 29 minutes: 90130 to 34 minutes: 1,02235 to 39 minutes: 15240 to 44 minutes: 17345 to 59 minutes: 37760 to 89 minutes: 39690 or more minutes: 172
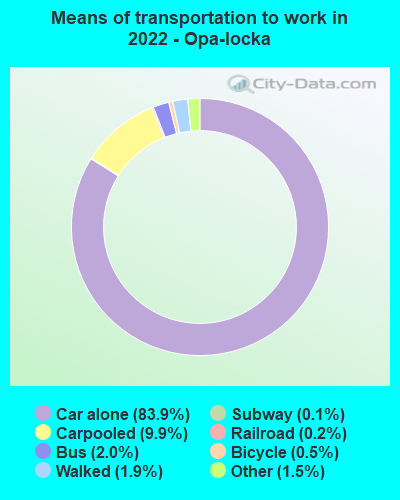
Means of transportation to work:
Drove a car alone: 8,715 (75.7%)Carpooled: 1,160 (10.1%)Bus : 193 (1.7%)Subway or elevated rail : 16 (0.1%)Long-distance train or commuter rail : 12 (0.1%)Light rail, streetcar or trolley : 36 (0.3%)Taxi: 198 (1.7%)Bicycle: 63 (0.5%)Walked: 223 (1.9%)Worked at home: 416 (3.6%)
Unemployment by race in 2022
Unemployment rate for White non-Hispanic residents 100.0% FemalesUnemployment rate for Black residents 6.9% Males4.5% FemalesUnemployment rate for other race residents 7.5% FemalesUnemployment rate for two or more race residents 0.6% MalesUnemployment rate for Hispanic or Latino residents 1.7% Males3.0% Females
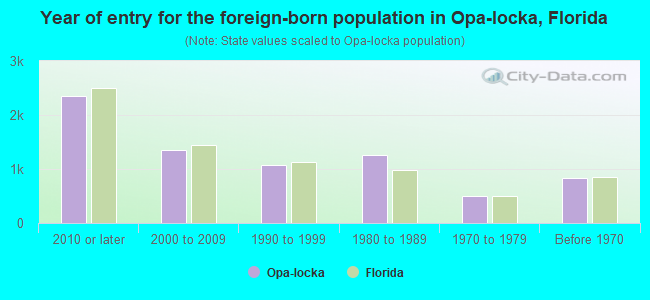
Year of entry for the foreign-born population in Opa-locka, Florida
2,351 2010 or later 1,358 2000 to 2009 1,078 1990 to 1999 1,262 1980 to 1989 506 1970 to 1979 828 Before 1970
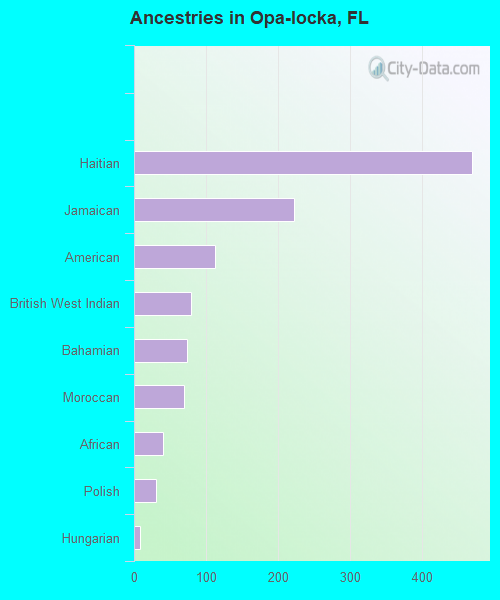
First ancestries reported:
Haitian: 470 (3.7%)
Jamaican: 222 (1.7%)
American: 113 (0.9%)
British West Indian: 79 (0.6%)
Bahamian: 74 (0.6%)
Moroccan: 69 (0.5%)
African: 41 (0.3%)
Polish: 31 (0.2%)
Hungarian: 8 (0.06%)
Brazilian: 4 (0.03%) Most common places of birth for foreign-born residents (%): Cuba Opa-locka:
54.4% (3,237)Florida:
22.0% (1,006,576)
Dominican Republic Opa-locka:
9.9% (591)Florida:
3.0% (137,727)
Colombia Opa-locka:
5.8% (344)Florida:
6.5% (298,669)
Haiti Opa-locka:
5.2% (307)Florida:
7.5% (342,375)
Honduras Opa-locka:
3.9% (235)Florida:
2.3% (107,160)
Nicaragua Opa-locka:
3.6% (217)Florida:
2.3% (105,066)
Other Caribbean Opa-locka:
2.8% (169)Florida:
0.3% (15,079)
Jamaica Opa-locka:
2.4% (145)Florida:
5.0% (227,319)
Ecuador Opa-locka:
1.7% (101)Florida:
1.2% (54,585)
Place of birth for U.S.-born residents:
This state: 8,473Other state: 1,235Northeast: 520Midwest: 69South: 574West: 49 91.7% of Opa-locka residents lived in the same house 1 years ago.
Out of people who lived in different houses, 44.3% lived in this county.
Out of people who lived in different counties, 49.7% lived in Florida.
Opa-locka:
91.7%State average:
86.3%
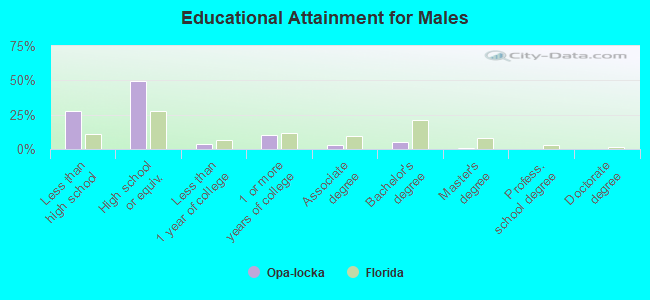
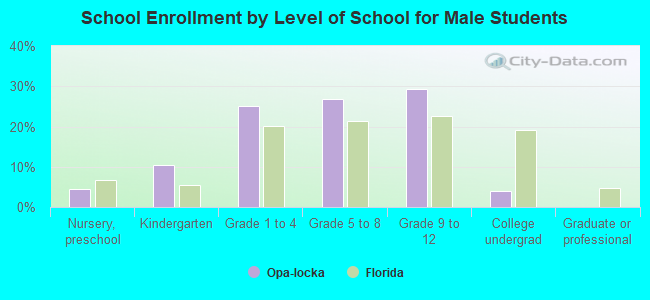
Education attainment for males 25 years and older:
No schooling: 802Nursery to 4th grade: 315th and 6th grade: 387th and 8th grade: 819th grade: 20810th grade: 3211th grade: 11712th grade, no diploma: 163High school graduate (or equivalency): 2,659Less than 1 year of college: 205Some college more than 1 year, no degree: 565Associate degree: 155Bachelor's degree: 265Master's degree: 49Professional school degree: 0Doctorate degree: 12
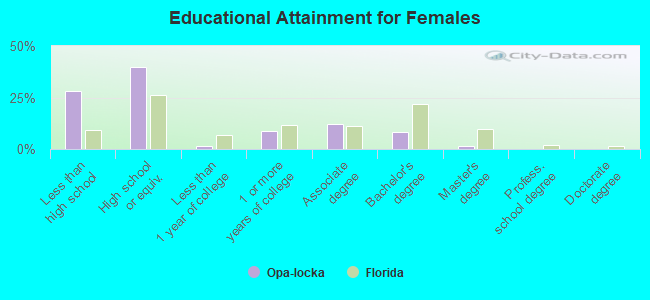
Education attainment for females 25 years and older:
No schooling: 594Nursery to 4th grade: 1645th and 6th grade: 217th and 8th grade: 939th grade: 23010th grade: 7311th grade: 18312th grade, no diploma: 175High school graduate (or equivalency): 2,172Less than 1 year of college: 87Some college more than 1 year, no degree: 470Associate degree: 650Bachelor's degree: 460Master's degree: 82Professional school degree: 0Doctorate degree: 0
Housing units in structures:
One, detached: 2,368One, attached: 254Two: 823 or 4: 4455 to 9: 54010 to 19: 65820 to 49: 1,24250 or more: 1,117Mobile homes: 60Housing units lacking complete plumbing facilities in 2022: 0.6%Housing units lacking complete kitchen facilities in 2022: 2.6%House/condo owner moved in on average 16 years ago
Renter moved in on average 5 years ago
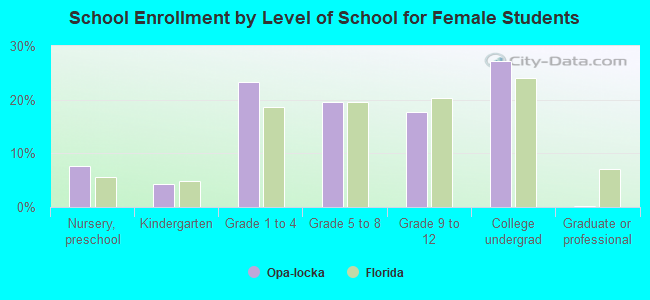
Private vs. public school enrollment:
Students in private schools in grades 1 to 8 (elementary and middle school): 174 Students in private schools in grades 9 to 12 (high school): 167 Students in private undergraduate colleges: 118