Orange, MA (Massachusetts) Houses and Residents
| Orange: | $216,001 |
| Massachusetts: | $534,700 |
Total population: 4,018 (Urban population: 3,226 (all inside urban clusters), Rural population: 670 (all nonfarm))
Houses: 1,636 (1,468 occupied: 1,039 owner occupied, 468 renter occupied)
| % of renters here: | 31% |
| State: | 38% |
Housing density: 273 houses/condos per square mile
Median price asked for vacant for-sale houses and condos in 2022: $384,659.
Median contract rent in 2022: $750 (lower quartile is $460, upper quartile is $1,004)
Median rent asked for vacant for-rent units in 2022: $687
Median gross rent in Orange, MA in 2022: $889
Housing units in Orange with a mortgage: 754 (150 second mortgage, 0 home equity loan, 130 both second mortgage and home equity loan)
Houses without a mortgage: 33
Median household income for houses/condos with a mortgage: $75,312
Median household income for apartments without a mortgage: $58,111
Median monthly housing costs: $1,105
Compare current foreclosures near Orange, MA:
| Photo | Address | Area | Beds / Baths | Price | Details |
|---|---|---|---|---|---|

|
#1
Prescott Ln
Orange, MA 01364
|
2,064 sq. feet
|
2 baths 3 beds |
show details | |

|
#2
Lake Mattawa Rd
Orange, MA 01364
|
1,666 sq. feet
|
1 baths 3 beds |
show details | |

|
#3
N Main St, Unit A
Orange, MA 01364
|
598 sq. feet
|
1 baths 2 beds |
show details | |

|
#4
Rogers Ave
Orange, MA 01364
|
1,296 sq. feet
|
1 baths 3 beds |
show details | |

|
#5
East Rd
Orange, MA 01364
|
960 sq. feet
|
1 baths 3 beds |
show details | |

|
#6
Eddy St
Orange, MA 01364
|
1,116 sq. feet
|
1 baths 2 beds |
show details | |

|
#7
Maynard St
Orange, MA 01364
|
1,640 sq. feet
|
2 baths 3 beds |
show details | |

|
#8
Wheeler Ave
Orange, MA 01364
|
1,863 sq. feet
|
2 baths 3 beds |
show details | |

|
#9
E River St
Orange, MA 01364
|
1,332 sq. feet
|
1 baths 3 beds |
show details | |

|
#10
E River St Lot 122
Orange, MA 01364
|
- sq. feet
|
- baths - beds |
show details |
| Photo | Address | Area | Beds / Baths | Price | Details |
|---|---|---|---|---|---|

|
#11
E Main St
Orange, MA 01364
|
- sq. feet
|
- baths - beds |
show details | |

|
#12
E River St Apt 912
Orange, MA 01364
|
- sq. feet
|
- baths - beds |
show details | |

|
#13
S Main St # 1
Orange, MA 01364
|
- sq. feet
|
- baths - beds |
show details | |

|
#14
W River St
Orange, MA 01364
|
- sq. feet
|
- baths - beds |
show details | |

|
#15
Parker St
Gardner, MA 01440
|
1,980 sq. feet
|
2 baths 4 beds |
$469,900
|
show details |

|
#16
Lampblack Rd
Greenfield, MA 01301
|
2,078 sq. feet
|
1 baths 3 beds |
$369,900
|
show details |

|
#17
Whipple Hill Rd
Winchester, NH 03470
|
1,374 sq. feet
|
2 baths 2 beds |
$379,900
|
show details |

|
#18
Tully Rd
Orange, MA 01364
|
- sq. feet
|
- baths - beds |
show details | |

|
#19
West St
Greenfield, MA 01301
|
1,858 sq. feet
|
2 baths 3 beds |
show details | |

|
#20
J St
Turners Falls, MA 01376
|
3,256 sq. feet
|
2 baths 7 beds |
show details |
| Photo | Address | Area | Beds / Baths | Price | Details |
|---|---|---|---|---|---|

|
#21
School St
Winchendon, MA 01475
|
1,518 sq. feet
|
1 baths 3 beds |
show details | |

|
#22
Teel Rd
Winchendon, MA 01475
|
1,080 sq. feet
|
1 baths 3 beds |
show details | |

|
#23
Hillcrest Dr
Bernardston, MA 01337
|
1,120 sq. feet
|
1 baths 3 beds |
show details | |

|
#24
Shelburne Rd
Greenfield, MA 01301
|
1,382 sq. feet
|
1 baths 2 beds |
show details | |

|
#25
West St
Gardner, MA 01440
|
1,320 sq. feet
|
2 baths 3 beds |
show details | |

|
#26
Wauwinet Rd
Barre, MA 01005
|
2,560 sq. feet
|
2 baths 5 beds |
show details | |

|
#27
Maple St
Winchendon, MA 01475
|
903 sq. feet
|
1 baths 2 beds |
show details | |

|
#28
West St
Winchendon, MA 01475
|
1,584 sq. feet
|
1 baths 3 beds |
show details | |

|
#29
Barthel Ave
Gardner, MA 01440
|
1,007 sq. feet
|
1 baths 2 beds |
show details | |

|
#30
Elm St
Greenfield, MA 01301
|
1,160 sq. feet
|
1 baths 3 beds |
show details |
| Photo | Address | Area | Beds / Baths | Price | Details |
|---|---|---|---|---|---|

|
#31
Maple St
Greenfield, MA 01301
|
1,216 sq. feet
|
1 baths 3 beds |
show details | |

|
#32
Meridian St
Greenfield, MA 01301
|
768 sq. feet
|
1 baths 2 beds |
show details | |

|
#33
Converse Dr
Winchendon, MA 01475
|
2,108 sq. feet
|
1 baths 3 beds |
show details | |

|
#34
Chapman St
Greenfield, MA 01301
|
1,472 sq. feet
|
1 baths 2 beds |
show details | |

|
#35
Juniper St
Winchendon, MA 01475
|
1,687 sq. feet
|
1 baths 4 beds |
show details | |

|
#36
Garfield St
Greenfield, MA 01301
|
2,260 sq. feet
|
2 baths 4 beds |
show details | |

|
#37
Spruce St
Winchendon, MA 01475
|
1,504 sq. feet
|
1 baths 3 beds |
show details | |

|
#38
Deerfield St
Greenfield, MA 01301
|
1,496 sq. feet
|
2 baths 3 beds |
show details | |

|
#39
Hope St
Greenfield, MA 01301
|
1,619 sq. feet
|
1 baths 3 beds |
show details | |

|
#40
Leo Dr
Gardner, MA 01440
|
1,206 sq. feet
|
1 baths 3 beds |
show details |
| Photo | Address | Area | Beds / Baths | Price | Details |
|---|---|---|---|---|---|

|
#41
Forest Ave
Greenfield, MA 01301
|
1,764 sq. feet
|
1 baths 4 beds |
show details | |

|
#42
James St
Greenfield, MA 01301
|
2,176 sq. feet
|
2 baths 4 beds |
show details | |

|
#43
Ash St
Winchendon, MA 01475
|
960 sq. feet
|
1 baths 2 beds |
show details | |

|
#44
Pine St
Gardner, MA 01440
|
3,228 sq. feet
|
2 baths 4 beds |
show details | |

|
#45
Greenwood Pl
Gardner, MA 01440
|
1,206 sq. feet
|
1 baths 2 beds |
show details | |

|
#46
Root Rd
Barre, MA 01005
|
3,528 sq. feet
|
2 baths 4 beds |
show details | |

|
#47
Chelsea St
Gardner, MA 01440
|
1,287 sq. feet
|
1 baths 3 beds |
show details | |

|
#48
Braeburn Rd
South Deerfield, MA 01373
|
1,661 sq. feet
|
1 baths 3 beds |
show details | |

|
#49
Summer St
Gardner, MA 01440
|
1,893 sq. feet
|
2 baths 5 beds |
show details | |

|
Check over 1 million property listings on Foreclosure.com!
|
browse all offers | |||

Latest news about housing in Orange, MA collected exclusively by city-data.com from local newspapers, TV, and radio stations

 | How Much Massachusetts Households Make Per Year: Census Data (37 replies) |
| 2023 Real Estate Observations (5278 replies) |
| 2021 Real Estate Observations (1729 replies) |
| MBTA Orange Line Safety? Back Bay to Mass Ave at night (102 replies) |
| Anyone Here Buying Real Estate During the Covid-19 Crisis? (207 replies) |
| Eastern MA Towns with Historic Homes, Large Lots, & Cute Town Center (22 replies) |
Median year apartment built: 1938
Household type by relationship:
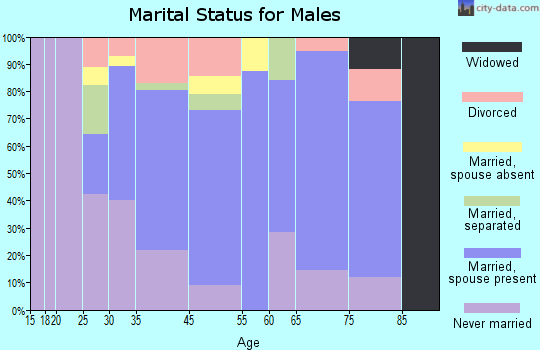
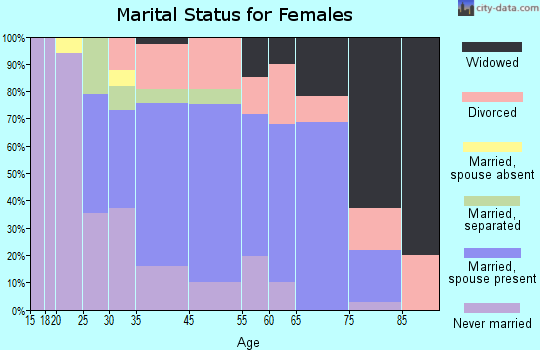
Households: 3,726- Male householders: 723 (266 living alone), Female householders: 740 (213 living alone)
734 spouses (734 opposite-sex spouses), 102 unmarried partners, (93 opposite-sex unmarried partners), 1,020 children (883 natural, 54 adopted, 81 stepchildren), 139 grandchildren, 26 brothers or sisters, 86 parents, 0 foster children, 53 other relatives, 58 non-relatives
- In group quarters: 38
Size of family households: 347 2-persons, 279 3-persons, 154 4-persons, 54 5-persons, 57 6-persons, 21 7-or-more-persons.
Size of nonfamily households: 472 1-person, 96 2-persons, 12 3-persons.
547 married couples with children.
99 single-parent households (20 men, 79 women).
93.4% of residents of Orange speak English at home.
5.0% of residents speak Spanish at home (58% speak English very well, 12% speak English well, 29% speak English not well).
0.8% of residents speak other Indo-European language at home (100% speak English very well).
Foreign born population: 228 (6.1%)
(30.3% of them are naturalized citizens)
| Here: | 6.8 |
| State: | 6.5 |
| Here: | 4.3 |
| State: | 4.0 |

- Bedrooms in owner-occupied houses and condos in Orange, Massachusetts
- 0no bedroom
- 441 bedroom
- 1892 bedrooms
- 4643 bedrooms
- 2094 bedrooms
- 1335+ bedrooms

- Bedrooms in renter-occupied apartments in Orange, Massachusetts
- 15no bedroom
- 1401 bedroom
- 1452 bedrooms
- 1173 bedrooms
- 74 bedrooms
- 435+ bedrooms

- Cars and other vehicles available in Orange in owner-occupied houses/condos
- 51no vehicle
- 2501 vehicle
- 4772 vehicles
- 1223 vehicles
- 824 vehicles
- 565+ vehicles

- Cars and other vehicles available in Orange in renter-occupied apartments
- 89no vehicle
- 2571 vehicle
- 1142 vehicles
- 83 vehicles
- 04 vehicles
- 05+ vehicles

- Rooms in owner-occupied houses in Orange, Massachusetts
- 01 room
- 02 rooms
- 283 rooms
- 374 rooms
- 1295 rooms
- 2486 rooms
- 2267 rooms
- 1338 rooms
- 2399+ rooms

- Rooms in renter-occupied apartments in Orange, Massachusetts
- 01 room
- 972 rooms
- 473 rooms
- 1004 rooms
- 895 rooms
- 276 rooms
- 597 rooms
- 08 rooms
- 509+ rooms


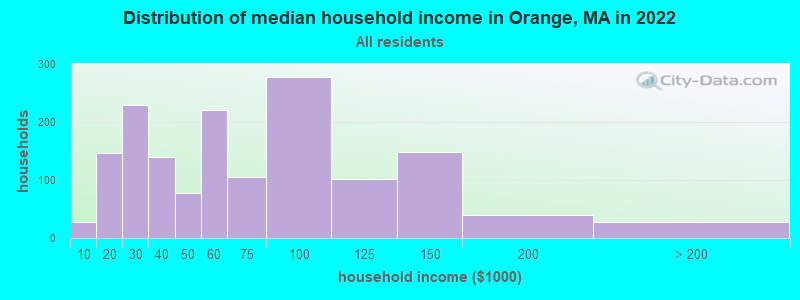
Orange, MA household income distribution

- 27Less than $10,000
- 147$10,000 to $19,999
- 230$20,000 to $29,999
- 140$30,000 to $39,999
- 78$40,000 to $49,999
- 220$50,000 to $59,999
- 105$60,000 to $74,999
- 278$75,000 to $99,999
- 101$100,000 to $124,999
- 149$125,000 to $149,999
- 40$150,000 to $199,999
- 27$200,000 or more
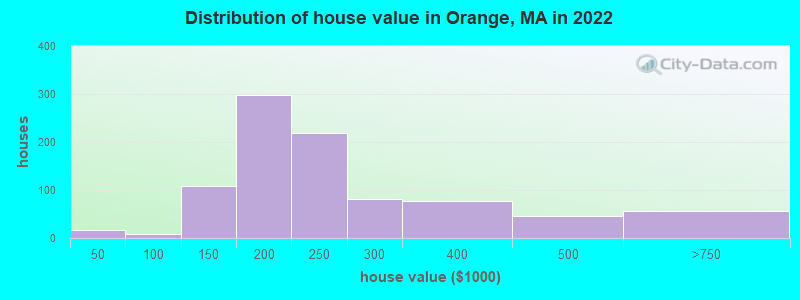
Home value of owner - occupied houses in 2022 in Orange, MA
-
- 14$15,000 to $19,999
- 2$40,000 to $49,999
- 6$90,000 to $99,999
- 17$100,000 to $124,999
- 91$125,000 to $149,999
- 207$150,000 to $174,999
- 91$175,000 to $199,999
- 218$200,000 to $249,999
- 80$250,000 to $299,999
- 78$300,000 to $399,999
- 45$400,000 to $499,999
- 56$500,000 to $749,999
Rent paid by renters in 2022 in Orange, MA
-
- 12$200 to $249
- 10$250 to $299
- 30$400 to $449
- 48$450 to $499
- 12$550 to $599
- 37$600 to $649
- 17$650 to $699
- 13$700 to $749
- 17$750 to $799
- 65$800 to $899
- 29$900 to $999
- 117$1,000 to $1,249
- 15No cash rent


Percentage of workers working in this county: 63.5%
Number of people working at home: 76 (4.7% of all workers)
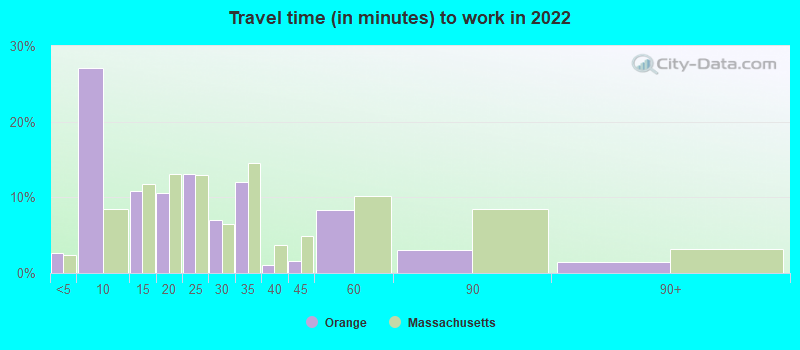
Travel time to work (commute)
- Less than 5 minutes: 24
- 5 to 9 minutes: 266
- 10 to 14 minutes: 182
- 15 to 19 minutes: 145
- 20 to 24 minutes: 147
- 25 to 29 minutes: 90
- 30 to 34 minutes: 216
- 35 to 39 minutes: 58
- 40 to 44 minutes: 165
- 45 to 59 minutes: 114
- 60 to 89 minutes: 67
- 90 or more minutes: 54
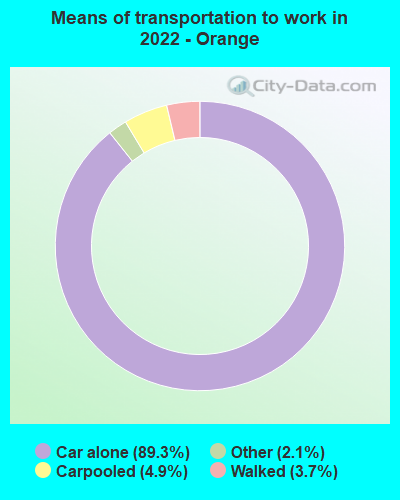
Means of transportation to work:
- Drove a car alone: 616 (79.1%)
- Carpooled: 35 (4.5%)
- Taxi: 18 (2.3%)
- Walked: 24 (3.1%)
- Worked at home: 76 (9.8%)

- Unemployment by race in 2022
- Unemployment rate for White non-Hispanic residents
- 2.7%Males
- 12.4%Females
- Unemployment rate for Black residents
- 57.6%Males
- Unemployment rate for two or more race residents
- 55.2%Males
- Unemployment rate for Hispanic or Latino residents
- 43.2%Males

- Year of entry for the foreign-born population in Orange, Massachusetts
- 372010 or later
- 312000 to 2009
- 631990 to 1999
- 111980 to 1989
- 01970 to 1979
- 44Before 1970

First ancestries reported:
- French Canadian: 269 (15.5%)
- American: 265 (15.3%)
- English: 152 (8.8%)
- Irish: 121 (7.0%)
- Italian: 118 (6.8%)
- French: 99 (5.7%)
- European: 93 (5.4%)
- German: 45 (2.6%)
- Polish: 29 (1.7%)
- Scotch-Irish: 25 (1.4%)
- British: 24 (1.4%)
- Scottish: 24 (1.4%)
- Lithuanian: 20 (1.2%)
- Austrian: 16 (0.9%)
- U.S. Virgin Islander: 15 (0.9%)
- Norwegian: 11 (0.6%)
- Dutch: 7 (0.4%)
- Swedish: 7 (0.4%)
- Armenian: 6 (0.3%)
- African: 3 (0.2%)
Most common places of birth for foreign-born residents (%):
| Orange: | 43.3% (88) |
| Massachusetts: | 2.3% (27,810) |
| Orange: | 11.3% (23) |
| Massachusetts: | 0.6% (7,301) |
| Orange: | 7.9% (16) |
| Massachusetts: | 1.0% (12,529) |
| Orange: | 5.9% (12) |
| Massachusetts: | 0.1% (851) |
| Orange: | 5.4% (11) |
| Massachusetts: | 0.2% (1,846) |
| Orange: | 5.4% (11) |
| Massachusetts: | 0.2% (2,666) |
| Orange: | 5.4% (11) |
| Massachusetts: | 2.3% (28,158) |
| Orange: | 4.9% (10) |
| Massachusetts: | 0.4% (4,618) |
| Orange: | 4.9% (10) |
| Massachusetts: | 7.6% (92,959) |
| Orange: | 4.4% (9) |
| Massachusetts: | 1.0% (12,709) |
| Orange: | 2.5% (5) |
| Massachusetts: | 1.0% (12,327) |
Place of birth for U.S.-born residents:
- This state: 2,933
- Other state: 512
- Northeast: 139
- Midwest: 83
- South: 273
- West: 8
94.2% of Orange residents lived in the same house 1 years ago.
Out of people who lived in different houses, 36.1% lived in this county.
Out of people who lived in different counties, 87.5% lived in Massachusetts.
| Orange: | 94.2% |
| State average: | 87.7% |
Education attainment for males 25 years and older:
- No schooling: 0
- Nursery to 4th grade: 0
- 5th and 6th grade: 0
- 7th and 8th grade: 15
- 9th grade: 17
- 10th grade: 33
- 11th grade: 0
- 12th grade, no diploma: 14
- High school graduate (or equivalency): 559
- Less than 1 year of college: 147
- Some college more than 1 year, no degree: 215
- Associate degree: 81
- Bachelor's degree: 106
- Master's degree: 72
- Professional school degree: 10
- Doctorate degree: 0

Education attainment for females 25 years and older:
- No schooling: 13
- Nursery to 4th grade: 0
- 5th and 6th grade: 0
- 7th and 8th grade: 0
- 9th grade: 9
- 10th grade: 8
- 11th grade: 36
- 12th grade, no diploma: 0
- High school graduate (or equivalency): 634
- Less than 1 year of college: 72
- Some college more than 1 year, no degree: 170
- Associate degree: 211
- Bachelor's degree: 128
- Master's degree: 85
- Professional school degree: 33
- Doctorate degree: 0

Housing units in structures:
- One, detached: 991
- One, attached: 7
- Two: 230
- 3 or 4: 214
- 5 to 9: 184
- 10 to 19: 4
- Mobile homes: 4
House/condo owner moved in on average 16 years ago
Renter moved in on average 2 years ago

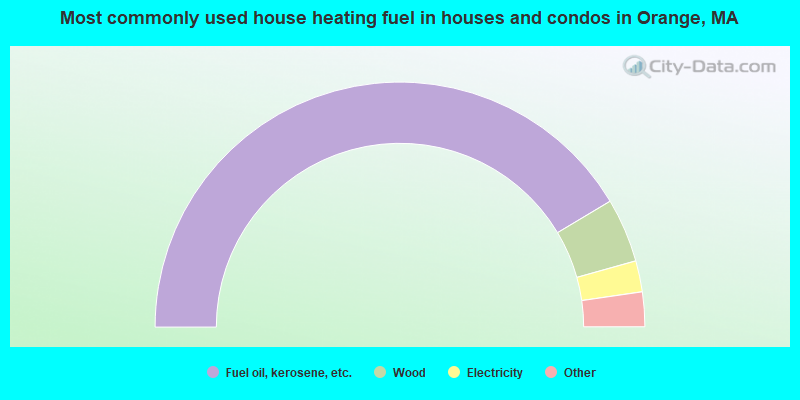
- 83.1%Fuel oil, kerosene, etc.
- 8.5%Wood
- 4.1%Electricity
- 2.3%Utility gas
- 2.1%Bottled, tank, or LP gas

- 61.3%Fuel oil, kerosene, etc.
- 29.5%Electricity
- 9.2%Wood
Private vs. public school enrollment:
| Here: | 0.0% |
| Massachusetts: | 10.3% |
| Here: | 12.8% |
| Massachusetts: | 12.3% |
| Here: | 26.4% |
| Massachusetts: | 51.2% |


