Housing density: 4,003 houses/condos per square mile
Median price asked for vacant for-sale houses and condos in 2022 in this county: $272,098.
Median contract rent in 2022: $641 (lower quartile is $498, upper quartile is $842)
Median gross rent in Pelzer, SC in 2022: $970
Housing units in Pelzer with a mortgage: 135 (0 second mortgage, 0 home equity loan, 0 both second mortgage and home equity loan) Houses without a mortgage: 0
Median household income for houses/condos with a mortgage: $48,681
Median household income for apartments without a mortgage: $54,231
Size of family households: 168 2-persons, 83 3-persons, 57 4-persons, 18 5-persons, 32 6-persons, 3 7-or-more-persons.
Size of nonfamily households: 354 1-person, 16 2-persons, 2 3-persons.
176 married couples with children.
83 single-parent households (0 men, 83 women).
93.0% of residents of Pelzer speak English at home.
6.1% of residents speak Spanish at home (94% speak English very well, 4% speak English well, 1% speak English not well).
1.1% of residents speak other Indo-European language at home (100% speak English very well).
Foreign born population: 40 (2.6%)
(112.5% of them are naturalized citizens)
Rooms in owner-occupied houses in Pelzer, South Carolina
131 room
02 rooms
33 rooms
694 rooms
595 rooms
1046 rooms
2767 rooms
168 rooms
109+ rooms
Rooms in renter-occupied apartments in Pelzer, South Carolina
01 room
02 rooms
23 rooms
604 rooms
695 rooms
286 rooms
337 rooms
48 rooms
09+ rooms
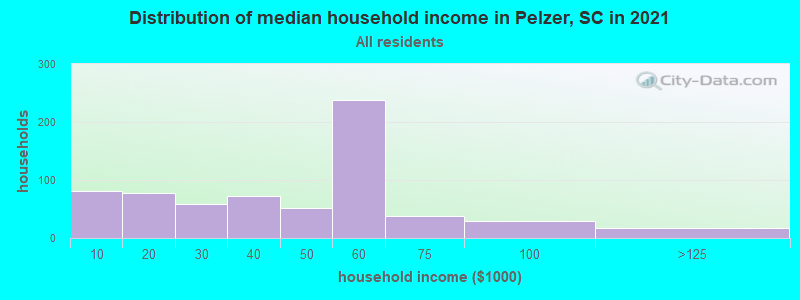
Pelzer, SC household income distribution
133Less than $10,000
55$10,000 to $19,999
40$20,000 to $29,999
77$30,000 to $39,999
75$40,000 to $49,999
176$50,000 to $59,999
63$60,000 to $74,999
45$75,000 to $99,999
25$100,000 to $124,999
4$125,000 to $149,999
4$200,000 or more
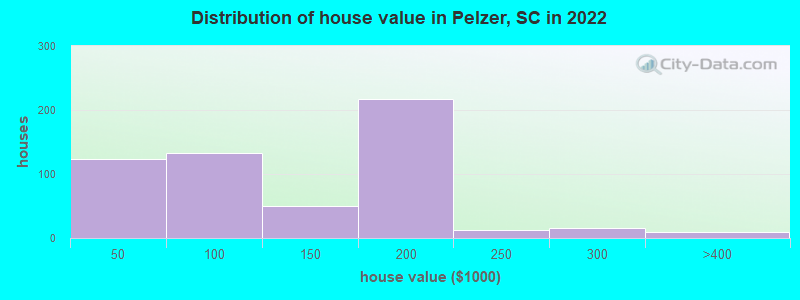
Home value of owner - occupied houses in 2022 in Pelzer, SC
10Less than $10,000
8$15,000 to $19,999
19$20,000 to $24,999
8$25,000 to $29,999
1$35,000 to $39,999
75$40,000 to $49,999
6$50,000 to $59,999
19$60,000 to $69,999
6$70,000 to $79,999
10$80,000 to $89,999
14$90,000 to $99,999
30$100,000 to $124,999
19$125,000 to $149,999
26$150,000 to $174,999
190$175,000 to $199,999
12$200,000 to $249,999
15$250,000 to $299,999
8$300,000 to $399,999
Rent paid by renters in 2022 in Pelzer, SC
11$200 to $249
2$350 to $399
18$450 to $499
40$500 to $549
12$550 to $599
8$600 to $649
10$650 to $699
2$750 to $799
28$800 to $899
7$900 to $999
8$1,000 to $1,249
12$1,250 to $1,499
18No cash rent
Percentage of workers working in this county: 48.0% Number of people working at home: 18 (3.9% of all workers)
Travel time to work (commute)
Less than 5 minutes: 15
5 to 9 minutes: 27
10 to 14 minutes: 21
15 to 19 minutes: 23
20 to 24 minutes: 69
25 to 29 minutes: 37
30 to 34 minutes: 125
35 to 39 minutes: 33
40 to 44 minutes: 41
45 to 59 minutes: 32
60 to 89 minutes: 2
90 or more minutes: 18
Means of transportation to work:
Drove a car alone: 46 (95.8%)
Walked: 2 (4.2%)
Unemployment by race in 2022
Unemployment rate for White non-Hispanic residents
13.8%Males
8.4%Females
First ancestries reported:
American: 386 (42.4%)
Irish: 50 (5.5%)
Italian: 49 (5.4%)
English: 32 (3.5%)
French: 20 (2.2%)
German: 17 (1.9%)
Scotch-Irish: 17 (1.9%)
Russian: 16 (1.8%)
Dutch: 8 (0.9%)
Bulgarian: 6 (0.7%)
Scottish: 4 (0.4%)
French Canadian: 1 (0.1%)
Most common places of birth for foreign-born residents (%):
Colombia
Pelzer:
25.6% (10)
South Carolina:
4.3% (11,533)
Russia
Pelzer:
20.5% (8)
South Carolina:
1.3% (3,522)
Bulgaria
Pelzer:
12.8% (5)
South Carolina:
0.2% (566)
Guatemala
Pelzer:
12.8% (5)
South Carolina:
3.4% (9,058)
Dominican Republic
Pelzer:
7.7% (3)
South Carolina:
0.9% (2,357)
Trinidad and Tobago
Pelzer:
7.7% (3)
South Carolina:
0.4% (1,084)
Place of birth for U.S.-born residents:
This state: 792
Other state: 710
Northeast: 149
Midwest: 73
South: 377
West: 109
83.6% of Pelzer residents lived in the same house 1 years ago. Out of people who lived in different houses, 35.2% lived in this county. Out of people who lived in different counties, 81.4% lived in South Carolina.
Pelzer:
83.6%
State average:
86.5%
Education attainment for males 25 years and older:
No schooling: 7
Nursery to 4th grade: 0
5th and 6th grade: 7
7th and 8th grade: 9
9th grade: 5
10th grade: 24
11th grade: 33
12th grade, no diploma: 8
High school graduate (or equivalency): 162
Less than 1 year of college: 32
Some college more than 1 year, no degree: 23
Associate degree: 20
Bachelor's degree: 18
Master's degree: 7
Professional school degree: 0
Doctorate degree: 0
Education attainment for females 25 years and older:
No schooling: 5
Nursery to 4th grade: 0
5th and 6th grade: 0
7th and 8th grade: 9
9th grade: 15
10th grade: 21
11th grade: 0
12th grade, no diploma: 20
High school graduate (or equivalency): 254
Less than 1 year of college: 27
Some college more than 1 year, no degree: 60
Associate degree: 37
Bachelor's degree: 13
Master's degree: 182
Professional school degree: 0
Doctorate degree: 0
Housing units in structures:
One, detached: 728
3 or 4: 2
Mobile homes: 49
Housing units lacking complete plumbing facilities in 2022: 3.7%
Housing units lacking complete kitchen facilities in 2022: 5.7%