Peterborough, NH (New Hampshire) Houses and Residents
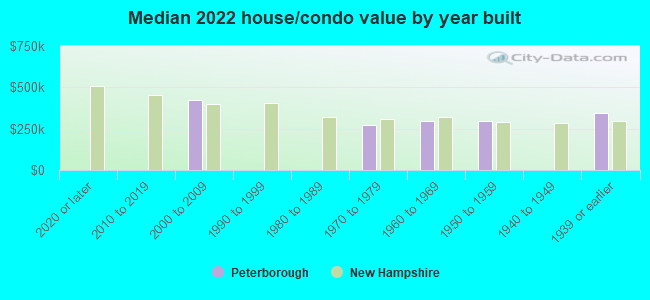
| Peterborough: | $338,744 |
| New Hampshire: | $384,700 |
Total population: 3,103 (Urban population: 2,614 (all inside urban clusters), Rural population: 369 (all nonfarm))
Houses: 1,617 (1,295 occupied: 697 owner occupied, 593 renter occupied)
| % of renters here: | 46% |
| State: | 28% |
Housing density: 341 houses/condos per square mile
Median price asked for vacant for-sale houses and condos in 2022: $844,662.
Median contract rent in 2022: $1,239 (lower quartile is $831, upper quartile is $1,462)
Median rent asked for vacant for-rent units in 2022: $815
Median gross rent in Peterborough, NH in 2022: $1,432
Housing units in Peterborough with a mortgage: 347 (73 second mortgage, 0 home equity loan, 75 both second mortgage and home equity loan)
Houses without a mortgage: 12
Median household income for houses/condos with a mortgage: $142,724
Median household income for apartments without a mortgage: $69,440
Median monthly housing costs: $1,419
Compare current foreclosures near Peterborough, NH:
| Photo | Address | Area | Beds / Baths | Price | Details |
|---|---|---|---|---|---|

|
#1
Iriquois Dr
Ashburnham, MA 01430
|
2,016 sq. feet
|
2 baths 3 beds |
$369,000
|
show details |

|
#2
Old Sharon Rd
Peterborough, NH 03458
|
- sq. feet
|
- baths - beds |
show details | |

|
#3
Glen Dr
Peterborough, NH 03458
|
- sq. feet
|
- baths - beds |
show details | |

|
#4
Nashua St
Milford, NH 03055
|
2,172 sq. feet
|
2 baths 4 beds |
show details | |

|
#5
Rindge State Rd
Ashburnham, MA 01430
|
1,260 sq. feet
|
1 baths 3 beds |
show details | |

|
#6
Lakeshore Dr
Ashburnham, MA 01430
|
- sq. feet
|
- baths - beds |
$5,000
|
show details |

|
#7
Mill St
Greenville, NH 03048
|
1,201 sq. feet
|
1 baths 2 beds |
show details | |

|
#8
W Hill Rd
Troy, NH 03465
|
1,664 sq. feet
|
2 baths 3 beds |
show details | |

|
#9
Amherst St
Amherst, NH 03031
|
- sq. feet
|
4 baths 3 beds |
show details | |

|
#10
Turnpike Rd
Ashby, MA 01431
|
960 sq. feet
|
1 baths 2 beds |
show details |
| Photo | Address | Area | Beds / Baths | Price | Details |
|---|---|---|---|---|---|

|
#11
Marlboro Rd
Keene, NH 03431
|
908 sq. feet
|
1 baths 3 beds |
show details | |

|
#12
Noel Dr
Ashburnham, MA 01430
|
960 sq. feet
|
1 baths 3 beds |
show details | |

|
#13
Maple St
Winchendon, MA 01475
|
903 sq. feet
|
1 baths 2 beds |
show details | |

|
#14
Courthouse Rd
Amherst, NH 03031
|
1,391 sq. feet
|
1 baths 3 beds |
show details | |

|
#15
West St
Winchendon, MA 01475
|
1,584 sq. feet
|
1 baths 3 beds |
show details | |

|
#16
School St
Winchendon, MA 01475
|
1,518 sq. feet
|
1 baths 3 beds |
show details | |

|
#17
Juniper St
Winchendon, MA 01475
|
1,687 sq. feet
|
1 baths 4 beds |
show details | |

|
#18
Cushing St
Ashburnham, MA 01430
|
1,445 sq. feet
|
1 baths 3 beds |
show details | |

|
#19
Ridgefield Dr
Milford, NH 03055
|
1,357 sq. feet
|
1 baths 3 beds |
show details | |

|
#20
South Rd
Swanzey, NH 03446
|
3,841 sq. feet
|
3 baths 3 beds |
show details |
| Photo | Address | Area | Beds / Baths | Price | Details |
|---|---|---|---|---|---|

|
#21
Cypress Rd
Milford, NH 03055
|
1,929 sq. feet
|
1 baths 3 beds |
show details | |

|
#22
Hale Hill Rd
Swanzey, NH 03446
|
2,976 sq. feet
|
2 baths 3 beds |
show details | |

|
#23
Hill St
Winchendon, MA 01475
|
1,549 sq. feet
|
1 baths 3 beds |
show details | |

|
#24
Royalston Rd S
Winchendon, MA 01475
|
1,188 sq. feet
|
2 baths 3 beds |
show details | |

|
#25
Converse Dr
Winchendon, MA 01475
|
2,108 sq. feet
|
1 baths 3 beds |
show details | |

|
#26
Ash St
Winchendon, MA 01475
|
960 sq. feet
|
1 baths 2 beds |
show details | |

|
#27
Teel Rd
Winchendon, MA 01475
|
1,080 sq. feet
|
1 baths 3 beds |
show details | |

|
#28
Sibley Rd
Winchendon, MA 01475
|
1,728 sq. feet
|
2 baths 3 beds |
show details | |

|
#29
Converse Dr
Winchendon, MA 01475
|
2,120 sq. feet
|
3 baths 3 beds |
show details | |

|
#30
Spruce St
Winchendon, MA 01475
|
1,504 sq. feet
|
1 baths 3 beds |
show details |
| Photo | Address | Area | Beds / Baths | Price | Details |
|---|---|---|---|---|---|

|
#31
Maple St
Winchendon, MA 01475
|
1,000 sq. feet
|
1 baths 2 beds |
show details | |

|
#32
W Hill Rd
Troy, NH 03465
|
1,664 sq. feet
|
2 baths 3 beds |
show details | |

|
#33
Old New Ipswich Rd
Rindge, NH 03461
|
1,184 sq. feet
|
2 baths 3 beds |
show details | |

|
#34
Fitzgerald Rd
Rindge, NH 03461
|
3,960 sq. feet
|
3 baths 4 beds |
show details | |

|
#35
Malderelli Rd
Greenville, NH 03048
|
1,098 sq. feet
|
1 baths 3 beds |
show details | |

|
#36
Russell Ave
Troy, NH 03465
|
2,477 sq. feet
|
1 baths 3 beds |
show details | |

|
#37
Birch Dr
Rindge, NH 03461
|
1,971 sq. feet
|
2 baths 4 beds |
show details | |

|
#38
South St
Troy, NH 03465
|
1,476 sq. feet
|
1 baths 3 beds |
show details | |

|
#39
Lord Brook Rd
Rindge, NH 03461
|
1,920 sq. feet
|
1 baths 3 beds |
show details | |

|
#40
Taggart Cir
Rindge, NH 03461
|
1,488 sq. feet
|
1 baths 3 beds |
show details |
| Photo | Address | Area | Beds / Baths | Price | Details |
|---|---|---|---|---|---|

|
#41
Mill St
New Boston, NH 03070
|
- sq. feet
|
3 baths 4 beds |
show details | |

|
#42
Washington St
Keene, NH 03431
|
- sq. feet
|
1 baths 3 beds |
show details | |

|
#43
Washington St
Keene, NH 03431
|
- sq. feet
|
1 baths 3 beds |
show details | |

|
#44
Francestown Rd
Bennington, NH 03442
|
- sq. feet
|
1 baths 2 beds |
show details | |

|
#45
Dale St
Wilton, NH 03086
|
- sq. feet
|
2 baths 3 beds |
show details | |

|
#46
Howard St # 2
Keene, NH 03431
|
- sq. feet
|
2 baths 3 beds |
show details | |

|
#47
Curtis Farm Rd
Wilton, NH 03086
|
- sq. feet
|
1 baths 3 beds |
show details | |

|
#48
Ash St
Winchendon, MA 01475
|
- sq. feet
|
- baths - beds |
show details | |

|
#49
Ashby Rd
Ashburnham, MA 01430
|
- sq. feet
|
- baths - beds |
show details | |

|
Check over 1 million property listings on Foreclosure.com!
|
browse all offers | |||

Latest news about housing in Peterborough, NH collected exclusively by city-data.com from local newspapers, TV, and radio stations

 | Online Thieves Steal $2.3 Million from Peterborough (35 replies) |
| Moving to Peterborough..from Kauai (42 replies) |
| Tiny house living - legally difficult in New Hampshire (12 replies) |
| Searching for area with unique homes. (24 replies) |
| Apartments in Peterborough (2 replies) |
| trouble finding house rentals in New Boston area? (2 replies) |
Median year apartment built: 1955
Household type by relationship:
Households: 2,267- Male householders: 544 (238 living alone), Female householders: 745 (346 living alone)
566 spouses (538 opposite-sex spouses), 67 unmarried partners, (67 opposite-sex unmarried partners), 186 children (175 natural, 11 adopted, 0 stepchildren), 0 grandchildren, 0 brothers or sisters, 0 parents, 0 foster children, 16 other relatives, 36 non-relatives
- In group quarters: 103
Size of family households: 552 2-persons, 74 3-persons, 12 7-or-more-persons.
Size of nonfamily households: 563 1-person, 70 2-persons.
33 married couples with children.
48 single-parent households (20 men, 28 women).
98.2% of residents of Peterborough speak English at home.
2.1% of residents speak Spanish at home (100% speak English very well).
0.2% of residents speak other Indo-European language at home (100% speak English not well).
1.5% of residents speak Asian or Pacific Island language at home (59% speak English very well, 41% speak English well).
Foreign born population: 127 (5.6%)
(92.1% of them are naturalized citizens)
| Here: | 6.7 |
| State: | 6.4 |
| Here: | 4.4 |
| State: | 4.0 |
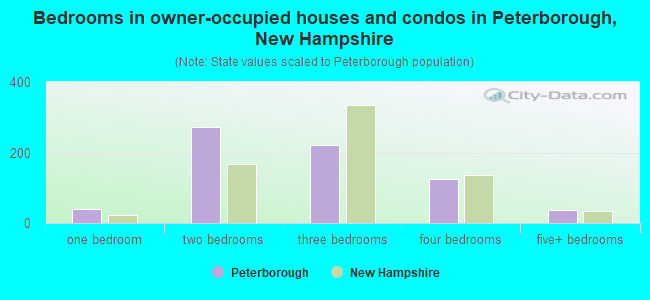
- Bedrooms in owner-occupied houses and condos in Peterborough, New Hampshire
- 0no bedroom
- 411 bedroom
- 2732 bedrooms
- 2203 bedrooms
- 1244 bedrooms
- 385+ bedrooms
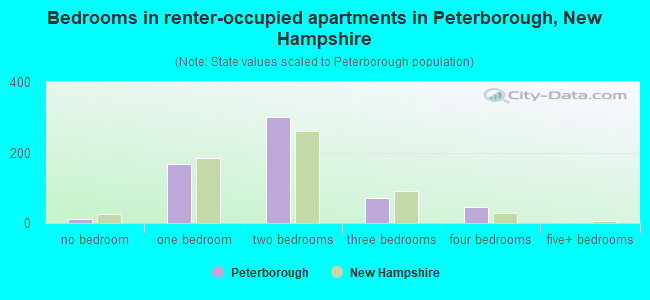
- Bedrooms in renter-occupied apartments in Peterborough, New Hampshire
- 11no bedroom
- 1661 bedroom
- 3012 bedrooms
- 713 bedrooms
- 444 bedrooms
- 05+ bedrooms
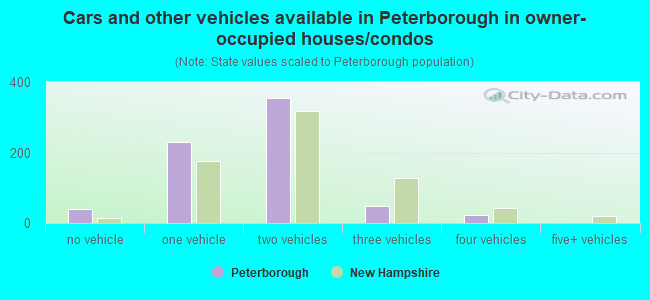
- Cars and other vehicles available in Peterborough in owner-occupied houses/condos
- 41no vehicle
- 2301 vehicle
- 3562 vehicles
- 473 vehicles
- 224 vehicles
- 05+ vehicles
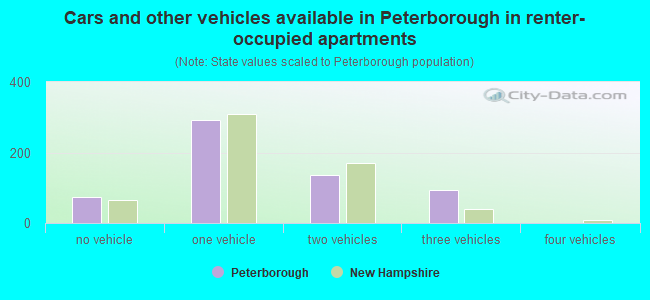
- Cars and other vehicles available in Peterborough in renter-occupied apartments
- 73no vehicle
- 2921 vehicle
- 1352 vehicles
- 943 vehicles
- 04 vehicles
- 05+ vehicles
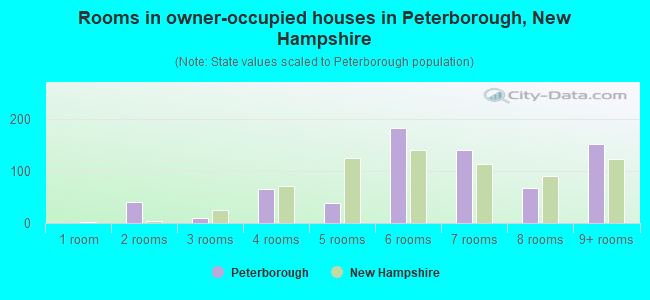
- Rooms in owner-occupied houses in Peterborough, New Hampshire
- 01 room
- 412 rooms
- 103 rooms
- 654 rooms
- 385 rooms
- 1826 rooms
- 1407 rooms
- 688 rooms
- 1539+ rooms
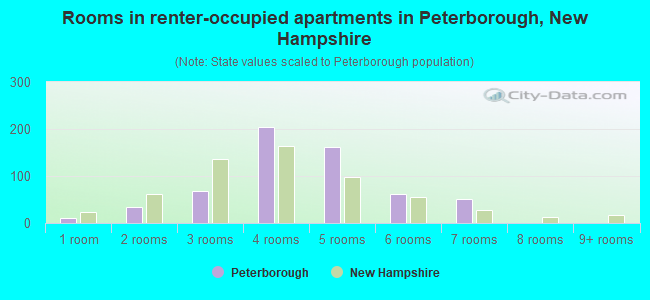
- Rooms in renter-occupied apartments in Peterborough, New Hampshire
- 111 room
- 342 rooms
- 683 rooms
- 2054 rooms
- 1625 rooms
- 616 rooms
- 527 rooms
- 08 rooms
- 09+ rooms
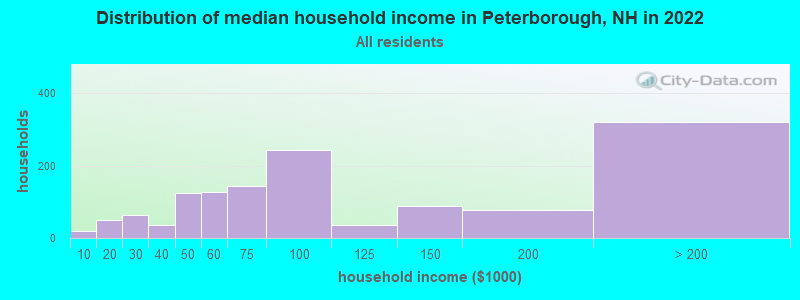
Peterborough, NH household income distribution

- 18Less than $10,000
- 49$10,000 to $19,999
- 64$20,000 to $29,999
- 35$30,000 to $39,999
- 125$40,000 to $49,999
- 128$50,000 to $59,999
- 143$60,000 to $74,999
- 242$75,000 to $99,999
- 35$100,000 to $124,999
- 87$125,000 to $149,999
- 76$150,000 to $199,999
- 320$200,000 or more
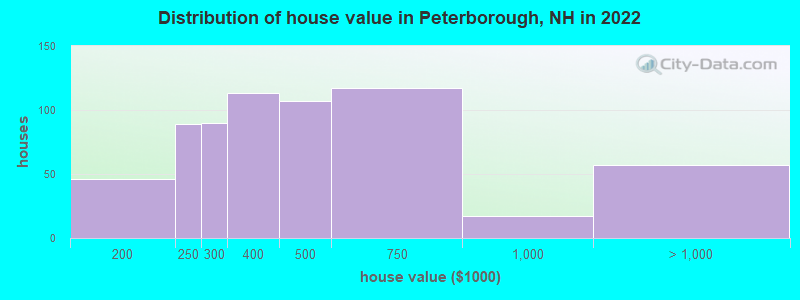
Home value of owner - occupied houses in 2022 in Peterborough, NH
-
- 24$150,000 to $174,999
- 21$175,000 to $199,999
- 88$200,000 to $249,999
- 89$250,000 to $299,999
- 113$300,000 to $399,999
- 107$400,000 to $499,999
- 117$500,000 to $749,999
- 17$750,000 to $999,999
- 56$2,000,000 or more
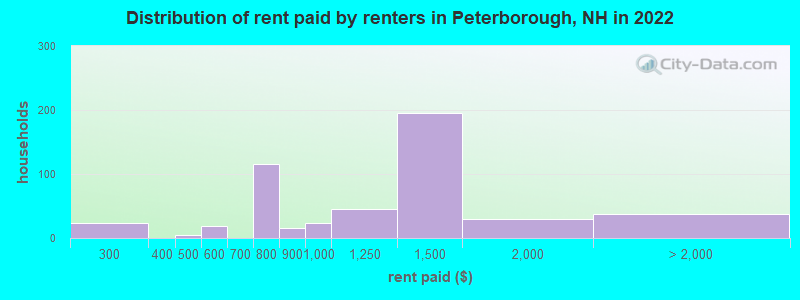
Rent paid by renters in 2022 in Peterborough, NH
-
- 24$200 to $249
- 4$400 to $449
- 19$550 to $599
- 115$750 to $799
- 16$800 to $899
- 22$900 to $999
- 44$1,000 to $1,249
- 195$1,250 to $1,499
- 28$1,500 to $1,999
- 24$3,500 or more
- 14No cash rent
Percentage of workers working in this county: 81.1%
Number of people working at home: 188 (14.1% of all workers)
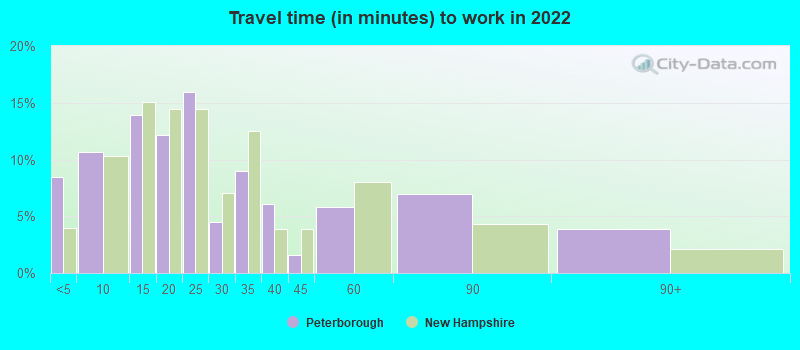
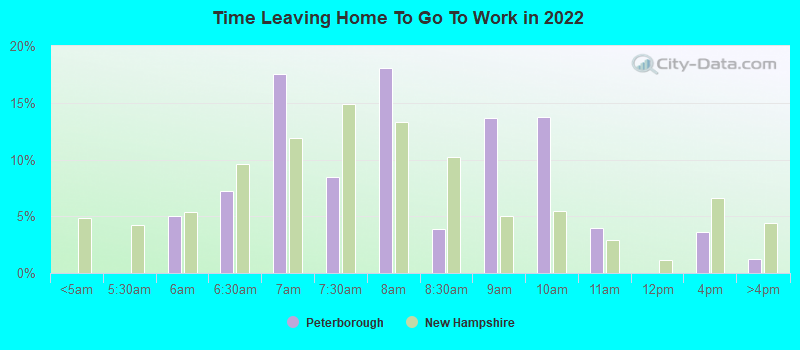
Travel time to work (commute)
- Less than 5 minutes: 54
- 5 to 9 minutes: 205
- 10 to 14 minutes: 131
- 15 to 19 minutes: 136
- 20 to 24 minutes: 238
- 25 to 29 minutes: 13
- 30 to 34 minutes: 67
- 35 to 39 minutes: 34
- 40 to 44 minutes: 37
- 45 to 59 minutes: 93
- 60 to 89 minutes: 71
- 90 or more minutes: 47
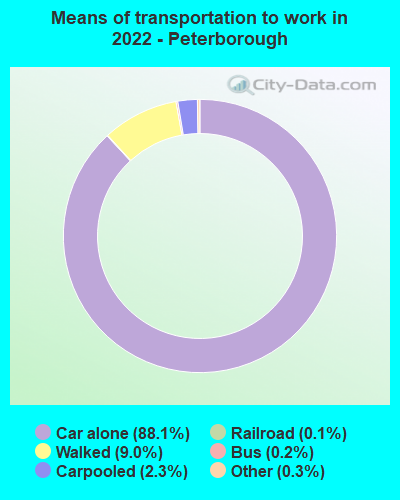
Means of transportation to work:
- Drove a car alone: 2,098 (77.1%)
- Carpooled: 69 (2.5%)
- Bus: 2 (0.1%)
- Light rail, streetcar or trolley: 5 (0.2%)
- Taxi: 8 (0.3%)
- Walked: 224 (8.2%)
- Worked at home: 188 (6.9%)
- Unemployment by race in 2022
- Unemployment rate for White non-Hispanic residents
- 3.8%Females
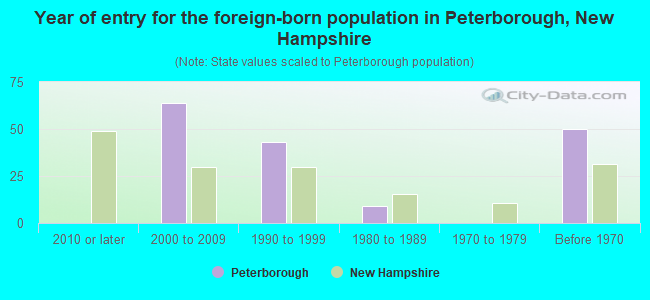
- Year of entry for the foreign-born population in Peterborough, New Hampshire
- 02010 or later
- 642000 to 2009
- 431990 to 1999
- 91980 to 1989
- 01970 to 1979
- 50Before 1970
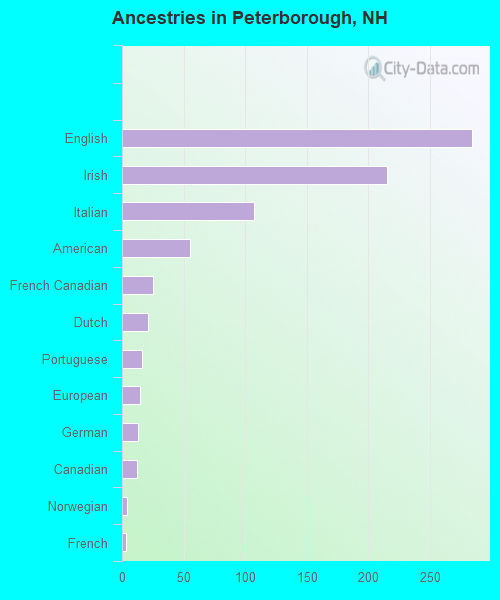
First ancestries reported:
- English: 284 (32.2%)
- Irish: 215 (24.4%)
- Italian: 107 (12.1%)
- American: 55 (6.2%)
- French Canadian: 25 (2.8%)
- Dutch: 21 (2.4%)
- Portuguese: 16 (1.8%)
- European: 15 (1.7%)
- German: 13 (1.5%)
- Canadian: 12 (1.4%)
- Norwegian: 4 (0.5%)
- French: 3 (0.3%)
Most common places of birth for foreign-born residents (%):
| Peterborough: | 41.7% (53) |
| New Hampshire: | 0.8% (686) |
| Peterborough: | 26.0% (33) |
| New Hampshire: | 1.4% (1,179) |
| Peterborough: | 13.4% (17) |
| New Hampshire: | 2.2% (1,838) |
| Peterborough: | 8.7% (11) |
| New Hampshire: | 1.9% (1,607) |
| Peterborough: | 8.7% (11) |
| New Hampshire: | 0.3% (244) |
Place of birth for U.S.-born residents:
- This state: 643
- Other state: 1,456
- Northeast: 1,007
- Midwest: 115
- South: 140
- West: 186
93.3% of Peterborough residents lived in the same house 1 years ago.
Out of people who lived in different houses, 38.1% lived in this county.
Out of people who lived in different counties, 0.0% lived in New Hampshire.
| Peterborough: | 93.3% |
| State average: | 89.8% |
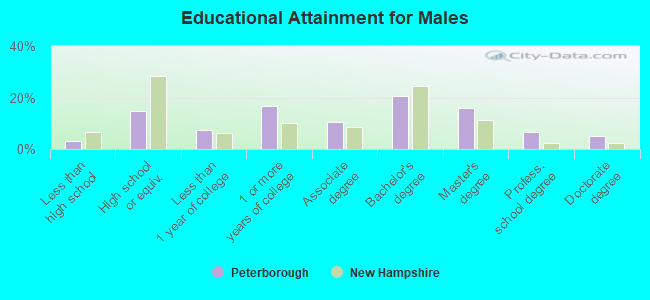
Education attainment for males 25 years and older:
- No schooling: 0
- Nursery to 4th grade: 0
- 5th and 6th grade: 0
- 7th and 8th grade: 19
- 9th grade: 0
- 10th grade: 0
- 11th grade: 0
- 12th grade, no diploma: 11
- High school graduate (or equivalency): 144
- Less than 1 year of college: 72
- Some college more than 1 year, no degree: 162
- Associate degree: 103
- Bachelor's degree: 202
- Master's degree: 157
- Professional school degree: 63
- Doctorate degree: 48
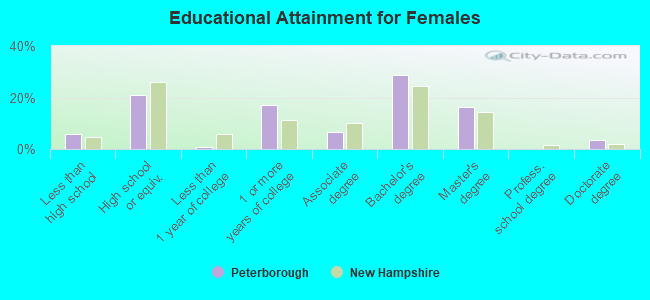
Education attainment for females 25 years and older:
- No schooling: 0
- Nursery to 4th grade: 0
- 5th and 6th grade: 0
- 7th and 8th grade: 0
- 9th grade: 4
- 10th grade: 0
- 11th grade: 61
- 12th grade, no diploma: 0
- High school graduate (or equivalency): 239
- Less than 1 year of college: 9
- Some college more than 1 year, no degree: 197
- Associate degree: 77
- Bachelor's degree: 327
- Master's degree: 188
- Professional school degree: 0
- Doctorate degree: 38
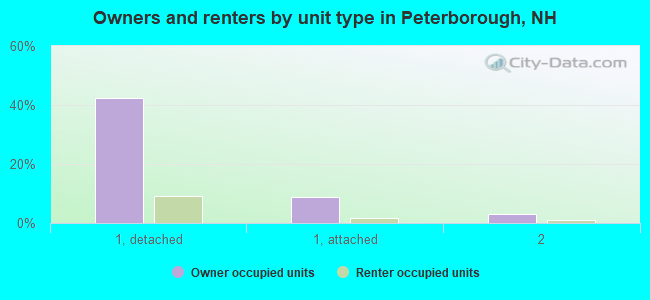
Housing units in structures:
- One, detached: 732
- One, attached: 117
- Two: 236
- 3 or 4: 119
- 5 to 9: 253
- 10 to 19: 20
- 20 to 49: 73
- 50 or more: 64
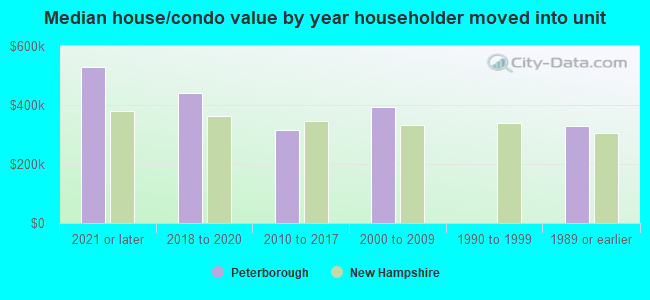
House/condo owner moved in on average 11 years ago
Renter moved in on average 2 years ago

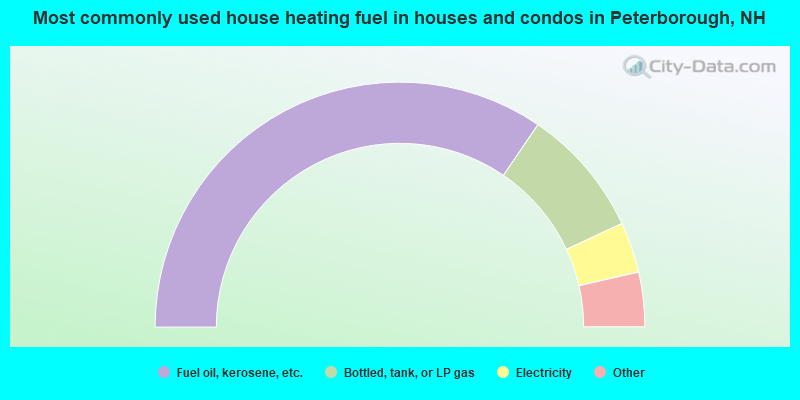
- 69.2%Fuel oil, kerosene, etc.
- 17.1%Bottled, tank, or LP gas
- 6.7%Electricity
- 3.8%Other fuel
- 3.3%Wood
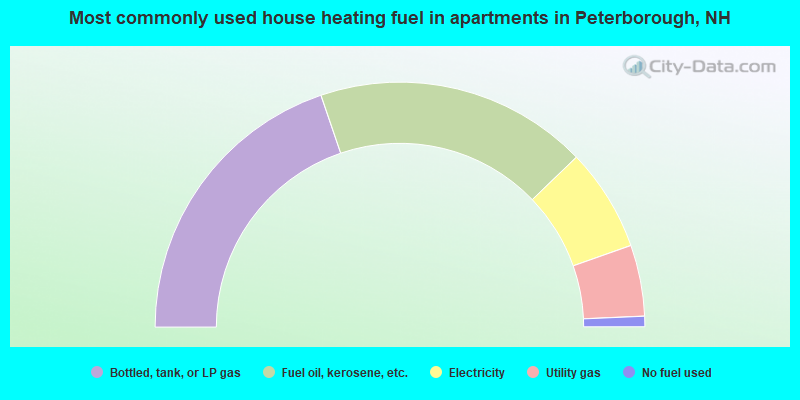
- 39.6%Bottled, tank, or LP gas
- 36.1%Fuel oil, kerosene, etc.
- 13.6%Electricity
- 9.4%Utility gas
- 1.4%No fuel used
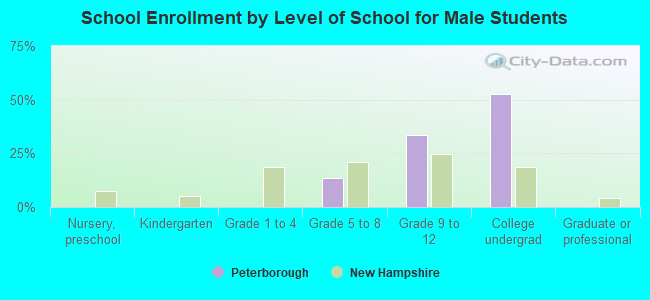
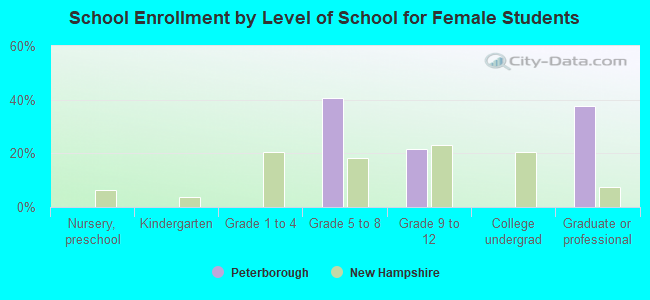
Private vs. public school enrollment:
| Here: | 37.8% |
| New Hampshire: | 11.4% |
| Here: | 0.0% |
| New Hampshire: | 14.0% |
| Here: | 100.0% |
| New Hampshire: | 38.0% |