Philema, GA (Georgia) Houses and Residents
| Philema: | $228,259 |
| Georgia: | $297,400 |
Total population: 8,620 (Urban population: 1,456, Rural population: 5,039 (81 farm, 4,958 nonfarm))
Houses: 2,351 (2,200 occupied: 1,854 owner occupied, 346 renter occupied)
| % of renters here: | 16% |
| State: | 34% |
Housing density: 17 houses/condos per square mile
Median price asked for vacant for-sale houses and condos in 2022 in this county: $134,803.
Median contract rent in 2022: $1,065 (lower quartile is $795, upper quartile is $1,393)
Median rent asked for vacant for-rent units in 2022: $796
Median gross rent in Philema, GA in 2022: $1,336
Housing units in Philema with a mortgage: 1,089 (130 second mortgage, 174 home equity loan, 0 both second mortgage and home equity loan)
Houses without a mortgage: 126


Household type by relationship:
Households: 27,470- In family households: 25,008 (5,477 male householders, 2,263 female householders)
6,025 spouses, 9,259 children (8,382 natural, 180 adopted, 697 stepchildren), 686 grandchildren, 187 brothers or sisters, 234 parents, foster children, 258 other relatives, 469 non-relatives
- In nonfamily households: 2,462 (935 male householders (700 living alone)), 1,031 female householders (890 living alone)), 496 nonrelatives
- In group quarters: 828 (760 institutionalized population)
5,457 married couples with children.
1,528 single-parent households (273 men, 1,255 women).
96.9% of residents of Philema speak English at home.
1.8% of residents speak Spanish at home (80% speak English very well, 20% speak English well).
1.2% of residents speak other Indo-European language at home (47% speak English very well, 11% speak English well, 42% speak English not well).
0.1% of residents speak Asian or Pacific Island language at home (100% speak English very well).
Foreign born population: 213 (2.6%)
(101.9% of them are naturalized citizens)
| Here: | 6.3 |
| State: | 6.8 |
| Here: | 6.2 |
| State: | 4.6 |

- Bedrooms in owner-occupied houses and condos in Philema, Georgia
- 0no bedroom
- 341 bedroom
- 2132 bedrooms
- 1,3113 bedrooms
- 2444 bedrooms
- 525+ bedrooms

- Bedrooms in renter-occupied apartments in Philema, Georgia
- 0no bedroom
- 111 bedroom
- 652 bedrooms
- 2193 bedrooms
- 514 bedrooms
- 05+ bedrooms

- Cars and other vehicles available in Philema in owner-occupied houses/condos
- 31no vehicle
- 3771 vehicle
- 9422 vehicles
- 4123 vehicles
- 924 vehicles
- 05+ vehicles

- Cars and other vehicles available in Philema in renter-occupied apartments
- 29no vehicle
- 1301 vehicle
- 1302 vehicles
- 473 vehicles
- 104 vehicles
- 05+ vehicles

- Rooms in owner-occupied houses in Philema, Georgia
- 01 room
- 02 rooms
- 743 rooms
- 1274 rooms
- 5625 rooms
- 5636 rooms
- 2837 rooms
- 1068 rooms
- 1399+ rooms

- Rooms in renter-occupied apartments in Philema, Georgia
- 01 room
- 02 rooms
- 233 rooms
- 444 rooms
- 1435 rooms
- 746 rooms
- 477 rooms
- 88 rooms
- 79+ rooms


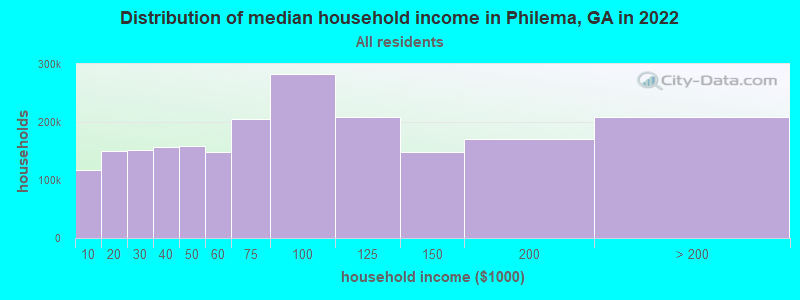
Philema, GA household income distribution

- 87,963Less than $10,000
- 123,420$10,000 to $19,999
- 122,167$20,000 to $29,999
- 124,318$30,000 to $39,999
- 124,377$40,000 to $49,999
- 116,783$50,000 to $59,999
- 158,428$60,000 to $74,999
- 222,600$75,000 to $99,999
- 161,572$100,000 to $124,999
- 114,349$125,000 to $149,999
- 127,827$150,000 to $199,999
- 141,725$200,000 or more
Percentage of workers working in this county: 16.3%
Number of people working at home: 482 (12.2% of all workers)
Travel time to work (commute)
- Less than 5 minutes: 20
- 5 to 9 minutes: 71
- 10 to 14 minutes: 375
- 15 to 19 minutes: 980
- 20 to 24 minutes: 856
- 25 to 29 minutes: 125
- 30 to 34 minutes: 383
- 35 to 39 minutes: 55
- 40 to 44 minutes: 25
- 45 to 59 minutes: 112
- 60 to 89 minutes: 46
- 90 or more minutes: 99
Means of transportation to work:
- Drove a car alone: 2,798 (87.8%)
- Carpooled: 327 (10.3%)
- Bus or trolley bus: 8 (0.3%)
- Walked: 14 (0.4%)
- Worked at home: 39 (1.2%)


- Year of entry for the foreign-born population in Philema, Georgia
- 421995 to March 2000
- 91990 to 1994
- 01985 to 1989
- 191980 to 1984
- 71975 to 1979
- 01970 to 1974
- 191965 to 1969
- 5Before 1965
Most common places of birth for foreign-born residents (%):
| Philema: | 29.7% (30) |
| Georgia: | 1.0% (6,009) |
| Philema: | 20.8% (21) |
| Georgia: | 4.8% (27,834) |
| Philema: | 18.8% (19) |
| Georgia: | 1.5% (8,832) |
| Philema: | 11.9% (12) |
| Georgia: | 1.2% (6,750) |
| Philema: | 11.9% (12) |
| Georgia: | 0.7% (4,132) |
| Philema: | 6.9% (7) |
| Georgia: | 0.7% (4,103) |
Place of birth for U.S.-born residents:
- This state: 4,516
- Other state: 1,798
- Northeast: 156
- Midwest: 361
- South: 1,159
- West: 122
57% of Philema residents lived in the same house 5 years ago.
Out of people who lived in different houses, 37% lived in this county.
Out of people who lived in different counties, 68% lived in Georgia.
Education attainment for males 25 years and older:
- No schooling: 0
- Nursery to 4th grade: 17
- 5th and 6th grade: 18
- 7th and 8th grade: 46
- 9th grade: 36
- 10th grade: 116
- 11th grade: 60
- 12th grade, no diploma: 54
- High school graduate (or equivalency): 777
- Less than 1 year of college: 215
- Some college more than 1 year, no degree: 275
- Associate degree: 85
- Bachelor's degree: 164
- Master's degree: 19
- Professional school degree: 27
- Doctorate degree: 25

Education attainment for females 25 years and older:
- No schooling: 8
- Nursery to 4th grade: 0
- 5th and 6th grade: 10
- 7th and 8th grade: 68
- 9th grade: 22
- 10th grade: 158
- 11th grade: 91
- 12th grade, no diploma: 64
- High school graduate (or equivalency): 866
- Less than 1 year of college: 133
- Some college more than 1 year, no degree: 285
- Associate degree: 158
- Bachelor's degree: 147
- Master's degree: 59
- Professional school degree: 7
- Doctorate degree: 0

Housing units in structures:
- One, detached: 1,523
- One, attached: 14
- Two: 176
- 3 or 4: 49
- Mobile homes: 589
Median worth of mobile homes: $81,892

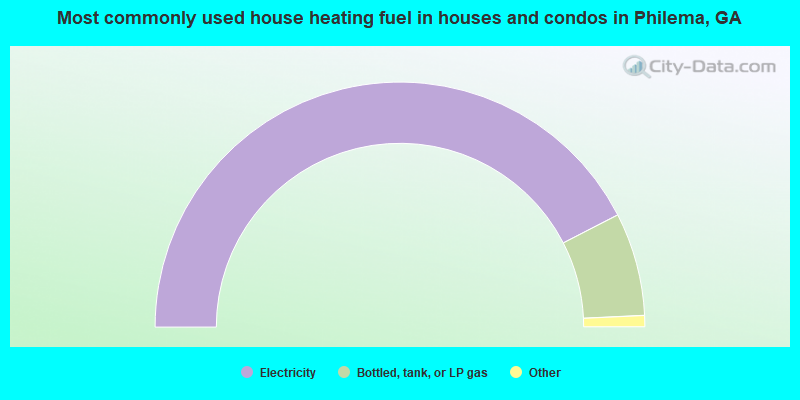
- 84.8%Electricity
- 13.6%Bottled, tank, or LP gas
- 1.0%Utility gas
- 0.5%No fuel used
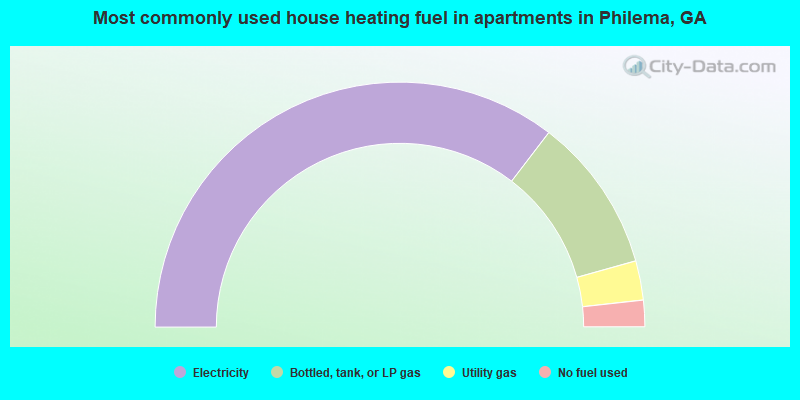
- 70.8%Electricity
- 20.5%Bottled, tank, or LP gas
- 5.2%Utility gas
- 3.5%No fuel used
Private vs. public school enrollment:
| Here: | 7.2% |
| Georgia: | 8.4% |
| Here: | 24.2% |
| Georgia: | 8.5% |
| Here: | 6.4% |
| Georgia: | 22.9% |


