Pikeville, KY (Kentucky) Houses and Residents
| Pikeville: | $300,439 |
| Kentucky: | $196,300 |
Mean price in 2022:
Detached houses: $428,823
Here: $428,823 State: $256,452 Townhouses or other attached units: $392,477
Here: $392,477 State: $264,090 In 5-or-more-unit structures: $182,125
Here: $182,125 State: $245,174 Mobile homes: $84,639
Here: $84,639 State: $84,635
Total population: 7,327 (Urban population: 4,649 (all inside urban clusters), Rural population: 1,579 (all nonfarm))
Houses: 3,450 (3,115 occupied: 1,254 owner occupied, 1,926 renter occupied)
| % of renters here: | 61% |
| State: | 31% |
Housing density: 224 houses/condos per square mile
Median price asked for vacant for-sale houses and condos in 2022: $195,666.
Median contract rent in 2022: $677 (lower quartile is $403, upper quartile is $856)
Median rent asked for vacant for-rent units in 2022: $1,000
Median gross rent in Pikeville, KY in 2022: $821
Housing units in Pikeville with a mortgage: 729 (23 second mortgage, 0 home equity loan, 24 both second mortgage and home equity loan)
Houses without a mortgage: 24
Median household income for houses/condos with a mortgage: $97,269
Median household income for apartments without a mortgage: $42,456
Median monthly housing costs: $851
Compare current foreclosures in Pikeville, KY:
| Photo | Address | Area | Beds / Baths | Price | Details |
|---|---|---|---|---|---|

|
#1
Red Creek Rd
Pikeville, KY 41501
|
948 sq. feet
|
1 baths 3 beds |
$25,900
|
show details |

|
#2
Rocky Rd
Pikeville, KY 41501
|
2,136 sq. feet
|
2 baths 3 beds |
show details | |

|
#3
Lakeview Cir
Pikeville, KY 41501
|
2,430 sq. feet
|
4 baths 4 beds |
show details | |

|
#4
Jennys Frk
Pikeville, KY 41501
|
2,052 sq. feet
|
2 baths 3 beds |
show details | |

|
#5
Rosiland St
Pikeville, KY 41501
|
1,782 sq. feet
|
2 baths 3 beds |
show details | |

|
#6
Lick Frk
Pikeville, KY 41501
|
1,296 sq. feet
|
2 baths 3 beds |
show details | |

|
#7
Caney Newsome Br
Pikeville, KY 41501
|
1,294 sq. feet
|
2 baths 2 beds |
show details | |

|
#8
6th St
Pikeville, KY 41501
|
1,508 sq. feet
|
5 baths 6 beds |
show details | |

|
#9
Clevinger Br
Pikeville, KY 41501
|
1,092 sq. feet
|
1 baths 3 beds |
show details | |

|
#10
N Douglas Ct
Pikeville, KY 41501
|
2,216 sq. feet
|
2 baths 3 beds |
show details |
| Photo | Address | Area | Beds / Baths | Price | Details |
|---|---|---|---|---|---|

|
#11
Mullins Addition Dr
Pikeville, KY 41501
|
2,100 sq. feet
|
3 baths 4 beds |
show details | |

|
#12
Powells Crk
Pikeville, KY 41501
|
1,392 sq. feet
|
1 baths 3 beds |
show details | |

|
#13
Cowpen Rd
Pikeville, KY 41501
|
- sq. feet
|
- baths - beds |
show details | |

|
#14
Broadbottom Rd
Pikeville, KY 41501
|
- sq. feet
|
- baths - beds |
show details | |

|
#15
Ky Highway 611
Pikeville, KY 41501
|
2,115 sq. feet
|
- baths - beds |
show details | |

|
#16
Justice Ln
Pikeville, KY 41501
|
- sq. feet
|
- baths - beds |
show details | |

|
#17
Bruce Elliott Dr
Pikeville, KY 41501
|
- sq. feet
|
- baths - beds |
show details | |

|
#18
Harrison Newsome Br
Pikeville, KY 41501
|
- sq. feet
|
- baths - beds |
show details | |

|
#19
Coal Hollow Road
Pikeville, KY 41501
|
- sq. feet
|
- baths - beds |
show details | |

|
#20
Rolling Hills Est
Pikeville, KY 41501
|
- sq. feet
|
- baths - beds |
show details |
| Photo | Address | Area | Beds / Baths | Price | Details |
|---|---|---|---|---|---|

|
#21
Broadbottom Rd
Pikeville, KY 41501
|
- sq. feet
|
- baths - beds |
show details | |

|
#22
Red Creek Rd
Pikeville, KY 41501
|
- sq. feet
|
- baths - beds |
show details | |

|
#23
Flora St
Pikeville, KY 41501
|
- sq. feet
|
- baths - beds |
show details | |

|
#24
Frogtown Rd
Pikeville, KY 41501
|
- sq. feet
|
- baths - beds |
show details | |

|
#25
Us Highway 23 S
Pikeville, KY 41501
|
- sq. feet
|
- baths - beds |
show details | |

|
#26
Burning Fork Rd
Pikeville, KY 41501
|
- sq. feet
|
- baths - beds |
show details | |

|
#27
Church St
Pikeville, KY 41501
|
- sq. feet
|
- baths - beds |
show details | |

|
#28
Ridge Pt
Pikeville, KY 41501
|
- sq. feet
|
- baths - beds |
show details | |

|
#29
Cumberland Ct
Pikeville, KY 41501
|
2,070 sq. feet
|
- baths - beds |
show details | |

|
#30
Carter Dr
Pikeville, KY 41501
|
- sq. feet
|
- baths - beds |
show details |
| Photo | Address | Area | Beds / Baths | Price | Details |
|---|---|---|---|---|---|

|
#31
Haynes Village Pl
Pikeville, KY 41501
|
- sq. feet
|
- baths - beds |
show details | |

|
#32
Douglas Pkwy Apt 2c
Pikeville, KY 41501
|
- sq. feet
|
- baths - beds |
show details | |

|
#33
Rocky Loop
Pikeville, KY 41501
|
- sq. feet
|
- baths - beds |
show details | |

|
#34
Little Crk
Pikeville, KY 41501
|
- sq. feet
|
- baths - beds |
show details | |

|
#35
S Bridge St
Pikeville, KY 41501
|
- sq. feet
|
- baths - beds |
show details | |

|
#36
Powells Crk
Pikeville, KY 41501
|
- sq. feet
|
- baths - beds |
show details | |

|
#37
Buckfield Rd
Pikeville, KY 41501
|
- sq. feet
|
- baths - beds |
show details | |

|
#38
Upper Chloe Crk
Pikeville, KY 41501
|
- sq. feet
|
- baths - beds |
show details | |

|
#39
Us Highway 23 S
Pikeville, KY 41501
|
- sq. feet
|
- baths - beds |
show details | |

|
#40
Caney Dr
Pikeville, KY 41501
|
- sq. feet
|
- baths - beds |
show details |
| Photo | Address | Area | Beds / Baths | Price | Details |
|---|---|---|---|---|---|

|
Check over 1 million property listings on Foreclosure.com!
|
browse all offers | |||
| Photo | Address | Area | Beds / Baths | Price | Details |
|---|

Latest news about housing in Pikeville, KY collected exclusively by city-data.com from local newspapers, TV, and radio stations


Median year apartment built: 1983
Household type by relationship:
Households: 7,578- Male householders: 1,486 (450 living alone), Female householders: 1,598 (614 living alone)
1,211 spouses (1,211 opposite-sex spouses), 173 unmarried partners, (173 opposite-sex unmarried partners), 1,505 children (1,415 natural, 21 adopted, 68 stepchildren), 165 grandchildren, 90 brothers or sisters, 200 parents, 0 foster children, 162 other relatives, 140 non-relatives
- In group quarters: 845
Size of family households: 1,143 2-persons, 339 3-persons, 214 4-persons, 189 5-persons, 15 6-persons, 4 7-or-more-persons.
Size of nonfamily households: 1,123 1-person, 152 2-persons, 8 3-persons.
774 married couples with children.
196 single-parent households (52 men, 144 women).
96.7% of residents of Pikeville speak English at home.
0.4% of residents speak Spanish at home (100% speak English very well).
0.4% of residents speak other Indo-European language at home (75% speak English very well, 25% speak English well).
1.4% of residents speak Asian or Pacific Island language at home (70% speak English very well, 30% speak English well).
1.2% of residents speak other language at home (26% speak English very well, 39% speak English well, 35% speak English not well).
Foreign born population: 249 (3.3%)
(31.7% of them are naturalized citizens)
| Here: | 7.7 |
| State: | 6.4 |
| Here: | 3.8 |
| State: | 4.4 |
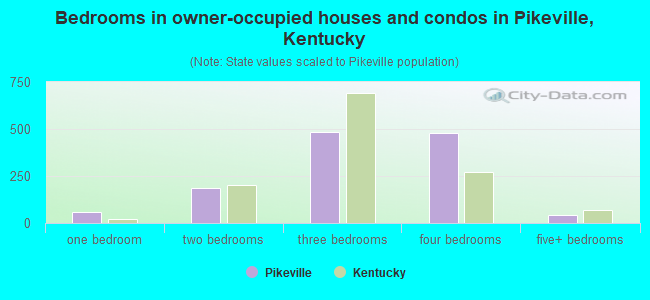
- Bedrooms in owner-occupied houses and condos in Pikeville, Kentucky
- 6no bedroom
- 561 bedroom
- 1872 bedrooms
- 4833 bedrooms
- 4784 bedrooms
- 455+ bedrooms

- Bedrooms in renter-occupied apartments in Pikeville, Kentucky
- 345no bedroom
- 4021 bedroom
- 8252 bedrooms
- 2783 bedrooms
- 504 bedrooms
- 275+ bedrooms

- Cars and other vehicles available in Pikeville in owner-occupied houses/condos
- 43no vehicle
- 2881 vehicle
- 6322 vehicles
- 1763 vehicles
- 1164 vehicles
- 05+ vehicles

- Cars and other vehicles available in Pikeville in renter-occupied apartments
- 466no vehicle
- 9081 vehicle
- 4602 vehicles
- 743 vehicles
- 194 vehicles
- 05+ vehicles

- Rooms in owner-occupied houses in Pikeville, Kentucky
- 61 room
- 02 rooms
- 783 rooms
- 684 rooms
- 1335 rooms
- 1066 rooms
- 1997 rooms
- 2088 rooms
- 4569+ rooms
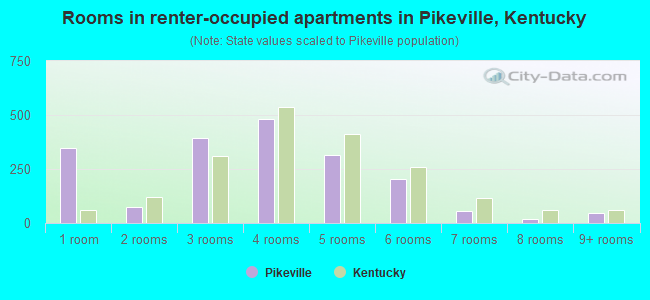
- Rooms in renter-occupied apartments in Pikeville, Kentucky
- 3451 room
- 742 rooms
- 3943 rooms
- 4814 rooms
- 3135 rooms
- 2026 rooms
- 567 rooms
- 178 rooms
- 459+ rooms


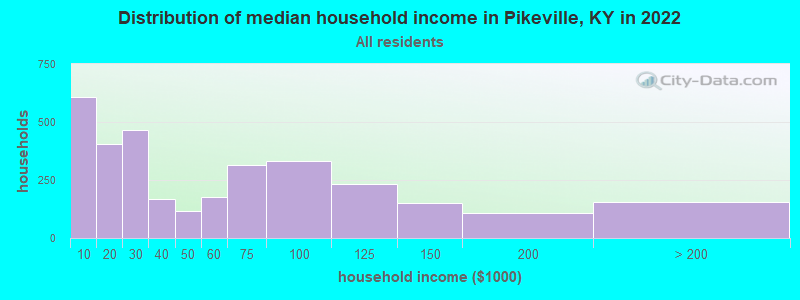
Pikeville, KY household income distribution

- 609Less than $10,000
- 404$10,000 to $19,999
- 466$20,000 to $29,999
- 169$30,000 to $39,999
- 117$40,000 to $49,999
- 178$50,000 to $59,999
- 314$60,000 to $74,999
- 333$75,000 to $99,999
- 232$100,000 to $124,999
- 150$125,000 to $149,999
- 108$150,000 to $199,999
- 157$200,000 or more
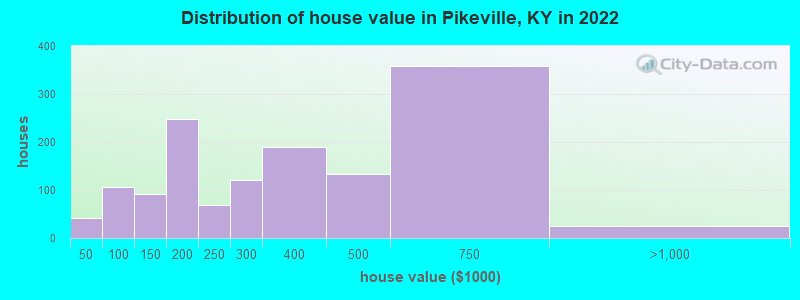
Home value of owner - occupied houses in 2022 in Pikeville, KY
-
- 41Less than $10,000
- 7$50,000 to $59,999
- 40$60,000 to $69,999
- 27$70,000 to $79,999
- 25$80,000 to $89,999
- 6$90,000 to $99,999
- 63$100,000 to $124,999
- 27$125,000 to $149,999
- 104$150,000 to $174,999
- 143$175,000 to $199,999
- 68$200,000 to $249,999
- 119$250,000 to $299,999
- 189$300,000 to $399,999
- 133$400,000 to $499,999
- 357$500,000 to $749,999
- 25$750,000 to $999,999
Rent paid by renters in 2022 in Pikeville, KY
-
- 54Less than $100
- 41$100 to $149
- 23$150 to $199
- 31$200 to $249
- 129$250 to $299
- 136$300 to $349
- 82$400 to $449
- 121$450 to $499
- 56$500 to $549
- 37$550 to $599
- 51$600 to $649
- 173$650 to $699
- 70$700 to $749
- 225$750 to $799
- 160$800 to $899
- 65$900 to $999
- 80$1,000 to $1,249
- 81$1,250 to $1,499
- 161$1,500 to $1,999
- 98No cash rent


Percentage of workers working in this county: 89.8%
Number of people working at home: 302 (10.5% of all workers)

Travel time to work (commute)
- Less than 5 minutes: 224
- 5 to 9 minutes: 956
- 10 to 14 minutes: 440
- 15 to 19 minutes: 322
- 20 to 24 minutes: 129
- 25 to 29 minutes: 109
- 30 to 34 minutes: 45
- 35 to 39 minutes: 115
- 40 to 44 minutes: 24
- 45 to 59 minutes: 110
- 60 to 89 minutes: 92
- 90 or more minutes: 0
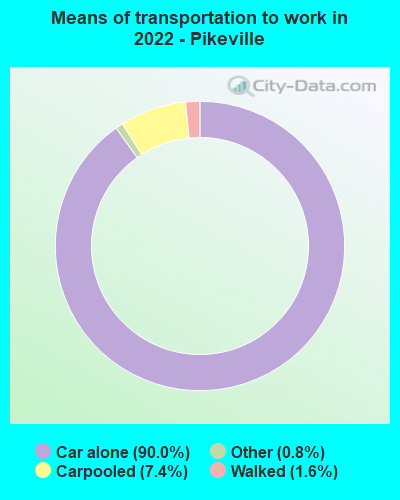
Means of transportation to work:
- Drove a car alone: 10,110 (85.1%)
- Carpooled: 922 (7.8%)
- Bus: 5 (0.0%)
- Taxi: 109 (0.9%)
- Walked: 184 (1.5%)
- Worked at home: 302 (2.5%)

- Unemployment by race in 2022
- Unemployment rate for White non-Hispanic residents
- 5.3%Males
- 1.2%Females
- Unemployment rate for Black residents
- 22.8%Males

- Year of entry for the foreign-born population in Pikeville, Kentucky
- 2352010 or later
- 142000 to 2009
- 81990 to 1999
- 161980 to 1989
- 241970 to 1979
- 11Before 1970

First ancestries reported:
- American: 1,133 (30.3%)
- Irish: 537 (14.4%)
- English: 533 (14.3%)
- German: 252 (6.7%)
- European: 113 (3.0%)
- Scotch-Irish: 63 (1.7%)
- Scottish: 53 (1.4%)
- Italian: 47 (1.3%)
- British: 40 (1.1%)
- Welsh: 28 (0.7%)
- Polish: 26 (0.7%)
- Danish: 20 (0.5%)
- Norwegian: 17 (0.5%)
- Dutch: 10 (0.3%)
- Swedish: 6 (0.2%)
- Jordanian: 5 (0.1%)
- Greek: 5 (0.1%)
- Northern European: 4 (0.1%)
- African: 2 (0.05%)
- Iranian: 1 (0.03%)
Most common places of birth for foreign-born residents (%):
| Pikeville: | 30.9% (80) |
| Kentucky: | 0.1% (181) |
| Pikeville: | 21.6% (56) |
| Kentucky: | 3.3% (6,109) |
| Pikeville: | 13.1% (34) |
| Kentucky: | 7.3% (13,454) |
| Pikeville: | 12.7% (33) |
| Kentucky: | 0.9% (1,743) |
| Pikeville: | 5.8% (15) |
| Kentucky: | 0.1% (167) |
| Pikeville: | 5.0% (13) |
| Kentucky: | 0.1% (206) |
| Pikeville: | 4.6% (12) |
| Kentucky: | 8.0% (14,652) |
| Pikeville: | 4.2% (11) |
| Kentucky: | 0.1% (246) |
| Pikeville: | 3.1% (8) |
| Kentucky: | 0.3% (531) |
Place of birth for U.S.-born residents:
- This state: 5,063
- Other state: 2,251
- Northeast: 192
- Midwest: 1,013
- South: 915
- West: 120
81.7% of Pikeville residents lived in the same house 1 years ago.
Out of people who lived in different houses, 28.2% lived in this county.
Out of people who lived in different counties, 34.6% lived in Kentucky.
| Pikeville: | 81.7% |
| State average: | 87.2% |
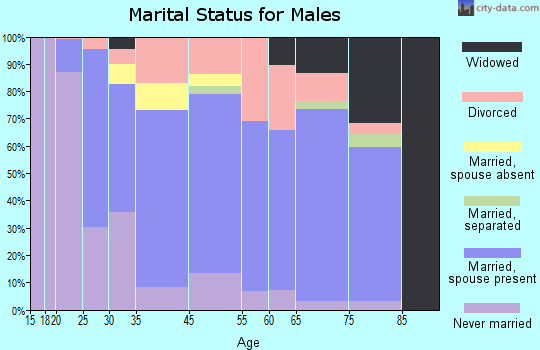
Education attainment for males 25 years and older:
- No schooling: 77
- Nursery to 4th grade: 9
- 5th and 6th grade: 46
- 7th and 8th grade: 122
- 9th grade: 51
- 10th grade: 91
- 11th grade: 69
- 12th grade, no diploma: 4
- High school graduate (or equivalency): 565
- Less than 1 year of college: 223
- Some college more than 1 year, no degree: 201
- Associate degree: 89
- Bachelor's degree: 568
- Master's degree: 144
- Professional school degree: 171
- Doctorate degree: 65

Education attainment for females 25 years and older:
- No schooling: 17
- Nursery to 4th grade: 0
- 5th and 6th grade: 8
- 7th and 8th grade: 50
- 9th grade: 51
- 10th grade: 55
- 11th grade: 109
- 12th grade, no diploma: 7
- High school graduate (or equivalency): 576
- Less than 1 year of college: 113
- Some college more than 1 year, no degree: 214
- Associate degree: 224
- Bachelor's degree: 518
- Master's degree: 585
- Professional school degree: 60
- Doctorate degree: 27

Housing units in structures:
- One, detached: 1,698
- One, attached: 113
- Two: 109
- 3 or 4: 372
- 5 to 9: 498
- 10 to 19: 24
- 20 to 49: 190
- 50 or more: 286
- Mobile homes: 157
Housing units lacking complete kitchen facilities in 2022: 0.6%
House/condo owner moved in on average 15 years ago
Renter moved in on average 2 years ago

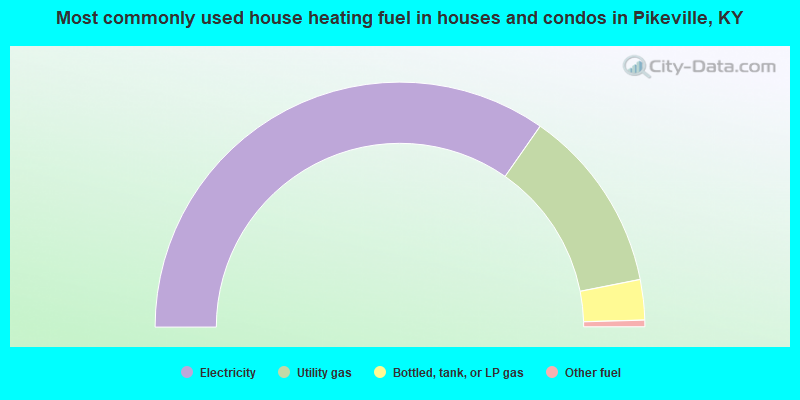
- 69.4%Electricity
- 24.4%Utility gas
- 5.3%Bottled, tank, or LP gas
- 0.9%Other fuel
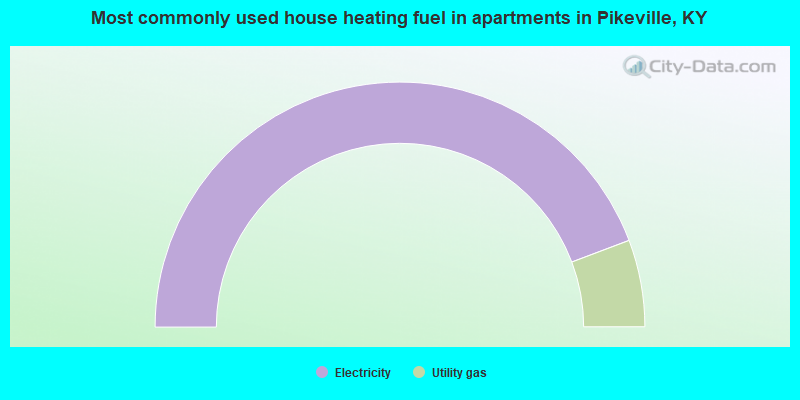
- 88.5%Electricity
- 11.5%Utility gas
Private vs. public school enrollment:
| Here: | 19.3% |
| Kentucky: | 17.2% |
| Here: | 7.1% |
| Kentucky: | 15.2% |
| Here: | 31.3% |
| Kentucky: | 19.6% |


