Plum, PA (Pennsylvania) Houses and Residents
| Plum: | $220,482 |
| Pennsylvania: | $245,500 |
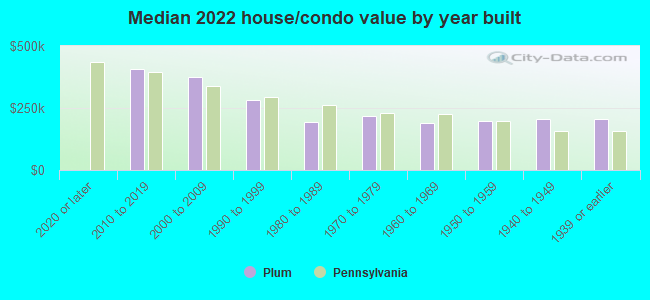
Mean price in 2022:
Detached houses: $230,447
Here: $230,447 State: $317,202 Townhouses or other attached units: $199,845
Here: $199,845 State: $254,369 In 5-or-more-unit structures: $313,770
Here: $313,770 State: $320,068 Mobile homes: $80,065
Here: $80,065 State: $92,414
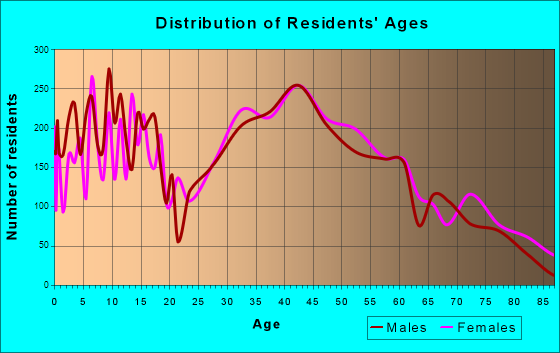
Total population: 27,532 (Urban population: 23,989, Rural population: 2,951 (all nonfarm))
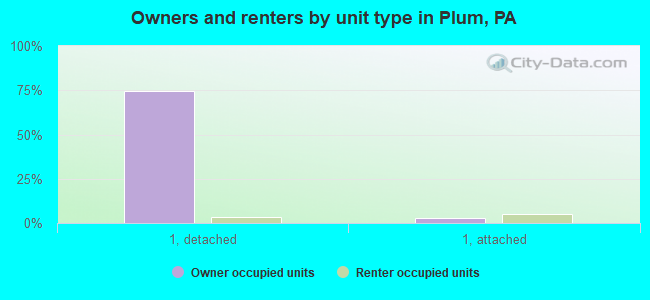
Houses: 11,475 (10,787 occupied: 8,665 owner occupied, 1,931 renter occupied)
| % of renters here: | 18% |
| State: | 31% |
Housing density: 401 houses/condos per square mile
Median price asked for vacant for-sale houses and condos in 2022: $160,593.
Median contract rent in 2022: $867 (lower quartile is $725, upper quartile is $1,109)
Median rent asked for vacant for-rent units in 2022: $1,587
Median gross rent in Plum, PA in 2022: $1,089
Housing units in Plum with a mortgage: 5,038 (584 second mortgage, 30 home equity loan, 472 both second mortgage and home equity loan)
Houses without a mortgage: 389
Median household income for houses/condos with a mortgage: $118,830
Median household income for apartments without a mortgage: $76,896
Median monthly housing costs: $1,122
Compare current foreclosures near Plum, PA:
| Photo | Address | Area | Beds / Baths | Price | Details |
|---|---|---|---|---|---|

|
#1
Collins St
Mckeesport, PA 15132
|
1,176 sq. feet
|
1 baths 3 beds |
$34,500
|
show details |

|
#2
Punta Gorda St
East Mc Keesport, PA 15035
|
1,200 sq. feet
|
1 baths 3 beds |
$165,500
|
show details |

|
#3
Leslie St
East Mc Keesport, PA 15035
|
1,144 sq. feet
|
1 baths 2 beds |
$54,900
|
show details |

|
#4
Mount Vernon St
Pittsburgh, PA 15208
|
1,452 sq. feet
|
1 baths 6 beds |
$176,500
|
show details |

|
#5
Brinwood Ave
Pittsburgh, PA 15227
|
1,000 sq. feet
|
2 baths 3 beds |
$222,900
|
show details |

|
#6
Kirk Ave
Pittsburgh, PA 15227
|
1,500 sq. feet
|
2 baths 3 beds |
$189,500
|
show details |

|
#7
Triana St
Pittsburgh, PA 15210
|
1,184 sq. feet
|
1 baths 3 beds |
$151,500
|
show details |

|
#8
Munson Ave
Mc Kees Rocks, PA 15136
|
1,600 sq. feet
|
1 baths 3 beds |
$159,500
|
show details |

|
#9
Grant St
Carnegie, PA 15106
|
1,345 sq. feet
|
2 baths 4 beds |
$225,500
|
show details |

|
#10
Russellwood Ave
Mc Kees Rocks, PA 15136
|
1,840 sq. feet
|
1 baths 3 beds |
$32,500
|
show details |
| Photo | Address | Area | Beds / Baths | Price | Details |
|---|---|---|---|---|---|

|
#11
Mcintosh Dr
Mckeesport, PA 15132
|
1,306 sq. feet
|
2 baths 4 beds |
$236,500
|
show details |

|
#12
Ice Pond Rd
Leechburg, PA 15656
|
1,440 sq. feet
|
1 baths 3 beds |
$189,500
|
show details |

|
#13
N Hills Rd
Murrysville, PA 15668
|
1,690 sq. feet
|
1 baths 3 beds |
$159,900
|
show details |

|
#14
Beale Ave
Leechburg, PA 15656
|
1,200 sq. feet
|
1 baths 2 beds |
$52,770
|
show details |

|
#15
25th St
Mckeesport, PA 15132
|
1,024 sq. feet
|
1 baths 2 beds |
$44,900
|
show details |

|
#16
Armstrong Ave
Vandergrift, PA 15690
|
1,206 sq. feet
|
1 baths 2 beds |
$73,510
|
show details |

|
#17
Riverside Dr
Freeport, PA 16229
|
1,060 sq. feet
|
1 baths 3 beds |
$97,941
|
show details |

|
#18
Maple Rd
Vandergrift, PA 15690
|
1,144 sq. feet
|
1 baths 3 beds |
$63,205
|
show details |

|
#19
Hungry Hollow Rd
Leechburg, PA 15656
|
1,496 sq. feet
|
1 baths 4 beds |
$14,900
|
show details |

|
#20
Lehigh Dr
Leechburg, PA 15656
|
1,154 sq. feet
|
1 baths 3 beds |
$17,206
|
show details |
| Photo | Address | Area | Beds / Baths | Price | Details |
|---|---|---|---|---|---|

|
#21
Terrace Ave
Apollo, PA 15613
|
856 sq. feet
|
1 baths 2 beds |
$76,005
|
show details |

|
#22
Canal Rd
Apollo, PA 15613
|
1,517 sq. feet
|
1 baths 5 beds |
$159,924
|
show details |

|
#23
Crucible St
Pittsburgh, PA 15220
|
1,980 sq. feet
|
2 baths 4 beds |
show details | |

|
#24
North Ave Apt 1
Pittsburgh, PA 15221
|
1,759 sq. feet
|
2 baths 2 beds |
show details | |

|
#25
California Ave
Pittsburgh, PA 15202
|
1,976 sq. feet
|
4 baths 4 beds |
show details | |

|
#26
Ruth St
Pittsburgh, PA 15211
|
1,232 sq. feet
|
1 baths 3 beds |
show details | |

|
#27
Inwood St
Pittsburgh, PA 15208
|
2,627 sq. feet
|
2 baths 5 beds |
show details | |

|
#28
Gaskell St
Pittsburgh, PA 15211
|
1,336 sq. feet
|
1 baths 3 beds |
show details | |

|
#29
Saint Lawrence Ave
Pittsburgh, PA 15218
|
1,620 sq. feet
|
1 baths 3 beds |
show details | |

|
#30
Argonne Dr
Natrona Heights, PA 15065
|
1,608 sq. feet
|
2 baths 3 beds |
show details |
| Photo | Address | Area | Beds / Baths | Price | Details |
|---|---|---|---|---|---|

|
#31
Mckinley St
Pittsburgh, PA 15210
|
2,197 sq. feet
|
2 baths 3 beds |
show details | |

|
#32
Thomas Blvd
Pittsburgh, PA 15208
|
4,875 sq. feet
|
4 baths 8 beds |
show details | |

|
#33
Oakview Ave
Pittsburgh, PA 15218
|
1,368 sq. feet
|
1 baths 3 beds |
show details | |

|
#34
Drycove St
Pittsburgh, PA 15210
|
1,224 sq. feet
|
2 baths 3 beds |
show details | |

|
#35
9th St
Glassport, PA 15045
|
825 sq. feet
|
1 baths 2 beds |
show details | |

|
#36
Ridge Rd
Mckeesport, PA 15135
|
2,642 sq. feet
|
3 baths 3 beds |
show details | |

|
#37
Amanda Ave
Pittsburgh, PA 15210
|
1,993 sq. feet
|
1 baths 3 beds |
show details | |

|
#38
Western Ave
Pittsburgh, PA 15233
|
4,800 sq. feet
|
3 baths 5 beds |
show details | |

|
#39
Lelia St
Pittsburgh, PA 15211
|
1,760 sq. feet
|
1 baths 3 beds |
show details | |

|
#40
Riverview Ave
Pittsburgh, PA 15214
|
3,754 sq. feet
|
4 baths 7 beds |
show details |
| Photo | Address | Area | Beds / Baths | Price | Details |
|---|---|---|---|---|---|

|
#41
Dennison Dr
West Mifflin, PA 15122
|
936 sq. feet
|
1 baths 3 beds |
show details | |

|
#42
Dennison Dr
West Mifflin, PA 15122
|
936 sq. feet
|
1 baths 3 beds |
show details | |

|
#43
Madison St
Braddock, PA 15104
|
1,332 sq. feet
|
1 baths 3 beds |
show details | |

|
#44
Linden St
Natrona Heights, PA 15065
|
1,200 sq. feet
|
1 baths 3 beds |
show details | |

|
#45
E Francis Ave
Pittsburgh, PA 15227
|
1,564 sq. feet
|
1 baths 3 beds |
show details | |

|
#46
Nuzum Ave
Pittsburgh, PA 15210
|
1,050 sq. feet
|
1 baths 2 beds |
show details | |

|
#47
Roup Ave
Brackenridge, PA 15014
|
1,190 sq. feet
|
1 baths 3 beds |
show details | |

|
#48
Newett St
Pittsburgh, PA 15210
|
2,295 sq. feet
|
2 baths 3 beds |
show details | |

|
#49
Sylvania Ave
Pittsburgh, PA 15210
|
2,411 sq. feet
|
2 baths 4 beds |
show details | |

|
Check over 1 million property listings on Foreclosure.com!
|
browse all offers | |||

Latest news about housing in Plum, PA collected exclusively by city-data.com from local newspapers, TV, and radio stations

 | What is going on at the monroeville mall? (25 replies) |
| Neighborhood of the week: Homewood (North/South/West) (24 replies) |
| Suburb of the week: Plum (6 replies) |
| 9% of Black population displaced in 4 years (45 replies) |
| Suburb of the week: Churchill (30 replies) |
| Looking for a home in East or North Hills (15 replies) |
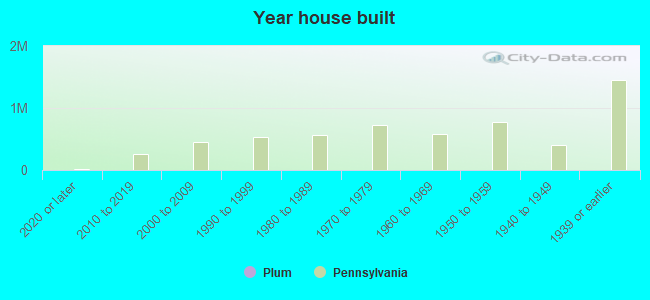
Median year apartment built: 1979
Household type by relationship:
Households: 26,770- Male householders: 5,506 (991 living alone), Female householders: 5,116 (1,595 living alone)
6,293 spouses (6,284 opposite-sex spouses), 633 unmarried partners, (569 opposite-sex unmarried partners), 8,237 children (7,737 natural, 77 adopted, 422 stepchildren), 179 grandchildren, 86 brothers or sisters, 306 parents, 0 foster children, 147 other relatives, 174 non-relatives
- In group quarters: 88
Size of family households: 3,739 2-persons, 1,402 3-persons, 1,512 4-persons, 470 5-persons, 156 6-persons, 96 7-or-more-persons.
Size of nonfamily households: 2,654 1-person, 478 2-persons, 14 5-persons.
4,704 married couples with children.
826 single-parent households (402 men, 424 women).
96.9% of residents of Plum speak English at home.
0.3% of residents speak Spanish at home (67% speak English very well, 29% speak English well, 4% don't speak English at all).
2.0% of residents speak other Indo-European language at home (73% speak English very well, 20% speak English well, 7% speak English not well).
0.6% of residents speak Asian or Pacific Island language at home (82% speak English very well, 18% speak English not well).
0.1% of residents speak other language at home (100% speak English very well).
Foreign born population: 374 (1.4%)
(91.2% of them are naturalized citizens)
| Here: | 7.1 |
| State: | 6.8 |
| Here: | 4.2 |
| State: | 4.3 |
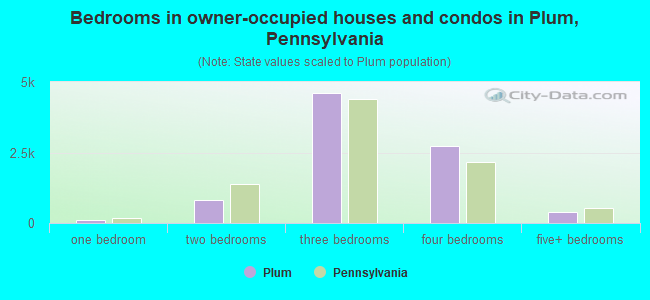
- Bedrooms in owner-occupied houses and condos in Plum, Pennsylvania
- 0no bedroom
- 1111 bedroom
- 8272 bedrooms
- 4,5993 bedrooms
- 2,7464 bedrooms
- 3825+ bedrooms
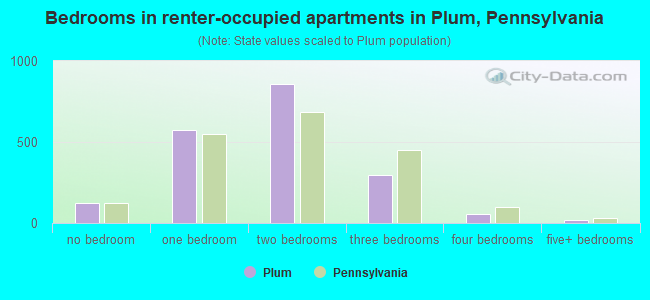
- Bedrooms in renter-occupied apartments in Plum, Pennsylvania
- 121no bedroom
- 5771 bedroom
- 8572 bedrooms
- 2993 bedrooms
- 564 bedrooms
- 215+ bedrooms
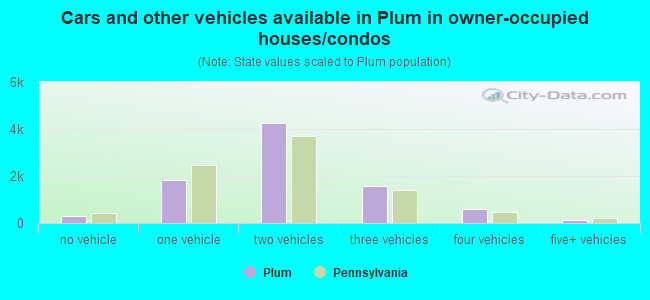
- Cars and other vehicles available in Plum in owner-occupied houses/condos
- 296no vehicle
- 1,8401 vehicle
- 4,2702 vehicles
- 1,5583 vehicles
- 5854 vehicles
- 1165+ vehicles
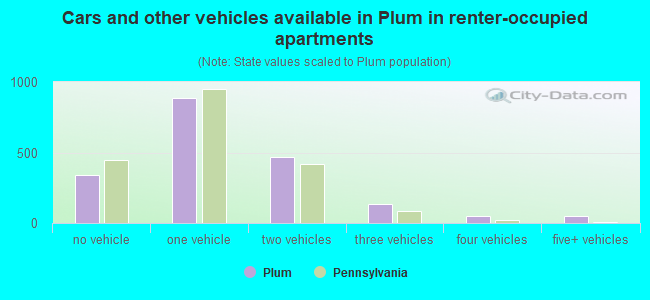
- Cars and other vehicles available in Plum in renter-occupied apartments
- 339no vehicle
- 8891 vehicle
- 4692 vehicles
- 1363 vehicles
- 484 vehicles
- 495+ vehicles
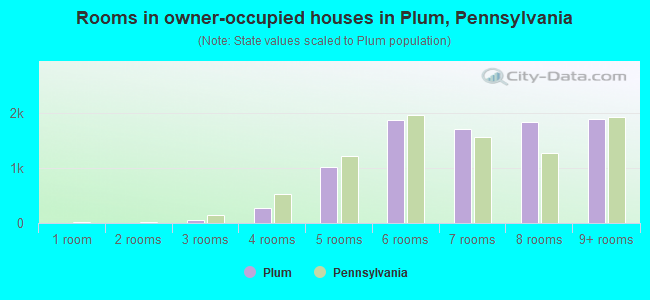
- Rooms in owner-occupied houses in Plum, Pennsylvania
- 01 room
- 02 rooms
- 623 rooms
- 2674 rooms
- 1,0245 rooms
- 1,8686 rooms
- 1,7177 rooms
- 1,8298 rooms
- 1,8989+ rooms
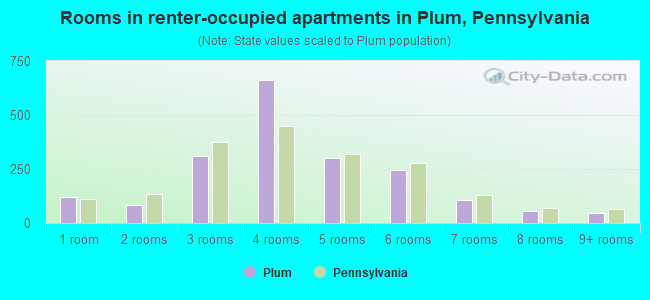
- Rooms in renter-occupied apartments in Plum, Pennsylvania
- 1211 room
- 852 rooms
- 3093 rooms
- 6604 rooms
- 3035 rooms
- 2446 rooms
- 1057 rooms
- 578 rooms
- 479+ rooms
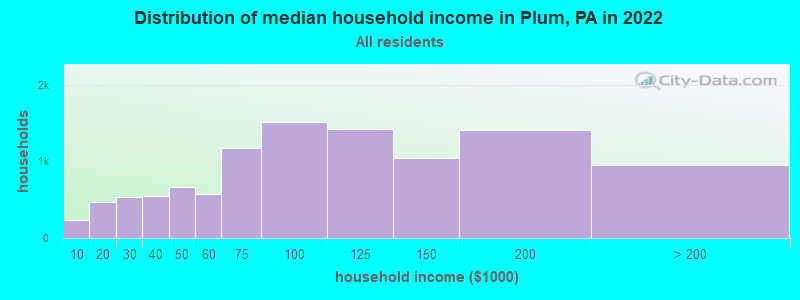
Plum, PA household income distribution

- 239Less than $10,000
- 474$10,000 to $19,999
- 535$20,000 to $29,999
- 549$30,000 to $39,999
- 661$40,000 to $49,999
- 575$50,000 to $59,999
- 1,176$60,000 to $74,999
- 1,513$75,000 to $99,999
- 1,424$100,000 to $124,999
- 1,046$125,000 to $149,999
- 1,410$150,000 to $199,999
- 958$200,000 or more
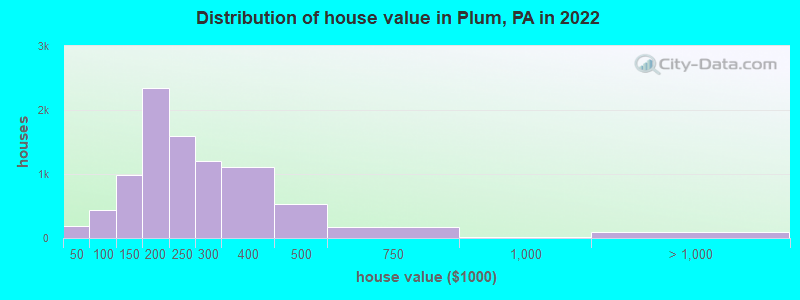
Home value of owner - occupied houses in 2022 in Plum, PA
-
- 52Less than $10,000
- 9$10,000 to $14,999
- 36$15,000 to $19,999
- 24$25,000 to $29,999
- 5$30,000 to $34,999
- 31$35,000 to $39,999
- 23$40,000 to $49,999
- 51$50,000 to $59,999
- 36$60,000 to $69,999
- 73$70,000 to $79,999
- 150$80,000 to $89,999
- 99$90,000 to $99,999
- 492$100,000 to $124,999
- 490$125,000 to $149,999
- 1,302$150,000 to $174,999
- 1,046$175,000 to $199,999
- 1,592$200,000 to $249,999
- 1,206$250,000 to $299,999
- 1,105$300,000 to $399,999
- 537$400,000 to $499,999
- 165$500,000 to $749,999
- 22$750,000 to $999,999
- 6$1,500,000 to $1,999,999
- 82$2,000,000 or more
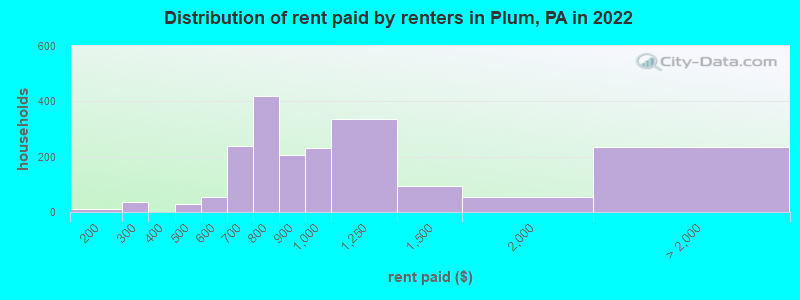
Rent paid by renters in 2022 in Plum, PA
-
- 10$150 to $199
- 36$250 to $299
- 28$400 to $449
- 43$500 to $549
- 9$550 to $599
- 176$600 to $649
- 60$650 to $699
- 161$700 to $749
- 256$750 to $799
- 206$800 to $899
- 233$900 to $999
- 334$1,000 to $1,249
- 93$1,250 to $1,499
- 52$1,500 to $1,999
- 10$2,000 to $2,499
- 16$2,500 to $2,999
- 13$3,000 to $3,499
- 118$3,500 or more
- 74No cash rent
Percentage of workers working in this county: 86.3%
Number of people working at home: 3,390 (24.0% of all workers)
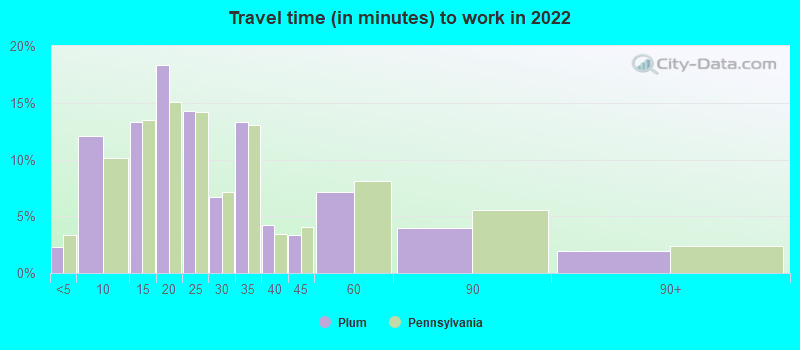
Travel time to work (commute)
- Less than 5 minutes: 115
- 5 to 9 minutes: 739
- 10 to 14 minutes: 962
- 15 to 19 minutes: 1,463
- 20 to 24 minutes: 1,538
- 25 to 29 minutes: 733
- 30 to 34 minutes: 1,811
- 35 to 39 minutes: 577
- 40 to 44 minutes: 444
- 45 to 59 minutes: 1,379
- 60 to 89 minutes: 661
- 90 or more minutes: 225
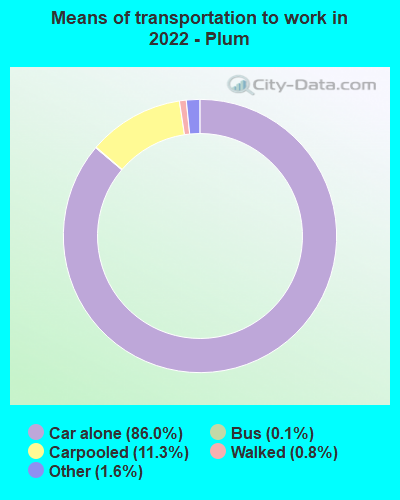
Means of transportation to work:
- Drove a car alone: 4,832 (57.4%)
- Carpooled: 615 (7.3%)
- Bus: 5 (0.1%)
- Taxi: 107 (1.3%)
- Bicycle: 5 (0.1%)
- Walked: 49 (0.6%)
- Worked at home: 3,390 (40.3%)
- Unemployment by race in 2022
- Unemployment rate for White non-Hispanic residents
- 2.3%Males
- 1.2%Females
- Unemployment rate for Black residents
- 3.7%Females
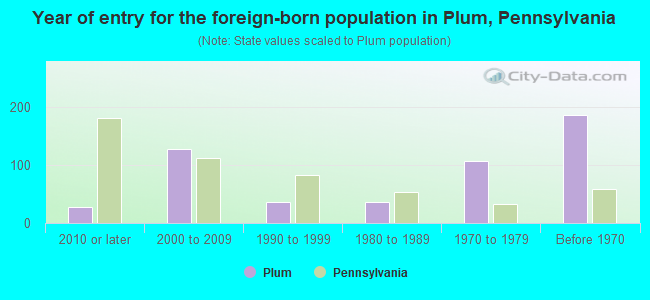
- Year of entry for the foreign-born population in Plum, Pennsylvania
- 282010 or later
- 1282000 to 2009
- 371990 to 1999
- 361980 to 1989
- 1061970 to 1979
- 186Before 1970
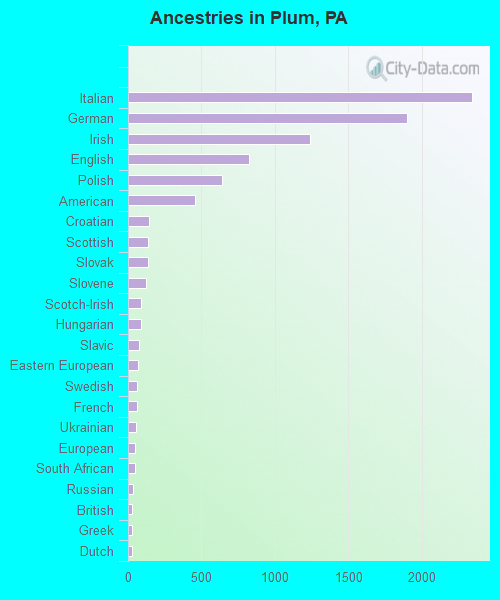
First ancestries reported:
- Italian: 2,342 (23.1%)
- German: 1,900 (18.7%)
- Irish: 1,241 (12.2%)
- English: 823 (8.1%)
- Polish: 642 (6.3%)
- American: 455 (4.5%)
- Croatian: 143 (1.4%)
- Scottish: 138 (1.4%)
- Slovak: 137 (1.4%)
- Slovene: 122 (1.2%)
- Scotch-Irish: 88 (0.9%)
- Hungarian: 86 (0.8%)
- Slavic: 74 (0.7%)
- Eastern European: 66 (0.7%)
- Swedish: 59 (0.6%)
- French: 58 (0.6%)
- Ukrainian: 52 (0.5%)
- European: 46 (0.5%)
- South African: 46 (0.5%)
- Russian: 33 (0.3%)
- British: 30 (0.3%)
- Greek: 30 (0.3%)
- Dutch: 25 (0.2%)
- Welsh: 19 (0.2%)
- Norwegian: 14 (0.1%)
- Lithuanian: 11 (0.1%)
- Scandinavian: 10 (0.10%)
- African: 9 (0.09%)
- Austrian: 6 (0.06%)
- Pennsylvania German: 6 (0.06%)
- Romanian: 5 (0.05%)
- Czechoslovakian: 4 (0.04%)
- Portuguese: 4 (0.04%)
- Haitian: 4 (0.04%)
Most common places of birth for foreign-born residents (%):
| Plum: | 34.0% (143) |
| Pennsylvania: | 10.7% (100,596) |
| Plum: | 11.9% (50) |
| Pennsylvania: | 0.2% (1,956) |
| Plum: | 10.0% (42) |
| Pennsylvania: | 1.3% (12,172) |
| Plum: | 9.0% (38) |
| Pennsylvania: | 2.2% (21,039) |
| Plum: | 5.0% (21) |
| Pennsylvania: | 2.9% (27,433) |
| Plum: | 4.8% (20) |
| Pennsylvania: | 0.3% (2,601) |
| Plum: | 4.5% (19) |
| Pennsylvania: | 7.2% (67,704) |
| Plum: | 4.3% (18) |
| Pennsylvania: | 0.3% (2,787) |
| Plum: | 4.3% (18) |
| Pennsylvania: | 0.6% (6,036) |
Place of birth for U.S.-born residents:
- This state: 22,757
- Other state: 3,581
- Northeast: 597
- Midwest: 1,290
- South: 1,185
- West: 538
94.6% of Plum residents lived in the same house 1 years ago.
Out of people who lived in different houses, 43.1% lived in this county.
Out of people who lived in different counties, 67.1% lived in Pennsylvania.
| Plum: | 94.6% |
| State average: | 89.3% |
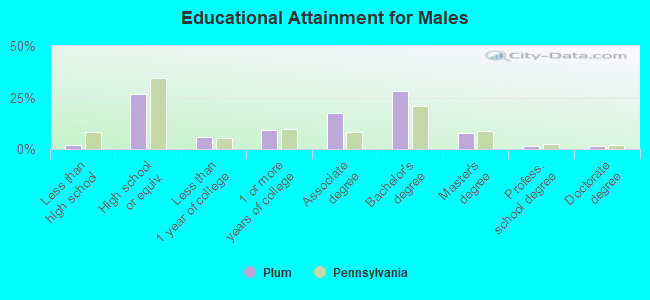
Education attainment for males 25 years and older:
- No schooling: 10
- Nursery to 4th grade: 0
- 5th and 6th grade: 0
- 7th and 8th grade: 0
- 9th grade: 18
- 10th grade: 29
- 11th grade: 26
- 12th grade, no diploma: 94
- High school graduate (or equivalency): 2,545
- Less than 1 year of college: 551
- Some college more than 1 year, no degree: 885
- Associate degree: 1,659
- Bachelor's degree: 2,652
- Master's degree: 729
- Professional school degree: 154
- Doctorate degree: 145
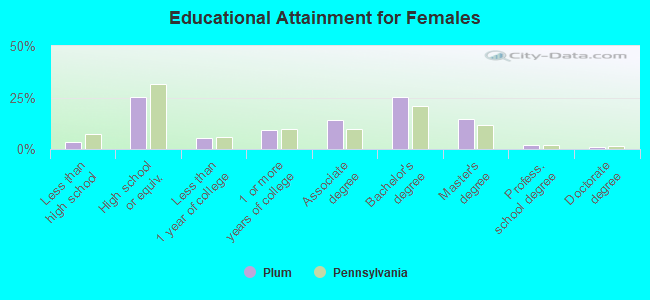
Education attainment for females 25 years and older:
- No schooling: 33
- Nursery to 4th grade: 0
- 5th and 6th grade: 0
- 7th and 8th grade: 0
- 9th grade: 17
- 10th grade: 28
- 11th grade: 112
- 12th grade, no diploma: 121
- High school graduate (or equivalency): 2,498
- Less than 1 year of college: 513
- Some college more than 1 year, no degree: 907
- Associate degree: 1,369
- Bachelor's degree: 2,497
- Master's degree: 1,454
- Professional school degree: 178
- Doctorate degree: 104
Housing units in structures:
- One, detached: 9,125
- One, attached: 982
- Two: 127
- 3 or 4: 175
- 5 to 9: 101
- 10 to 19: 298
- 20 to 49: 254
- 50 or more: 288
- Mobile homes: 120
Median worth of mobile homes: $89,815
Housing units lacking complete kitchen facilities in 2022: 1.5%
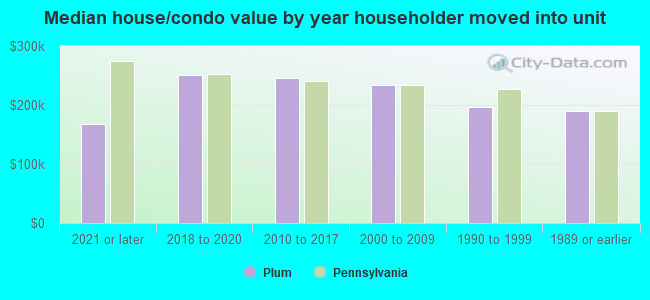
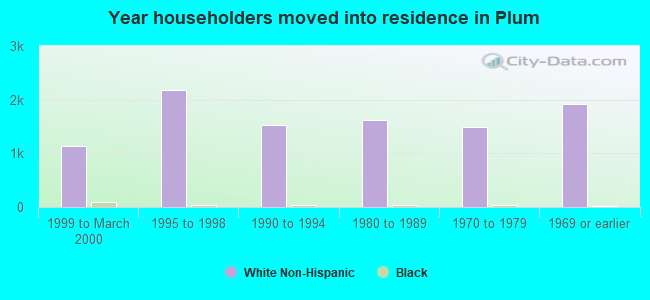
House/condo owner moved in on average 18 years ago
Renter moved in on average 3 years ago
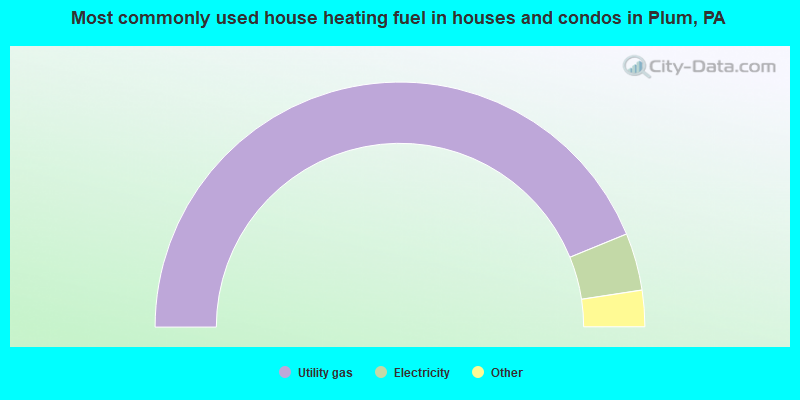
- 87.7%Utility gas
- 7.6%Electricity
- 2.9%Fuel oil, kerosene, etc.
- 1.7%Bottled, tank, or LP gas
- 0.1%Wood
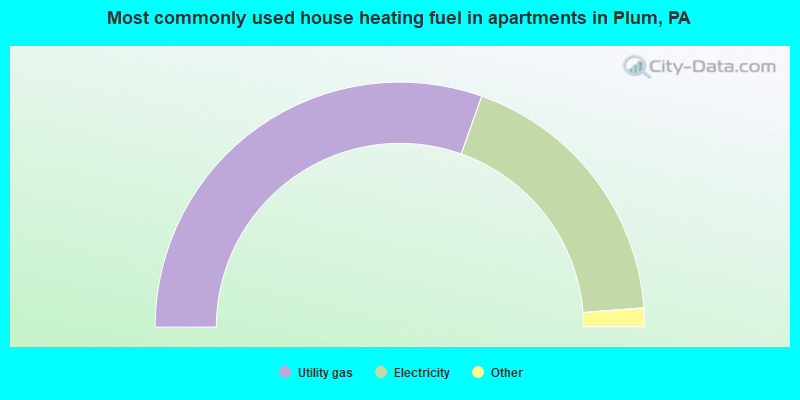
- 60.9%Utility gas
- 36.7%Electricity
- 1.9%Bottled, tank, or LP gas
- 0.5%Fuel oil, kerosene, etc.
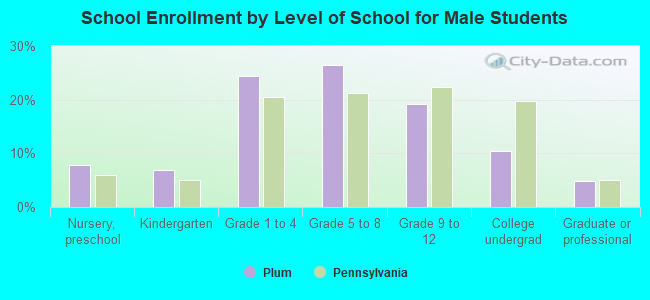
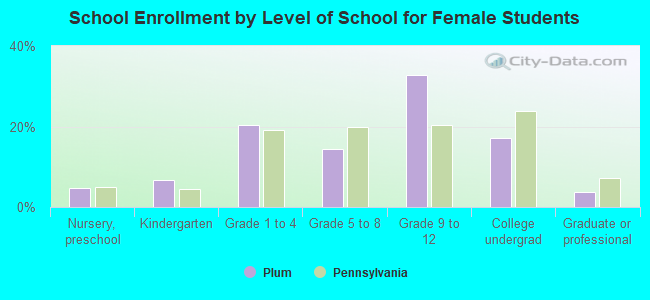
Private vs. public school enrollment:
| Here: | 11.7% |
| Pennsylvania: | 15.7% |
| Here: | 2.0% |
| Pennsylvania: | 13.4% |
| Here: | 18.7% |
| Pennsylvania: | 39.8% |