Port Washington, WI (Wisconsin) Houses and Residents
| Port Washington: | $273,491 |
| Wisconsin: | $252,800 |
Mean price in 2022:
Detached houses: $320,868
Here: $320,868 State: $308,468 Townhouses or other attached units: $470,834
Here: $470,834 State: $265,873 In 2-unit structures: $306,519
Here: $306,519 State: $203,667 In 3-to-4-unit structures: $204,979
Here: $204,979 State: $216,833 In 5-or-more-unit structures: $553,205
Here: $553,205 State: $280,537
Total population: 11,586 (Urban population: 10,320 (all inside urban clusters), Rural population: 44 (all nonfarm))
Houses: 5,413 (5,386 occupied: 3,620 owner occupied, 1,908 renter occupied)
| % of renters here: | 35% |
| State: | 32% |
Housing density: 1,407 houses/condos per square mile
Median price asked for vacant for-sale houses and condos in 2022 in this county: $317,172.
Median contract rent in 2022: $953 (lower quartile is $698, upper quartile is $1,200)
Median rent asked for vacant for-rent units in 2022: $1,298
Median gross rent in Port Washington, WI in 2022: $1,093
Housing units in Port Washington with a mortgage: 2,151 (268 second mortgage, 3 home equity loan, 250 both second mortgage and home equity loan)
Houses without a mortgage: 23
Median household income for houses/condos with a mortgage: $115,316
Median household income for apartments without a mortgage: $65,955
Median monthly housing costs: $1,205
Compare current foreclosures near Port Washington, WI:
| Photo | Address | Area | Beds / Baths | Price | Details |
|---|---|---|---|---|---|

|
#1
W Foster St
Port Washington, WI 53074
|
- sq. feet
|
- baths - beds |
show details | |

|
#2
W Sunset Rd Apt 101
Port Washington, WI 53074
|
- sq. feet
|
- baths - beds |
show details | |

|
#3
W Portview Dr
Port Washington, WI 53074
|
- sq. feet
|
- baths - beds |
show details | |

|
#4
N Freeman Dr # 8
Port Washington, WI 53074
|
- sq. feet
|
- baths - beds |
show details | |

|
#5
Westport Dr Apt 141
Port Washington, WI 53074
|
- sq. feet
|
- baths - beds |
show details | |

|
#6
E Prospect St
Port Washington, WI 53074
|
- sq. feet
|
- baths - beds |
show details | |

|
#7
W Portview Dr Apt 104
Port Washington, WI 53074
|
- sq. feet
|
- baths - beds |
show details | |

|
#8
N Franklin St
Port Washington, WI 53074
|
- sq. feet
|
- baths - beds |
show details | |

|
#9
Randy Cir
Port Washington, WI 53074
|
- sq. feet
|
- baths - beds |
show details | |

|
#10
Oak Ct
Port Washington, WI 53074
|
- sq. feet
|
- baths - beds |
show details |
| Photo | Address | Area | Beds / Baths | Price | Details |
|---|---|---|---|---|---|

|
#11
Bley Pkwy
Port Washington, WI 53074
|
- sq. feet
|
- baths - beds |
show details | |

|
#12
Raven St
West Bend, WI 53090
|
1,650 sq. feet
|
1 baths 4 beds |
show details | |

|
#13
Wayne Rd
West Bend, WI 53090
|
1,378 sq. feet
|
2 baths 3 beds |
show details | |

|
#14
Miller St
West Bend, WI 53095
|
1,081 sq. feet
|
1 baths 2 beds |
show details | |

|
#15
Cherry St
West Bend, WI 53090
|
1,484 sq. feet
|
2 baths 4 beds |
show details | |

|
#16
Creekside Pl
West Bend, WI 53095
|
2,822 sq. feet
|
2 baths 4 beds |
show details | |

|
#17
Creekwood Ln
West Bend, WI 53095
|
1,780 sq. feet
|
2 baths 3 beds |
show details | |

|
#18
Edgewater Dr
West Bend, WI 53095
|
2,230 sq. feet
|
2 baths 4 beds |
show details | |

|
#19
Goldenrod Cir
West Bend, WI 53095
|
1,406 sq. feet
|
2 baths 3 beds |
show details | |

|
#20
Green Tree Rd
West Bend, WI 53090
|
1,064 sq. feet
|
1 baths 2 beds |
show details |
| Photo | Address | Area | Beds / Baths | Price | Details |
|---|---|---|---|---|---|

|
#21
Hans St
West Bend, WI 53090
|
1,324 sq. feet
|
2 baths 3 beds |
show details | |

|
#22
Terrace Dr
West Bend, WI 53095
|
1,245 sq. feet
|
1 baths 3 beds |
show details | |

|
#23
S Indiana Ave
West Bend, WI 53095
|
1,066 sq. feet
|
1 baths 3 beds |
show details | |

|
#24
Minz Park Cir Apt 4
West Bend, WI 53095
|
1,098 sq. feet
|
1 baths 2 beds |
show details | |

|
#25
Grant Pl
West Bend, WI 53090
|
1,318 sq. feet
|
2 baths 3 beds |
show details | |

|
#26
Birchwood Dr
West Bend, WI 53095
|
864 sq. feet
|
1 baths 3 beds |
show details | |

|
#27
Clarence Ct Apt 5
West Bend, WI 53095
|
1,204 sq. feet
|
1 baths 2 beds |
show details | |

|
#28
N 18th Ave
West Bend, WI 53090
|
1,685 sq. feet
|
2 baths 4 beds |
show details | |

|
#29
S Main St
West Bend, WI 53095
|
1,560 sq. feet
|
2 baths 3 beds |
show details | |

|
#30
Summit Dr
West Bend, WI 53095
|
1,768 sq. feet
|
2 baths 3 beds |
show details |
| Photo | Address | Area | Beds / Baths | Price | Details |
|---|---|---|---|---|---|

|
#31
Kettle Ct
West Bend, WI 53090
|
3,792 sq. feet
|
3 baths 4 beds |
show details | |

|
#32
N Salisbury Rd
West Bend, WI 53090
|
802 sq. feet
|
1 baths 2 beds |
show details | |

|
#33
Larkspur Ln
West Bend, WI 53090
|
2,284 sq. feet
|
2 baths 3 beds |
show details | |

|
#34
High St
West Bend, WI 53090
|
1,400 sq. feet
|
1 baths 3 beds |
show details | |

|
#35
N University Dr Unit 123
West Bend, WI 53095
|
1,145 sq. feet
|
2 baths 2 beds |
show details | |

|
#36
N 68th St
Milwaukee, WI 53223
|
- sq. feet
|
1 baths 2 beds |
show details | |

|
#37
W Green Brook Dr
Milwaukee, WI 53224
|
- sq. feet
|
1 baths 3 beds |
show details | |

|
#38
N 70th St
Milwaukee, WI 53223
|
- sq. feet
|
2 baths 3 beds |
show details | |

|
#39
N 70th St
Milwaukee, WI 53223
|
- sq. feet
|
1 baths 3 beds |
show details | |

|
#40
N 70th St
Milwaukee, WI 53223
|
- sq. feet
|
2 baths 4 beds |
show details |
| Photo | Address | Area | Beds / Baths | Price | Details |
|---|---|---|---|---|---|

|
#41
N 70th St # 8
Milwaukee, WI 53223
|
- sq. feet
|
2 baths 4 beds |
show details | |

|
#42
W Glenbrook Rd
Milwaukee, WI 53223
|
- sq. feet
|
1 baths 3 beds |
show details | |

|
#43
N 70th St
Milwaukee, WI 53223
|
- sq. feet
|
2 baths 3 beds |
show details | |

|
#44
N Joyce Ave
Milwaukee, WI 53224
|
- sq. feet
|
1 baths 3 beds |
show details | |

|
#45
N Michael Ct
Milwaukee, WI 53224
|
- sq. feet
|
3 baths 3 beds |
show details | |

|
#46
N Edgeworth Dr
Milwaukee, WI 53223
|
- sq. feet
|
1 baths 3 beds |
show details | |

|
#47
N Highview Dr
Milwaukee, WI 53223
|
- sq. feet
|
1 baths 3 beds |
show details | |

|
#48
W Allyn St
Milwaukee, WI 53224
|
- sq. feet
|
4 baths 6 beds |
show details | |

|
#49
N 70th St
Milwaukee, WI 53223
|
- sq. feet
|
1 baths 2 beds |
show details | |

|
Check over 1 million property listings on Foreclosure.com!
|
browse all offers | |||


 | Port Washington WI (9 replies) |
| Looking for Vacation Info for Port Washington area (7 replies) |
| Is Brown Deer still safe? (19 replies) |
| Does Milwaukee have a racism problem? I have wanted to visit... (39 replies) |
| Owning Property In Chicago Vs Milwaukee (18 replies) |
| 1 acre lot & good schools (4 replies) |

Median year apartment built: 1970
Household type by relationship:
Households: 12,617- Male householders: 2,714 (860 living alone), Female householders: 2,656 (997 living alone)
2,584 spouses (2,571 opposite-sex spouses), 380 unmarried partners, (380 opposite-sex unmarried partners), 3,540 children (3,352 natural, 93 adopted, 94 stepchildren), 50 grandchildren, 105 brothers or sisters, 92 parents, 0 foster children, 66 other relatives, 107 non-relatives
- In group quarters: 319
Size of family households: 1,607 2-persons, 710 3-persons, 686 4-persons, 323 5-persons, 64 6-persons, 16 7-or-more-persons.
Size of nonfamily households: 1,853 1-person, 217 2-persons, 28 3-persons.
2,070 married couples with children.
727 single-parent households (234 men, 493 women).
96.1% of residents of Port Washington speak English at home.
1.7% of residents speak Spanish at home (56% speak English very well, 24% speak English well, 20% speak English not well).
1.2% of residents speak other Indo-European language at home (93% speak English very well, 7% speak English well).
1.0% of residents speak Asian or Pacific Island language at home (45% speak English very well, 26% speak English well, 29% speak English not well).
Foreign born population: 286 (2.3%)
(52.4% of them are naturalized citizens)
| Here: | 6.9 |
| State: | 6.5 |
| Here: | 4.4 |
| State: | 4.1 |

- Bedrooms in owner-occupied houses and condos in Port Washington, Wisconsin
- 9no bedroom
- 81 bedroom
- 6962 bedrooms
- 1,7363 bedrooms
- 1,0284 bedrooms
- 1435+ bedrooms

- Bedrooms in renter-occupied apartments in Port Washington, Wisconsin
- 45no bedroom
- 3981 bedroom
- 9982 bedrooms
- 3973 bedrooms
- 304 bedrooms
- 425+ bedrooms

- Cars and other vehicles available in Port Washington in owner-occupied houses/condos
- 34no vehicle
- 9101 vehicle
- 1,7272 vehicles
- 5943 vehicles
- 1324 vehicles
- 2235+ vehicles

- Cars and other vehicles available in Port Washington in renter-occupied apartments
- 236no vehicle
- 9851 vehicle
- 5642 vehicles
- 1143 vehicles
- 04 vehicles
- 105+ vehicles

- Rooms in owner-occupied houses in Port Washington, Wisconsin
- 91 room
- 02 rooms
- 883 rooms
- 1954 rooms
- 7715 rooms
- 6666 rooms
- 6317 rooms
- 6578 rooms
- 6039+ rooms

- Rooms in renter-occupied apartments in Port Washington, Wisconsin
- 451 room
- 462 rooms
- 3383 rooms
- 6084 rooms
- 4525 rooms
- 1256 rooms
- 1247 rooms
- 878 rooms
- 839+ rooms


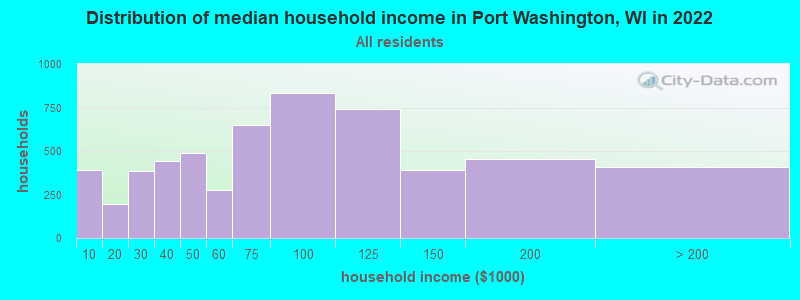
Port Washington, WI household income distribution

- 388Less than $10,000
- 196$10,000 to $19,999
- 387$20,000 to $29,999
- 445$30,000 to $39,999
- 489$40,000 to $49,999
- 275$50,000 to $59,999
- 651$60,000 to $74,999
- 836$75,000 to $99,999
- 740$100,000 to $124,999
- 389$125,000 to $149,999
- 454$150,000 to $199,999
- 407$200,000 or more
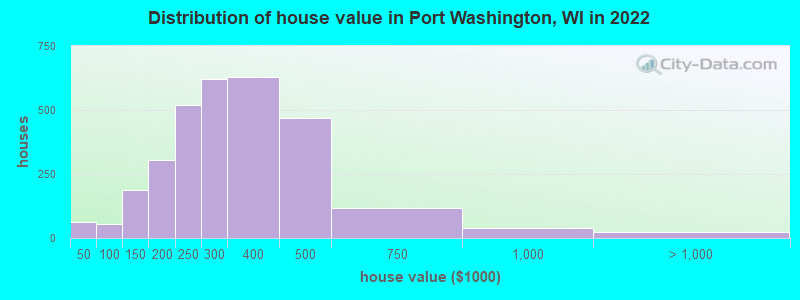
Home value of owner - occupied houses in 2022 in Port Washington, WI
-
- 18Less than $10,000
- 9$15,000 to $19,999
- 1$20,000 to $24,999
- 24$30,000 to $34,999
- 9$35,000 to $39,999
- 34$60,000 to $69,999
- 15$80,000 to $89,999
- 5$90,000 to $99,999
- 42$100,000 to $124,999
- 144$125,000 to $149,999
- 123$150,000 to $174,999
- 180$175,000 to $199,999
- 517$200,000 to $249,999
- 622$250,000 to $299,999
- 630$300,000 to $399,999
- 469$400,000 to $499,999
- 117$500,000 to $749,999
- 37$750,000 to $999,999
- 22$2,000,000 or more
Rent paid by renters in 2022 in Port Washington, WI
-
- 90$100 to $149
- 40$200 to $249
- 61$350 to $399
- 27$400 to $449
- 84$500 to $549
- 48$550 to $599
- 123$600 to $649
- 95$650 to $699
- 174$700 to $749
- 43$750 to $799
- 98$800 to $899
- 675$900 to $999
- 415$1,000 to $1,249
- 227$1,250 to $1,499
- 103$1,500 to $1,999
- 11$2,000 to $2,499
- 19No cash rent


Percentage of workers working in this county: 70.1%
Number of people working at home: 770 (12.3% of all workers)
Travel time to work (commute)
- Less than 5 minutes: 458
- 5 to 9 minutes: 1,061
- 10 to 14 minutes: 810
- 15 to 19 minutes: 722
- 20 to 24 minutes: 537
- 25 to 29 minutes: 401
- 30 to 34 minutes: 661
- 35 to 39 minutes: 302
- 40 to 44 minutes: 173
- 45 to 59 minutes: 332
- 60 to 89 minutes: 122
- 90 or more minutes: 22
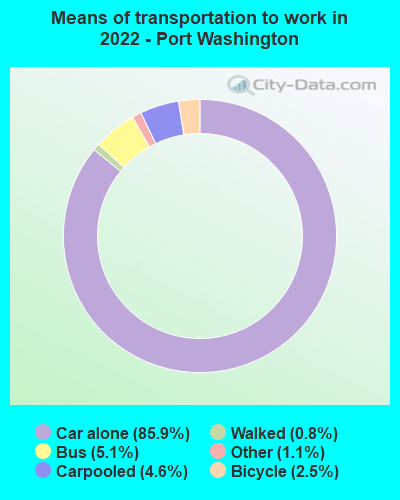
Means of transportation to work:
- Drove a car alone: 3,969 (73.3%)
- Carpooled: 235 (4.3%)
- Bus: 208 (3.8%)
- Taxi: 57 (1.1%)
- Bicycle: 114 (2.1%)
- Walked: 38 (0.7%)
- Worked at home: 770 (14.2%)

- Unemployment by race in 2022
- Unemployment rate for White non-Hispanic residents
- 1.8%Males
- 3.6%Females

- Year of entry for the foreign-born population in Port Washington, Wisconsin
- 2282010 or later
- 242000 to 2009
- 791990 to 1999
- 711980 to 1989
- 251970 to 1979
- 70Before 1970

First ancestries reported:
- German: 2,604 (47.4%)
- Polish: 370 (6.7%)
- European: 309 (5.6%)
- English: 242 (4.4%)
- American: 204 (3.7%)
- Irish: 194 (3.5%)
- Dutch: 141 (2.6%)
- Italian: 130 (2.4%)
- Luxembourger: 122 (2.2%)
- Hungarian: 108 (2.0%)
- French: 62 (1.1%)
- Norwegian: 44 (0.8%)
- Swedish: 43 (0.8%)
- Czech: 42 (0.8%)
- Scandinavian: 37 (0.7%)
- Scottish: 28 (0.5%)
- Danish: 24 (0.4%)
- Welsh: 16 (0.3%)
- Swiss: 12 (0.2%)
- Russian: 9 (0.2%)
- Austrian: 8 (0.1%)
- Northern European: 8 (0.1%)
- French Canadian: 7 (0.1%)
- Pennsylvania German: 7 (0.1%)
- Slovak: 6 (0.1%)
- British: 5 (0.09%)
- Eastern European: 5 (0.09%)
- Latvian: 5 (0.09%)
- Serbian: 4 (0.07%)
- Slovene: 3 (0.05%)
Most common places of birth for foreign-born residents (%):
| Port Washington: | 16.4% (54) |
| Wisconsin: | 1.5% (4,400) |
| Port Washington: | 14.9% (49) |
| Wisconsin: | 0.7% (1,948) |
| Port Washington: | 14.0% (46) |
| Wisconsin: | 29.5% (87,182) |
| Port Washington: | 11.2% (37) |
| Wisconsin: | 8.0% (23,594) |
| Port Washington: | 10.0% (33) |
| Wisconsin: | 0.0% (79) |
| Port Washington: | 7.6% (25) |
| Wisconsin: | 1.3% (3,727) |
| Port Washington: | 6.1% (20) |
| Wisconsin: | 0.7% (2,101) |
| Port Washington: | 3.3% (11) |
| Wisconsin: | 0.3% (962) |
| Port Washington: | 3.0% (10) |
| Wisconsin: | 0.2% (457) |
| Port Washington: | 2.1% (7) |
| Wisconsin: | 1.8% (5,320) |
| Port Washington: | 2.1% (7) |
| Wisconsin: | 3.0% (8,773) |
| Port Washington: | 1.5% (5) |
| Wisconsin: | 0.3% (802) |
| Port Washington: | 1.5% (5) |
| Wisconsin: | 0.7% (1,981) |
| Port Washington: | 1.5% (5) |
| Wisconsin: | 0.3% (935) |
Place of birth for U.S.-born residents:
- This state: 9,501
- Other state: 2,750
- Northeast: 191
- Midwest: 1,591
- South: 781
- West: 218
86.8% of Port Washington residents lived in the same house 1 years ago.
Out of people who lived in different houses, 42.1% lived in this county.
Out of people who lived in different counties, 78.1% lived in Wisconsin.
| Port Washington: | 86.8% |
| State average: | 87.7% |
Education attainment for males 25 years and older:
- No schooling: 7
- Nursery to 4th grade: 0
- 5th and 6th grade: 0
- 7th and 8th grade: 12
- 9th grade: 22
- 10th grade: 1
- 11th grade: 38
- 12th grade, no diploma: 46
- High school graduate (or equivalency): 1,259
- Less than 1 year of college: 415
- Some college more than 1 year, no degree: 491
- Associate degree: 466
- Bachelor's degree: 1,392
- Master's degree: 286
- Professional school degree: 61
- Doctorate degree: 42

Education attainment for females 25 years and older:
- No schooling: 61
- Nursery to 4th grade: 0
- 5th and 6th grade: 1
- 7th and 8th grade: 23
- 9th grade: 4
- 10th grade: 13
- 11th grade: 0
- 12th grade, no diploma: 85
- High school graduate (or equivalency): 1,543
- Less than 1 year of college: 245
- Some college more than 1 year, no degree: 705
- Associate degree: 419
- Bachelor's degree: 1,161
- Master's degree: 390
- Professional school degree: 26
- Doctorate degree: 40


Housing units in structures:
- One, detached: 3,063
- One, attached: 327
- Two: 236
- 3 or 4: 208
- 5 to 9: 762
- 10 to 19: 373
- 20 to 49: 280
- 50 or more: 161
House/condo owner moved in on average 14 years ago
Renter moved in on average 1 years ago

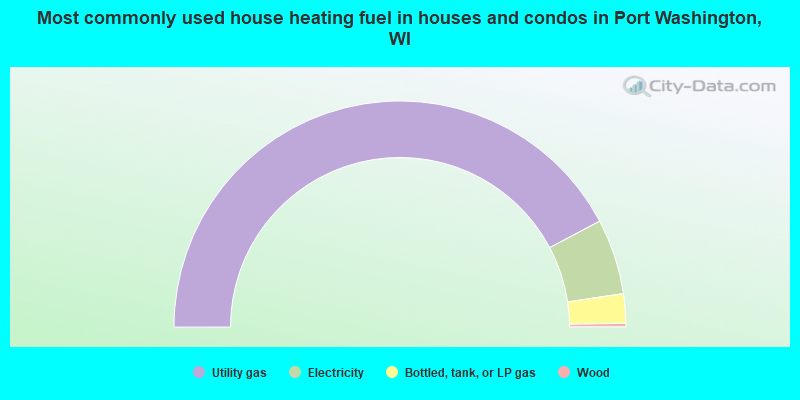
- 84.5%Utility gas
- 10.8%Electricity
- 4.2%Bottled, tank, or LP gas
- 0.5%Wood
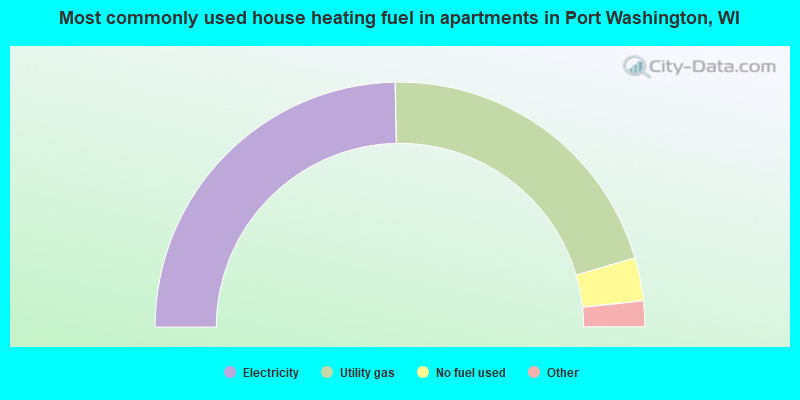
- 49.4%Electricity
- 41.5%Utility gas
- 5.7%No fuel used
- 1.9%Bottled, tank, or LP gas
- 0.9%Fuel oil, kerosene, etc.
- 0.6%Wood
Private vs. public school enrollment:
| Here: | 22.0% |
| Wisconsin: | 16.7% |
| Here: | 11.1% |
| Wisconsin: | 12.5% |
| Here: | 41.5% |
| Wisconsin: | 17.5% |


