Provo, UT (Utah) Houses and Residents
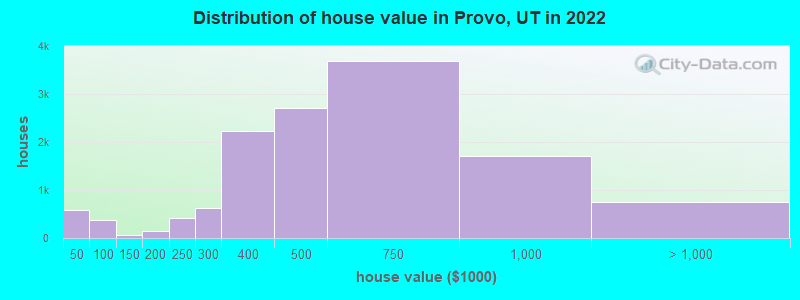
Estimated median house or condo value in 2022: $480,500 (it was $144,900 in 2000 )
Provo:
$480,500Utah:
$499,500
Lower value quartile - upper value quartile: $375,500 - $654,000Mean price in 2022: Detached houses: $589,564 Here:
$589,564State:
$607,750
Townhouses or other attached units: $432,438 Here:
$432,438State:
$444,505
In 2-unit structures: $372,318 Here:
$372,318State:
$433,540
In 3-to-4-unit structures: $471,766 Here:
$471,766State:
$362,850
In 5-or-more-unit structures: $450,699 Here:
$450,699State:
$412,810
Mobile homes: $105,833 Here:
$105,833State:
$113,475
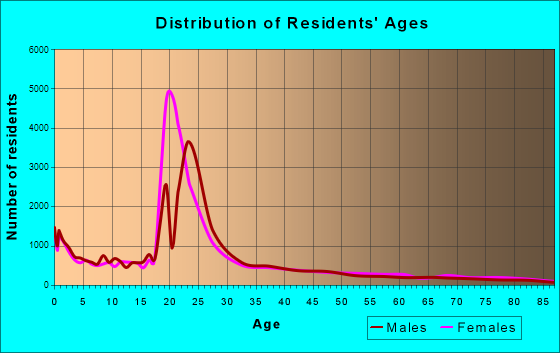
Total population: 114,801 (Urban population: 104,511, Rural population: 747 (14 farm, 733 nonfarm ))
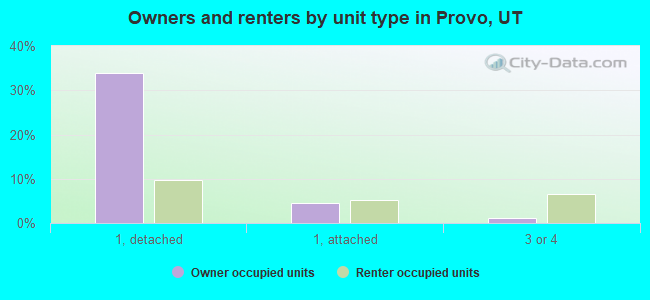
Houses: 36,340 (34,825 occupied: 13,251 owner occupied, 21,574 renter occupied )
% of renters here:
62%State:
29%
Housing density: 917 houses/condos per square mile
Median price asked for vacant for-sale houses and condos in 2022: $774,538.
Median contract rent in 2022: $982 (lower quartile is $786, upper quartile is $1,389)
Median rent asked for vacant for-rent units in 2022: $1,628
Median gross rent in Provo, UT in 2022: $1,101
Housing units in Provo with a mortgage: 8,858 (1,402 second mortgage, 33 home equity loan, 1,173 both second mortgage and home equity loan )Houses without a mortgage: 97
Median household income for houses/condos with a mortgage: $110,411
Median household income for apartments without a mortgage: $82,154
Median monthly housing costs: $1,201
Data:
Median house or condo value ($)
Median house or condo value ($ change since 2000)
Median house or condo value ($) - White
Median house or condo value ($) - Black or African American
Median house or condo value ($) - Asian
Median house or condo value ($) - Hispanic or Latino
Median house or condo value ($) - American Indian and Alaska Native
Median house or condo value ($) - Multirace
Median house or condo value ($) - Other Race
Median price asked for mobile homes ($)
Household density (households per square mile)
Mean house or condo value by units in structure - 1, detached ($)
Mean house or condo value by units in structure - 1, attached ($)
Mean house or condo value by units in structure - 2 ($)
Mean house or condo value by units in structure by units in structure - 3 or 4 ($)
Mean house or condo value by units in structure - 5 or more ($)
Mean house or condo value by units in structure - Boat, RV, van, etc. ($)
Mean house or condo value by units in structure - Mobile home ($)
Median contract rent ($)
Median contract rent - Lower quartile ($)
Median contract rent - Upper quartile ($)
Median gross rent ($)
Urban houses (%)
Rural houses (%)
Houses occupied (%)
Houses occupied (% change since 2000)
Houses owner occupied (%)
Houses owner occupied (% change since 2000)
Houses renter occupied (%)
Houses renter occupied (% change since 2000)
Vacant housing units - For rent (%)
Vacant housing units - For rent (% change since 2000)
Vacant housing units - For sale only (%)
Vacant housing units - For sale only (% change since 2000)
Vacant housing units - Rented or sold, not occupied (%)
Vacant housing units - Rented or sold, not occupied (% change since 2000)
Vacant housing units - For seasonal, recreational, or occasional use (%)
Vacant housing units - For seasonal, recreational, or occasional use (% change since 2000)
Vacant housing units - For migrant workers (%)
Vacant housing units - For migrant workers (% change since 2000)
Vacant housing units - Other vacant (%)
Vacant housing units - Other vacant (% change since 2000)
Median monthly housing costs ($)
Median household income for houses/condos with a mortgage ($)
Median household income for houses/condos without a mortgage ($)
Median household income ($)
Median household income ($) - White
Median household income ($) - Black or African American
Median household income ($) - Asian
Median household income ($) - Hispanic or Latino
Median household income ($) - American Indian and Alaska Native
Median household income ($) - Multirace
Median household income ($) - Other Race
Mortgage status - with mortgage (%)
Mortgage status - with second mortgage (%)
Mortgage status - with home equity loan (%)
Mortgage status - with both second mortgage and home equity loan (%)
Mortgage status - without a mortgage (%)
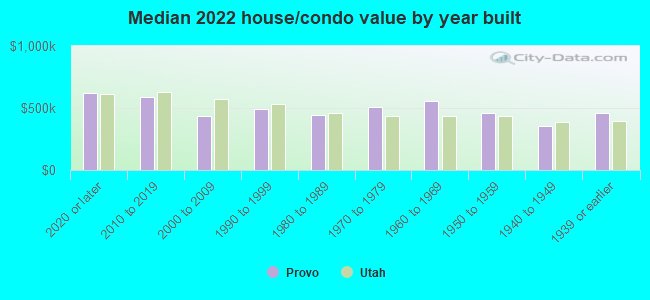
Median year house/condo built
Median year apartment built
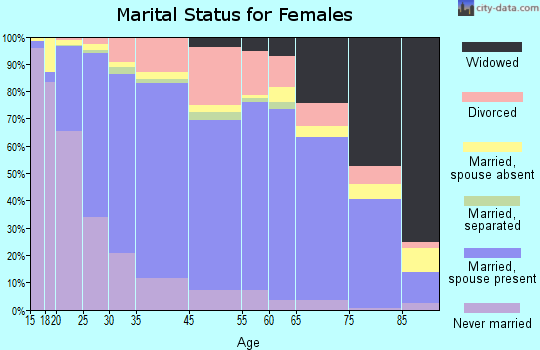
Household type by relationship - Male householder living alone (%)
Household type by relationship - Male householder not living alone (%)
Household type by relationship - Female householder living alone (%)
Household type by relationship - Female householder not living alone (%)
Household type by relationship - Opposite-Sex spouse (%)
Household type by relationship - Same-Sex spouse (%)
Household type by relationship - Opposite-Sex unmarried partner (%)
Household type by relationship - Same-Sex unmarried partner (%)
Household type by relationship - In group quarters (%)
Size of family households - 2-person household (%)
Size of family households - 3-person household (%)
Size of family households - 4-person household (%)
Size of family households - 5-person household (%)
Size of family households - 6-person household (%)
Size of family households - 7-or-more-person household (%)
Size of nonfamily households - 1-person household (%)
Size of nonfamily households - 2-person household (%)
Size of nonfamily households - 3-person household (%)
Size of nonfamily households - 4-person household (%)
Size of nonfamily households - 5-person household (%)
Size of nonfamily households - 6-person household (%)
Size of nonfamily households - 7-or-moreperson household (%)
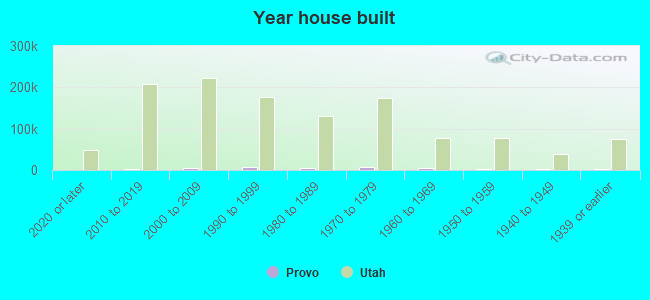
Year house built - Built 2010 or later (%)
Year house built - Built 2000 to 2009 (%)
Year house built - Built 1990 to 1999 (%)
Year house built - Built 1980 to 1989 (%)
Year house built - Built 1970 to 1979 (%)
Year house built - Built 1960 to 1969 (%)
Year house built - Built 1950 to 1959 (%)
Year house built - Built 1940 to 1949 (%)
Year house built - Built 1939 or earlier (%)
Median number of rooms in houses and condos
Median number of rooms in apartments
Median number of bedrooms in owner occupied houses
Mean number of bedrooms in owner occupied houses
Median number of bedrooms in renter occupied houses
Mean number of bedrooms in renter occupied houses
Median number of vehichles in owner occupied houses
Mean number of vehichles in owner occupied houses
Median number of vehichles in renter occupied houses
Mean number of vehichles in renter occupied houses
Rooms in owner-occupied houses - 1 room (%)
Rooms in owner-occupied houses - 2 rooms (%)
Rooms in owner-occupied houses - 3 rooms (%)
Rooms in owner-occupied houses - 4 rooms (%)
Rooms in owner-occupied houses - 5 rooms (%)
Rooms in owner-occupied houses - 6 rooms (%)
Rooms in owner-occupied houses - 7 rooms (%)
Rooms in owner-occupied houses - 8 rooms (%)
Rooms in owner-occupied houses - 9+ rooms (%)
Rooms in renter-occupied houses - 1 room (%)
Rooms in renter-occupied houses - 2 rooms (%)
Rooms in renter-occupied houses - 3 rooms (%)
Rooms in renter-occupied houses - 4 rooms (%)
Rooms in renter-occupied houses - 5 rooms (%)
Rooms in renter-occupied houses - 6 rooms (%)
Rooms in renter-occupied houses - 7 rooms (%)
Rooms in renter-occupied houses - 8 rooms (%)
Rooms in renter-occupied houses - 9+ rooms (%)
Bedrooms in owner-occupied houses - no bedrooms (%)
Bedrooms in owner-occupied houses - 1 bedroom (%)
Bedrooms in owner-occupied houses - 2 bedrooms (%)
Bedrooms in owner-occupied houses - 3 bedrooms (%)
Bedrooms in owner-occupied houses - 4 bedrooms (%)
Bedrooms in owner-occupied houses - 5+ bedrooms (%)
Bedrooms in renter-occupied houses - no bedrooms (%)
Bedrooms in renter-occupied houses - 1 bedroom (%)
Bedrooms in renter-occupied houses - 2 bedrooms (%)
Bedrooms in renter-occupied houses - 3 bedrooms (%)
Bedrooms in renter-occupied houses - 4 bedrooms (%)
Bedrooms in renter-occupied houses - 5+ bedrooms (%)
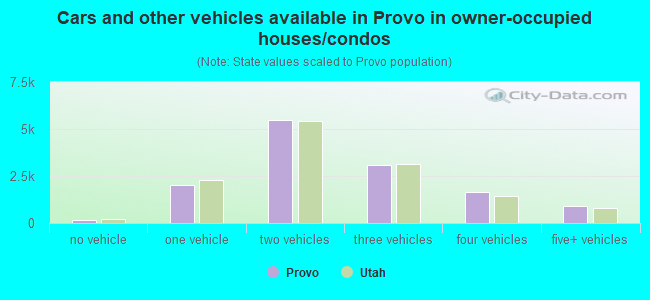
Vehicles available in owner-occupied houses - no vehicle available (%)
Vehicles available in owner-occupied houses - 1 vehicle available(%)
Vehicles available in owner-occupied houses - 2 Vehicles available (%)
Vehicles available in owner-occupied houses - 3 Vehicles available (%)
Vehicles available in owner-occupied houses - 4 Vehicles available (%)
Vehicles available in owner-occupied houses - 5+ Vehicles available (%)
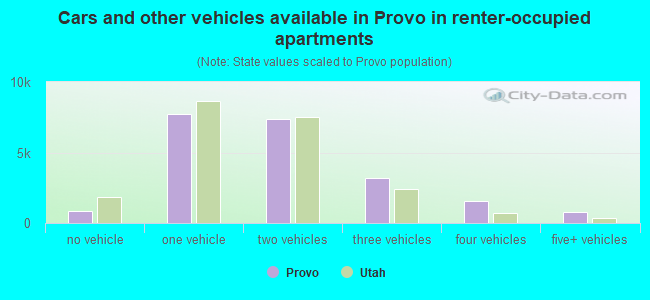
Vehicles available in renter-occupied houses - no vehicle available (%)
Vehicles available in renter-occupied houses - 1 vehicle available (%)
Vehicles available in renter-occupied houses - 2 Vehicles available (%)
Vehicles available in renter-occupied houses - 3 Vehicles available (%)
Vehicles available in renter-occupied houses - 4 Vehicles available (%)
Vehicles available in renter-occupied houses - 5+ Vehicles available (%)
Housing units in structures - 1, detached (%)
Housing units in structures - 1, attached (%)
Housing units in structures - 2 (%)
Housing units in structures - 3 or 4 (%)
Housing units in structures - 5 to 9 (%)
Housing units in structures - 10 to 19 (%)
Housing units in structures - 20 to 49 (%)
Housing units in structures - 50 or more (%)
Housing units in structures - Mobile home (%)
Housing units in structures - Boat, RV, van, etc. (%)
Housing units in structures - Owners - 1, detached (%)
Housing units in structures - Owners - 1, attached (%)
Housing units in structures - Owners - 2 (%)
Housing units in structures - Owners - 3 or 4 (%)
Housing units in structures - Owners - 5 to 9 (%)
Housing units in structures - Owners - 10 to 19 (%)
Housing units in structures - Owners - 20 to 49 (%)
Housing units in structures - Owners - 50 or more (%)
Housing units in structures - Owners - Mobile home (%)
Housing units in structures - Owners - Boat, RV, van, etc. (%)
Housing units in structures - Renters - 1, detached (%)
Housing units in structures - Renters - 1, attached (%)
Housing units in structures - Renters - 2 (%)
Housing units in structures - Renters - 3 or 4 (%)
Housing units in structures - Renters - 5 to 9 (%)
Housing units in structures - Renters - 10 to 19 (%)
Housing units in structures - Renters - 20 to 49 (%)
Housing units in structures - Renters - 50 or more (%)
Housing units in structures - Renters - Mobile home (%)
Housing units in structures - Renters - Boat, RV, van, etc. (%)
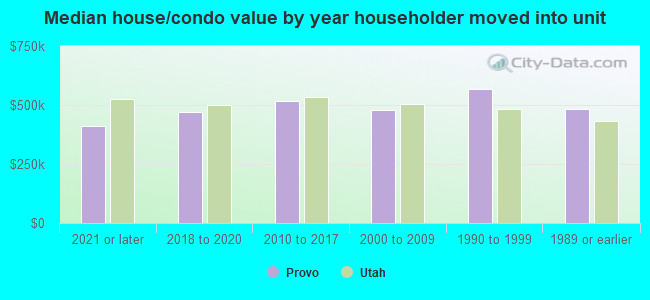
House/condo owner moved in on average (years ago)
Renter moved in on average (years ago)
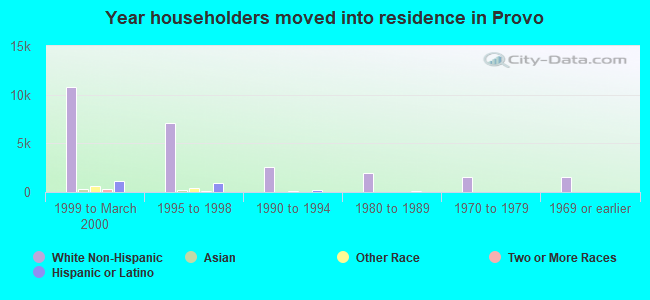
Year householder moved into unit - Moved in 1999 to March 2000 (%)
Year householder moved into unit - Moved in 1999 to March 2000 (%) - White
Year householder moved into unit - Moved in 1999 to March 2000 (%) - Black or African American
Year householder moved into unit - Moved in 1999 to March 2000 (%) - Asian
Year householder moved into unit - Moved in 1999 to March 2000 (%) - Hispanic or Latino
Year householder moved into unit - Moved in 1999 to March 2000 (%) - American Indian and Alaska Native
Year householder moved into unit - Moved in 1999 to March 2000 (%) - Multirace
Year householder moved into unit - Moved in 1999 to March 2000 (%) - Other Race
Year householder moved into unit - Moved in 1995 to 1998 (%)
Year householder moved into unit - Moved in 1995 to 1998 (%) - White
Year householder moved into unit - Moved in 1995 to 1998 (%) - Black or African American
Year householder moved into unit - Moved in 1995 to 1998 (%) - Asian
Year householder moved into unit - Moved in 1995 to 1998 (%) - Hispanic or Latino
Year householder moved into unit - Moved in 1995 to 1998 (%) - American Indian and Alaska Native
Year householder moved into unit - Moved in 1995 to 1998 (%) - Multirace
Year householder moved into unit - Moved in 1995 to 1998 (%) - Other Race
Year householder moved into unit - Moved in 1990 to 1994 (%)
Year householder moved into unit - Moved in 1990 to 1994 (%) - White
Year householder moved into unit - Moved in 1990 to 1994 (%) - Black or African American
Year householder moved into unit - Moved in 1990 to 1994 (%) - Asian
Year householder moved into unit - Moved in 1990 to 1994 (%) - Hispanic or Latino
Year householder moved into unit - Moved in 1990 to 1994 (%) - American Indian and Alaska Native
Year householder moved into unit - Moved in 1990 to 1994 (%) - Multirace
Year householder moved into unit - Moved in 1990 to 1994 (%) - Other Race
Year householder moved into unit - Moved in 1980 to 1989 (%)
Year householder moved into unit - Moved in 1980 to 1989 (%) - White
Year householder moved into unit - Moved in 1980 to 1989 (%) - Black or African American
Year householder moved into unit - Moved in 1980 to 1989 (%) - Asian
Year householder moved into unit - Moved in 1980 to 1989 (%) - Hispanic or Latino
Year householder moved into unit - Moved in 1980 to 1989 (%) - American Indian and Alaska Native
Year householder moved into unit - Moved in 1980 to 1989 (%) - Multirace
Year householder moved into unit - Moved in 1980 to 1989 (%) - Other Race
Year householder moved into unit - Moved in 1970 to 1979 (%)
Year householder moved into unit - Moved in 1970 to 1979 (%) - White
Year householder moved into unit - Moved in 1970 to 1979 (%) - Black or African American
Year householder moved into unit - Moved in 1970 to 1979 (%) - Asian
Year householder moved into unit - Moved in 1970 to 1979 (%) - Hispanic or Latino
Year householder moved into unit - Moved in 1970 to 1979 (%) - American Indian and Alaska Native
Year householder moved into unit - Moved in 1970 to 1979 (%) - Multirace
Year householder moved into unit - Moved in 1970 to 1979 (%) - Other Race
Year householder moved into unit - Moved in 1969 or earlier (%)
Year householder moved into unit - Moved in 1969 or earlier (%) - White
Year householder moved into unit - Moved in 1969 or earlier (%) - Black or African American
Year householder moved into unit - Moved in 1969 or earlier (%) - Asian
Year householder moved into unit - Moved in 1969 or earlier (%) - Hispanic or Latino
Year householder moved into unit - Moved in 1969 or earlier (%) - American Indian and Alaska Native
Year householder moved into unit - Moved in 1969 or earlier (%) - Multirace
Year householder moved into unit - Moved in 1969 or earlier (%) - Other Race
Housing units lacking complete plumbing facilities (%)
Housing units lacking complete kitchen facilities (%)
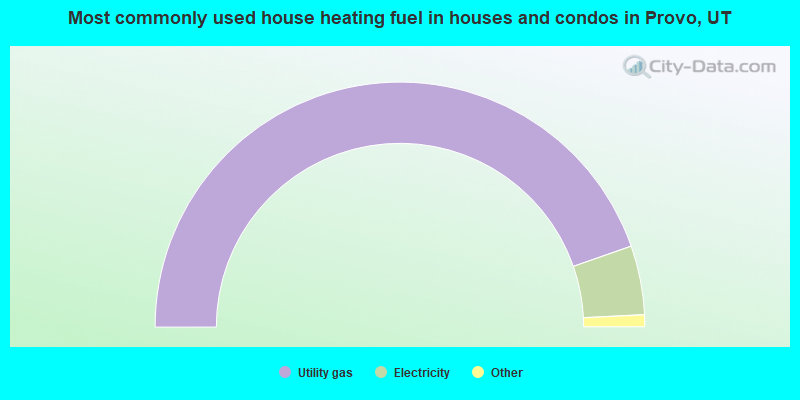
House heating fuel used in houses and condos - Utility gas (%)
House heating fuel used in houses and condos - Bottled, tank, or LP gas (%)
House heating fuel used in houses and condos - Electricity (%)
House heating fuel used in houses and condos - Fuel oil, kerosene, etc. (%)
House heating fuel used in houses and condos - Coal or coke (%)
House heating fuel used in houses and condos - Wood (%)
House heating fuel used in houses and condos - Solar energy (%)
House heating fuel used in houses and condos - Other fuel (%)
House heating fuel used in houses and condos - No fuel used (%)
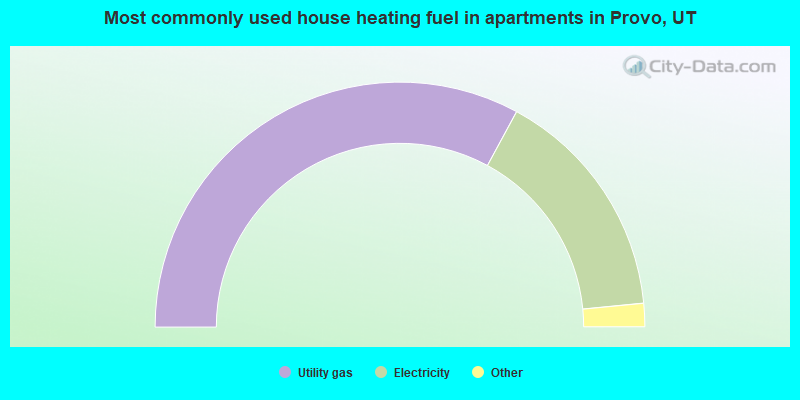
House heating fuel used in apartments - Utility gas (%)
House heating fuel used in apartments - Bottled, tank, or LP gas (%)
House heating fuel used in apartments - Electricity (%)
House heating fuel used in apartments - Fuel oil, kerosene, etc. (%)
House heating fuel used in apartments - Coal or coke (%)
House heating fuel used in apartments - Wood (%)
House heating fuel used in apartments - Solar energy (%)
House heating fuel used in apartments - Other fuel (%)
House heating fuel used in apartments - No fuel used (%)
Latest news about housing in Provo, UT collected exclusively by city-data.com from local newspapers, TV, and radio stations
Median year house/condo built: 1982Median year apartment built: 1981Household type by relationship:
Households: 113,516
Male householders: 17,578 (2,129 living alone ), Female householders: 17,247 (2,509 living alone )19,103 spouses (19,004 opposite-sex spouses ), 568 unmarried partners , (502 opposite-sex unmarried partners ), 25,816 children (24,833 natural , 526 adopted , 457 stepchildren ), 1,289 grandchildren , 2,029 brothers or sisters , 1,460 parents , 0 foster children , 1,869 other relatives , 16,846 non-relatives In group quarters: 9,711
Size of family households: 9,910 2-persons , 4,764 3-persons , 3,713 4-persons , 2,001 5-persons , 1,969 6-persons , 1,181 7-or-more-persons .
Size of nonfamily households: 4,638 1-person , 1,663 2-persons , 2,726 3-persons , 1,324 4-persons , 381 5-persons , 555 6-persons .
16,616 married couples with children. single-parent households (933 men , 2,172 women ).
73.6% of residents of Provo speak English at home. of residents speak Spanish at home (67% speak English very well , 19% speak English well , 10% speak English not well , 5% don't speak English at all ).of residents speak other Indo-European language at home (87% speak English very well , 5% speak English well , 5% speak English not well , 2% don't speak English at all ).of residents speak Asian or Pacific Island language at home (78% speak English very well , 13% speak English well , 9% speak English not well ).of residents speak other language at home (70% speak English very well , 13% speak English well , 17% speak English not well ).
Foreign born population: 12,037 (10.6%)of them are naturalized citizens )
Median number of rooms in houses and condos:
Median number of rooms in apartments
Owner-occupied Renter-occupied
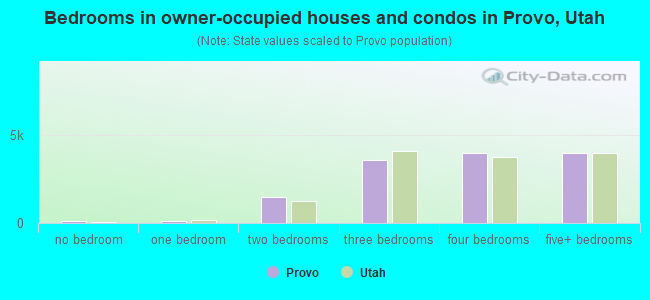
Bedrooms in owner-occupied houses and condos in Provo, Utah
106 no bedroom 110 1 bedroom 1,498 2 bedrooms 3,596 3 bedrooms 3,953 4 bedrooms 3,988 5+ bedrooms
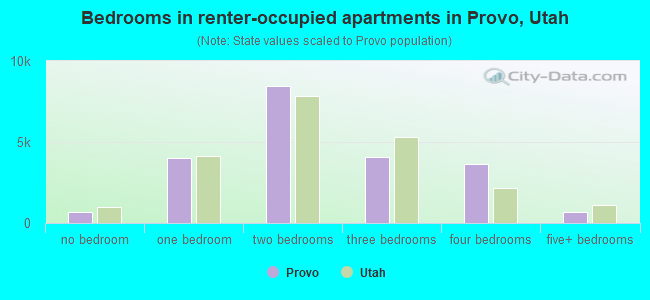
Bedrooms in renter-occupied apartments in Provo, Utah
696 no bedroom 4,006 1 bedroom 8,448 2 bedrooms 4,047 3 bedrooms 3,669 4 bedrooms 708 5+ bedrooms
Owner-occupied Renter-occupied
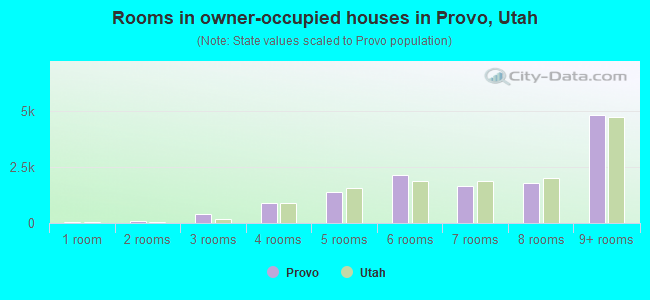
Rooms in owner-occupied houses in Provo, Utah
65 1 room 83 2 rooms 390 3 rooms 909 4 rooms 1,406 5 rooms 2,136 6 rooms 1,637 7 rooms 1,804 8 rooms 4,821 9+ rooms
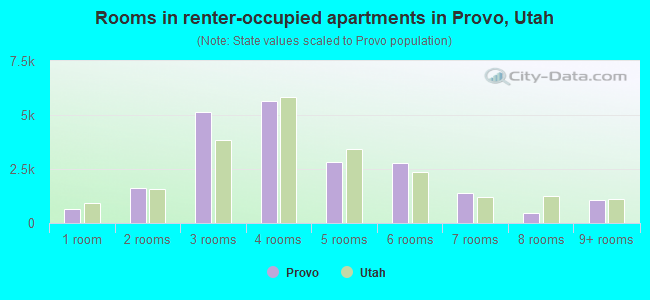
Rooms in renter-occupied apartments in Provo, Utah
634 1 room 1,622 2 rooms 5,143 3 rooms 5,653 4 rooms 2,842 5 rooms 2,775 6 rooms 1,387 7 rooms 451 8 rooms 1,067 9+ rooms
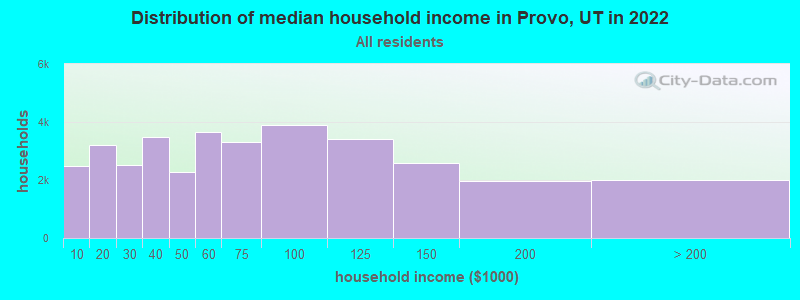
Provo, UT household income distribution 2,479 Less than $10,0003,200 $10,000 to $19,9992,506 $20,000 to $29,9993,496 $30,000 to $39,9992,260 $40,000 to $49,9993,669 $50,000 to $59,9993,322 $60,000 to $74,9993,910 $75,000 to $99,9993,405 $100,000 to $124,9992,590 $125,000 to $149,9991,976 $150,000 to $199,9992,012 $200,000 or more
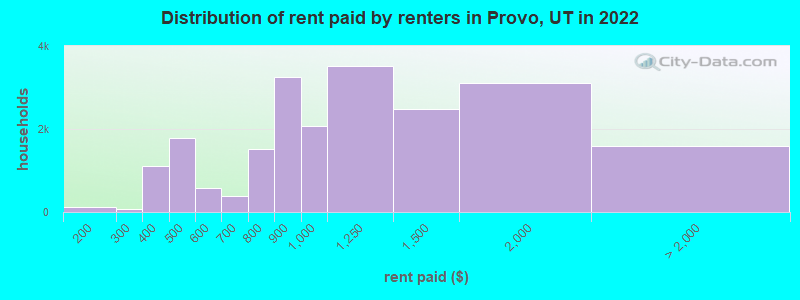
Home value of owner - occupied houses in 2022 in Provo, UT 124 Less than $10,0006 $10,000 to $14,99913 $15,000 to $19,99940 $20,000 to $24,999203 $25,000 to $29,9997 $30,000 to $34,99932 $35,000 to $39,999163 $40,000 to $49,99970 $50,000 to $59,99917 $60,000 to $69,99978 $70,000 to $79,99927 $80,000 to $89,99917 $90,000 to $99,99950 $100,000 to $124,99915 $125,000 to $149,99981 $150,000 to $174,99964 $175,000 to $199,999410 $200,000 to $249,999617 $250,000 to $299,9992,228 $300,000 to $399,9992,706 $400,000 to $499,9993,685 $500,000 to $749,9991,704 $750,000 to $999,999575 $1,000,000 to $1,499,99963 $1,500,000 to $1,999,999104 $2,000,000 or moreRent paid by renters in 2022 in Provo, UT 117 $150 to $19968 $250 to $299249 $300 to $349858 $350 to $399582 $400 to $4491,206 $450 to $499523 $500 to $54956 $550 to $59953 $600 to $649328 $650 to $699421 $700 to $7491,095 $750 to $7993,257 $800 to $8992,071 $900 to $9993,512 $1,000 to $1,2492,491 $1,250 to $1,4993,099 $1,500 to $1,999964 $2,000 to $2,49941 $2,500 to $2,99946 $3,500 or more537 No cash rent
Percentage of workers working in this county: 90.8%Number of people working at home: 9,751 (14.7% of all workers )
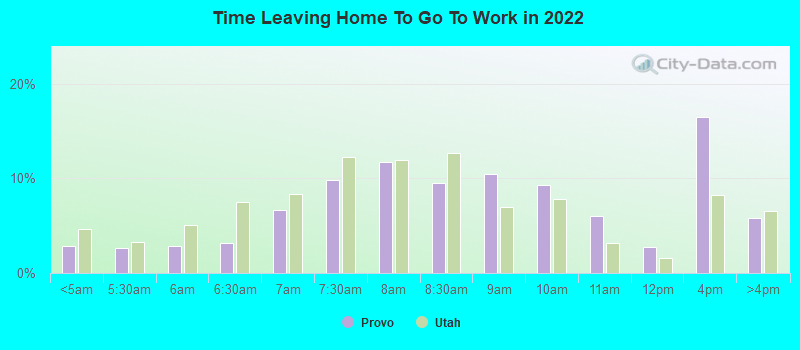
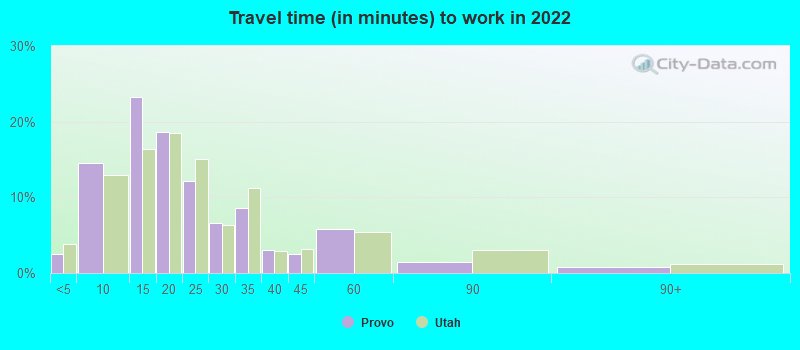
Travel time to work (commute)
Less than 5 minutes: 1,8495 to 9 minutes: 8,53810 to 14 minutes: 14,43515 to 19 minutes: 10,96020 to 24 minutes: 8,39625 to 29 minutes: 2,53730 to 34 minutes: 4,69335 to 39 minutes: 1,12340 to 44 minutes: 56445 to 59 minutes: 2,41260 to 89 minutes: 1,01090 or more minutes: 224
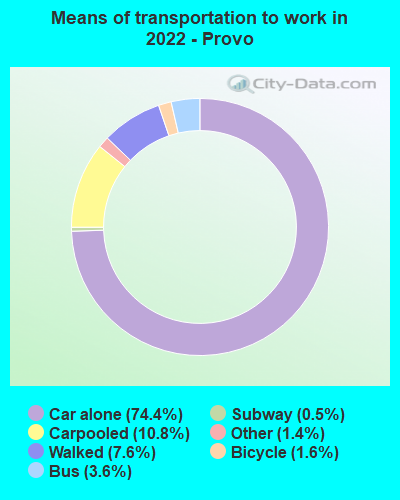
Means of transportation to work:
Drove a car alone: 48,354 (64.7%)Carpooled: 7,005 (9.4%)Bus : 2,371 (3.2%)Long-distance train or commuter rail : 335 (0.4%)Taxi: 918 (1.2%)Bicycle: 1,067 (1.4%)Walked: 4,935 (6.6%)Worked at home: 9,751 (13.0%)
Unemployment by race in 2022
Unemployment rate for White non-Hispanic residents 3.6% Males2.8% FemalesUnemployment rate for Black residents 1.3% FemalesUnemployment rate for Asian residents 2.0% Males1.7% FemalesUnemployment rate for other race residents 4.0% Males5.0% FemalesUnemployment rate for two or more race residents 6.3% Males2.2% FemalesUnemployment rate for Hispanic or Latino residents 7.6% Males2.1% Females
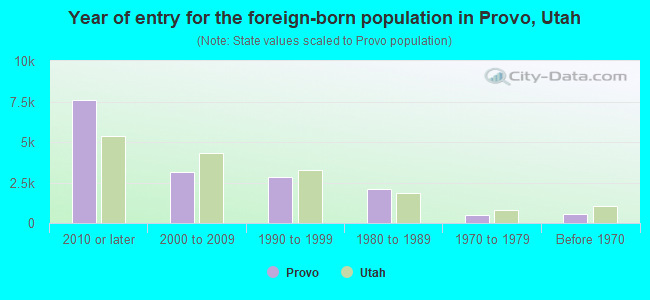
Year of entry for the foreign-born population in Provo, Utah
7,578 2010 or later 3,137 2000 to 2009 2,835 1990 to 1999 2,128 1980 to 1989 466 1970 to 1979 560 Before 1970
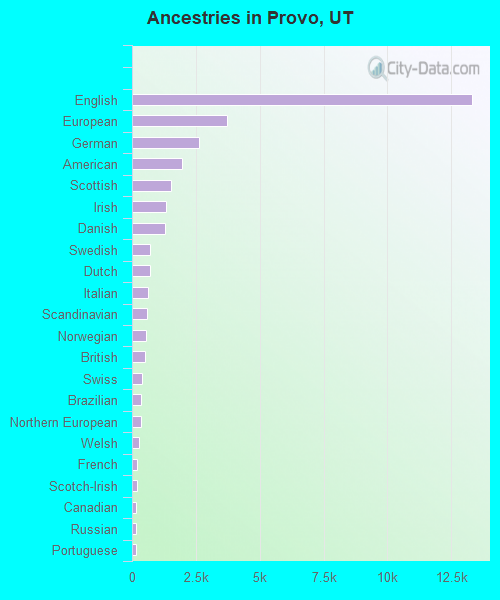
First ancestries reported:
English: 13,315 (25.2%)
European: 3,710 (7.0%)
German: 2,618 (5.0%)
American: 1,942 (3.7%)
Scottish: 1,517 (2.9%)
Irish: 1,330 (2.5%)
Danish: 1,289 (2.4%)
Swedish: 713 (1.3%)
Dutch: 694 (1.3%)
Italian: 612 (1.2%)
Scandinavian: 601 (1.1%)
Norwegian: 537 (1.0%)
British: 516 (1.0%)
Swiss: 408 (0.8%)
Brazilian: 347 (0.7%)
Northern European: 335 (0.6%)
Welsh: 274 (0.5%)
French: 190 (0.4%)
Scotch-Irish: 184 (0.3%)
Canadian: 166 (0.3%)
Russian: 158 (0.3%)
Portuguese: 150 (0.3%)
Polish: 112 (0.2%)
African: 108 (0.2%)
Ukrainian: 88 (0.2%)
Iranian: 87 (0.2%)
Palestinian: 68 (0.1%)
Eastern European: 51 (0.10%)
French Canadian: 48 (0.09%)
Kenyan: 43 (0.08%)
Jamaican: 40 (0.08%)
Haitian: 35 (0.07%)
Greek: 33 (0.06%)
Czech: 33 (0.06%)
Basque: 32 (0.06%)
Ghanaian: 26 (0.05%)
Nigerian: 22 (0.04%)
Australian: 21 (0.04%)
Israeli: 20 (0.04%)
Ethiopian: 18 (0.03%)
Austrian: 16 (0.03%)
Trinidadian and Tobagonian: 16 (0.03%)
Hungarian: 14 (0.03%)
Albanian: 14 (0.03%)
Slovak: 14 (0.03%)
Lebanese: 13 (0.02%)
Finnish: 12 (0.02%)
Serbian: 11 (0.02%)
Egyptian: 11 (0.02%)
Czechoslovakian: 6 (0.01%)
Romanian: 5 (0.01%)
Armenian: 4 (0.01%)
Most common places of birth for foreign-born residents (%): Mexico Provo:
34.1% (4,623)Utah:
36.1% (99,740)
Brazil Provo:
7.2% (978)Utah:
2.8% (7,644)
Peru Provo:
4.6% (628)Utah:
2.9% (7,901)
Chile Provo:
4.1% (560)Utah:
1.3% (3,479)
China, excluding Hong Kong and Taiwan Provo:
3.9% (526)Utah:
2.9% (8,017)
Canada Provo:
3.3% (453)Utah:
3.0% (8,341)
Korea Provo:
3.2% (438)Utah:
1.6% (4,524)
Oceania, n.e.c. Provo:
3.0% (402)Utah:
2.7% (7,472)
Argentina Provo:
2.8% (381)Utah:
1.3% (3,570)
Venezuela Provo:
2.8% (381)Utah:
3.2% (8,804)
Guatemala Provo:
2.5% (337)Utah:
2.1% (5,902)
Colombia Provo:
2.2% (301)Utah:
2.0% (5,555)
Place of birth for U.S.-born residents:
This state: 54,037Other state: 45,857Northeast: 2,353Midwest: 5,975South: 8,204West: 29,325 65.4% of Provo residents lived in the same house 1 years ago.
Out of people who lived in different houses, 37.2% lived in this county.
Out of people who lived in different counties, 34.6% lived in Utah.
Provo:
65.4%State average:
85.7%
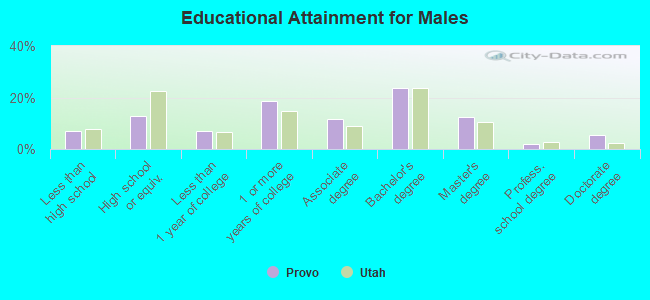
Education attainment for males 25 years and older:
No schooling: 333Nursery to 4th grade: 1275th and 6th grade: 1267th and 8th grade: 1439th grade: 010th grade: 23711th grade: 30712th grade, no diploma: 298High school graduate (or equivalency): 2,837Less than 1 year of college: 1,527Some college more than 1 year, no degree: 4,148Associate degree: 2,592Bachelor's degree: 5,314Master's degree: 2,765Professional school degree: 420Doctorate degree: 1,228
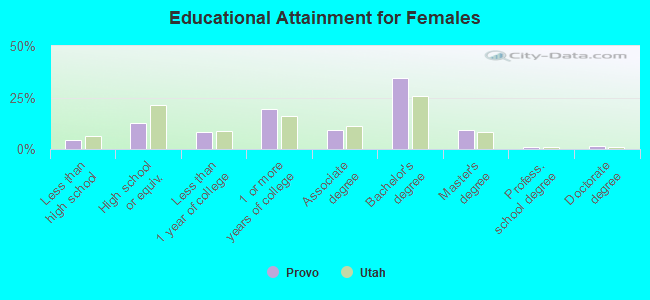
Education attainment for females 25 years and older:
No schooling: 164Nursery to 4th grade: 05th and 6th grade: 1657th and 8th grade: 1149th grade: 010th grade: 6511th grade: 10412th grade, no diploma: 408High school graduate (or equivalency): 2,762Less than 1 year of college: 1,840Some college more than 1 year, no degree: 4,309Associate degree: 2,096Bachelor's degree: 7,703Master's degree: 2,056Professional school degree: 244Doctorate degree: 278
Housing units in structures:
One, detached: 13,604One, attached: 3,461Two: 2,8633 or 4: 2,0895 to 9: 3,17610 to 19: 4,95120 to 49: 3,52250 or more: 2,226Mobile homes: 406Boats, RVs, vans, etc.: 42Median worth of mobile homes: $91,500
Housing units lacking complete kitchen facilities in 2022: 0.3%House/condo owner moved in on average 9 years ago
Renter moved in on average 0 years ago
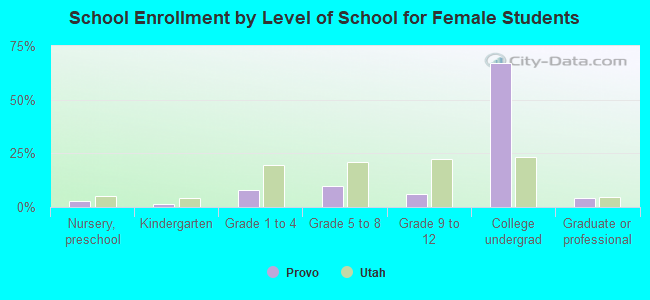
Private vs. public school enrollment:
Students in private schools in grades 1 to 8 (elementary and middle school): 318 Students in private schools in grades 9 to 12 (high school): 378 Students in private undergraduate colleges: 24,534