Housing density: 1,301 houses/condos per square mile
Median price asked for vacant for-sale houses and condos in 2022: $265,749.
Median contract rent in 2022: $1,475 (lower quartile is $1,188, upper quartile is $1,826)
Median rent asked for vacant for-rent units in 2022: $2,175
Median gross rent in Rancho Cordova, CA in 2022: $1,667
Housing units in Rancho Cordova with a mortgage: 12,256 (785 second mortgage, 27 home equity loan, 572 both second mortgage and home equity loan) Houses without a mortgage: 50
Median household income for houses/condos with a mortgage: $113,899
Median household income for apartments without a mortgage: $69,432
Median monthly housing costs: $1,727
Compare current foreclosures in Rancho Cordova, CA:
11,990 married couples with children.
5,484 single-parent households (1,008 men, 4,476 women).
62.3% of residents of Rancho Cordova speak English at home.
13.3% of residents speak Spanish at home (61% speak English very well, 15% speak English well, 19% speak English not well, 4% don't speak English at all).
13.5% of residents speak other Indo-European language at home (47% speak English very well, 27% speak English well, 21% speak English not well, 6% don't speak English at all).
9.8% of residents speak Asian or Pacific Island language at home (57% speak English very well, 23% speak English well, 17% speak English not well, 3% don't speak English at all).
1.6% of residents speak other language at home (66% speak English very well, 29% speak English well, 1% speak English not well, 3% don't speak English at all).
Foreign born population: 18,736 (23.2%)
(61.5% of them are naturalized citizens)
Percentage of workers working in this county: 86.8% Number of people working at home: 7,132 (19.2% of all workers)
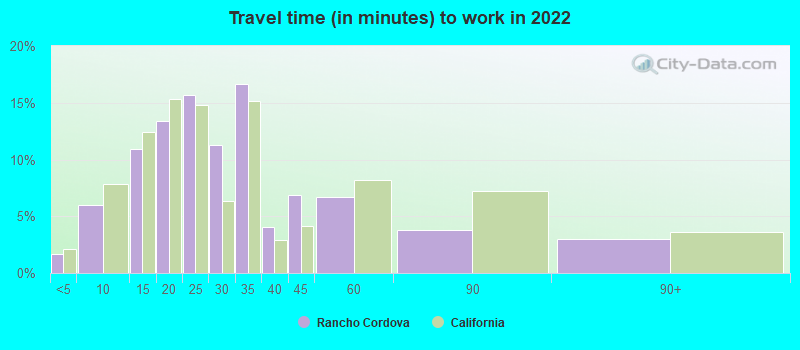
Travel time to work (commute)
Less than 5 minutes: 723
5 to 9 minutes: 2,207
10 to 14 minutes: 3,132
15 to 19 minutes: 4,753
20 to 24 minutes: 3,898
25 to 29 minutes: 3,148
30 to 34 minutes: 4,663
35 to 39 minutes: 1,123
40 to 44 minutes: 1,712
45 to 59 minutes: 1,825
60 to 89 minutes: 1,024
90 or more minutes: 905
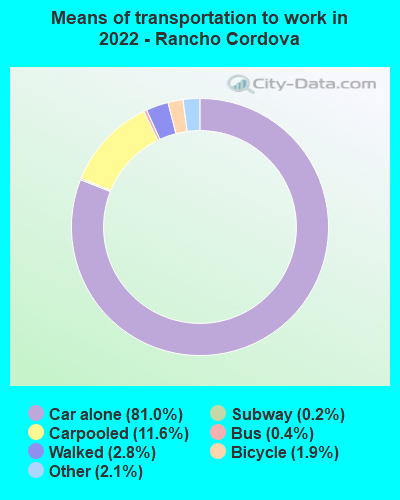
Means of transportation to work:
Drove a car alone: 30,118 (64.9%)
Carpooled: 4,306 (9.3%)
Bus: 160 (0.3%)
Long-distance train or commuter rail: 57 (0.1%)
Taxi: 767 (1.7%)
Bicycle: 715 (1.5%)
Walked: 1,056 (2.3%)
Worked at home: 9,251 (19.9%)
Unemployment by race in 2022
Unemployment rate for White non-Hispanic residents
4.7%Males
6.6%Females
Unemployment rate for Black residents
9.1%Males
2.6%Females
Unemployment rate for American Indian and Alaska Native residents
4.7%Females
Unemployment rate for Asian residents
3.4%Males
9.2%Females
Unemployment rate for other race residents
0.5%Males
7.3%Females
Unemployment rate for two or more race residents
3.3%Males
5.8%Females
Unemployment rate for Hispanic or Latino residents
2.0%Males
4.4%Females
Year of entry for the foreign-born population in Rancho Cordova, California
5,7232010 or later
5,7722000 to 2009
4,1791990 to 1999
1,9791980 to 1989
8141970 to 1979
909Before 1970
First ancestries reported:
American: 3,386 (7.8%)
Ukrainian: 2,258 (5.2%)
Armenian: 1,906 (4.4%)
English: 1,489 (3.4%)
German: 1,363 (3.2%)
Russian: 1,002 (2.3%)
European: 929 (2.2%)
Irish: 856 (2.0%)
Italian: 800 (1.9%)
African: 545 (1.3%)
French: 507 (1.2%)
Romanian: 473 (1.1%)
Afghan: 422 (1.0%)
Norwegian: 290 (0.7%)
Portuguese: 201 (0.5%)
Polish: 189 (0.4%)
Eastern European: 175 (0.4%)
Egyptian: 146 (0.3%)
Iranian: 118 (0.3%)
Liberian: 116 (0.3%)
Scottish: 116 (0.3%)
Bulgarian: 113 (0.3%)
Ethiopian: 110 (0.3%)
Nigerian: 91 (0.2%)
Swedish: 86 (0.2%)
Dutch: 81 (0.2%)
Swiss: 76 (0.2%)
Northern European: 67 (0.2%)
Basque: 63 (0.1%)
Hungarian: 62 (0.1%)
Brazilian: 60 (0.1%)
Macedonian: 53 (0.1%)
Canadian: 52 (0.1%)
Danish: 50 (0.1%)
Ghanaian: 45 (0.1%)
Turkish: 42 (0.10%)
Maltese: 41 (0.09%)
Lebanese: 39 (0.09%)
Arab: 38 (0.09%)
Sudanese: 38 (0.09%)
Kenyan: 33 (0.08%)
Czech: 32 (0.07%)
French Canadian: 29 (0.07%)
Welsh: 29 (0.07%)
Greek: 28 (0.06%)
British: 25 (0.06%)
Cape Verdean: 25 (0.06%)
Syrian: 22 (0.05%)
West Indian: 22 (0.05%)
Scotch-Irish: 19 (0.04%)
Jamaican: 18 (0.04%)
Finnish: 17 (0.04%)
Slovak: 17 (0.04%)
Haitian: 15 (0.03%)
Luxembourger: 10 (0.02%)
Scandinavian: 9 (0.02%)
Israeli: 8 (0.02%)
Belizean: 8 (0.02%)
Czechoslovakian: 6 (0.01%)
Croatian: 6 (0.01%)
Palestinian: 5 (0.01%)
Austrian: 5 (0.01%)
Belgian: 4 (0.01%)
Most common places of birth for foreign-born residents (%):
Mexico
Rancho Cordova:
16.6% (3,211)
California:
37.2% (3,881,193)
Philippines
Rancho Cordova:
10.2% (1,965)
California:
7.8% (818,297)
India
Rancho Cordova:
9.3% (1,799)
California:
5.2% (539,184)
Armenia
Rancho Cordova:
7.9% (1,532)
California:
0.8% (78,847)
Ukraine
Rancho Cordova:
7.0% (1,354)
California:
0.6% (60,761)
Moldova
Rancho Cordova:
6.2% (1,190)
California:
0.1% (10,171)
Vietnam
Rancho Cordova:
5.4% (1,039)
California:
4.9% (512,335)
Afghanistan
Rancho Cordova:
3.9% (746)
California:
0.5% (53,260)
Korea
Rancho Cordova:
2.7% (517)
California:
3.0% (315,248)
Russia
Rancho Cordova:
2.6% (510)
California:
0.7% (71,932)
El Salvador
Rancho Cordova:
2.2% (421)
California:
4.2% (440,287)
China, excluding Hong Kong and Taiwan
Rancho Cordova:
1.6% (313)
California:
6.6% (684,672)
Egypt
Rancho Cordova:
1.5% (294)
California:
0.4% (42,718)
Place of birth for U.S.-born residents:
This state: 47,711
Other state: 12,700
Northeast: 1,447
Midwest: 4,651
South: 3,433
West: 3,169
88.1% of Rancho Cordova residents lived in the same house 1 years ago. Out of people who lived in different houses, 41.4% lived in this county. Out of people who lived in different counties, 84.1% lived in California.
Rancho Cordova:
88.1%
State average:
88.9%
Education attainment for males 25 years and older:
No schooling: 318
Nursery to 4th grade: 159
5th and 6th grade: 90
7th and 8th grade: 116
9th grade: 0
10th grade: 280
11th grade: 227
12th grade, no diploma: 679
High school graduate (or equivalency): 7,033
Less than 1 year of college: 1,831
Some college more than 1 year, no degree: 4,397
Associate degree: 2,617
Bachelor's degree: 5,582
Master's degree: 2,104
Professional school degree: 436
Doctorate degree: 234
Education attainment for females 25 years and older:
No schooling: 337
Nursery to 4th grade: 206
5th and 6th grade: 89
7th and 8th grade: 106
9th grade: 0
10th grade: 197
11th grade: 187
12th grade, no diploma: 847
High school graduate (or equivalency): 6,430
Less than 1 year of college: 1,879
Some college more than 1 year, no degree: 5,339
Associate degree: 3,052
Bachelor's degree: 6,813
Master's degree: 2,292
Professional school degree: 329
Doctorate degree: 143
Housing units in structures:
One, detached: 17,813
One, attached: 2,607
Two: 527
3 or 4: 1,201
5 to 9: 1,642
10 to 19: 334
20 to 49: 739
50 or more: 2,681
Mobile homes: 1,755
Median worth of mobile homes: $74,413
Housing units lacking complete plumbing facilities in 2022: 1.4%
Housing units lacking complete kitchen facilities in 2022: 1.6%