Rosemead, CA (California) Houses and Residents
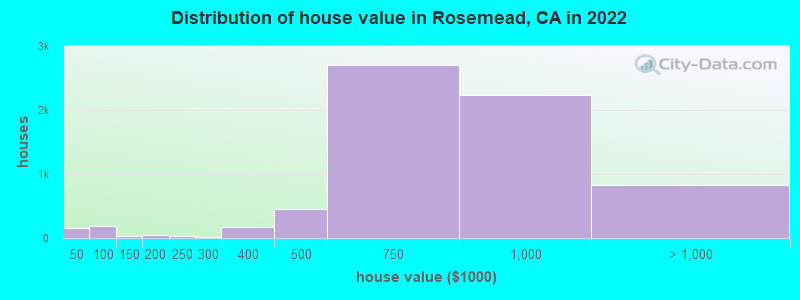
Estimated median house or condo value in 2022: $752,788 (it was $179,900 in 2000 )
Rosemead:
$752,788California:
$715,900
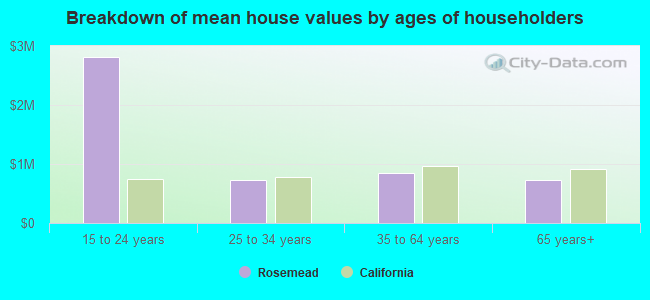
Lower value quartile - upper value quartile: $582,746 - $953,391Mean price in 2022: Detached houses: $856,122 Here:
$856,122State:
$988,808
Townhouses or other attached units: $588,278 Here:
$588,278State:
$838,546
In 2-unit structures: $555,034 Here:
$555,034State:
$1,138,100
In 3-to-4-unit structures: $510,227 Here:
$510,227State:
$824,253
In 5-or-more-unit structures: $501,471 Here:
$501,471State:
$730,996
Mobile homes: $238,939 Here:
$238,939State:
$184,506
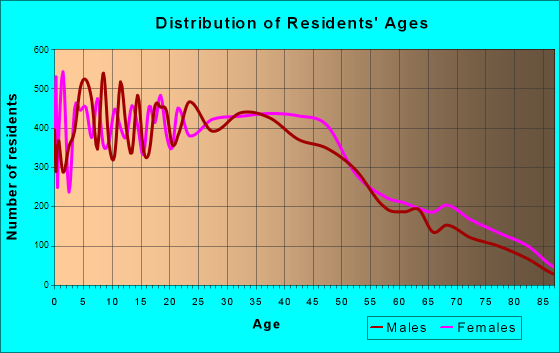
Total population: 54,947 (Urban population: 53,280, Rural population: 0)
Houses: 15,176 (14,256 occupied: 7,055 owner occupied, 7,255 renter occupied )
% of renters here:
51%State:
44%
Housing density: 2,949 houses/condos per square mile
Median price asked for vacant for-sale houses and condos in 2022: $626,424.
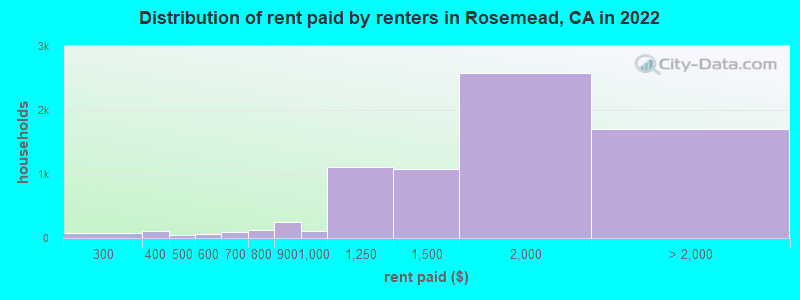
Median contract rent in 2022: $1,570 (lower quartile is $1,185, upper quartile is $1,917)
Median rent asked for vacant for-rent units in 2022: $1,715
Median gross rent in Rosemead, CA in 2022: $1,659
Housing units in Rosemead with a mortgage: 3,628 (268 second mortgage, 6 home equity loan, 180 both second mortgage and home equity loan )Houses without a mortgage: 56
Median household income for houses/condos with a mortgage: $112,723
Median household income for apartments without a mortgage: $68,818
Median monthly housing costs: $1,581
Data:
Median house or condo value ($)
Median house or condo value ($ change since 2000)
Median house or condo value ($) - White
Median house or condo value ($) - Black or African American
Median house or condo value ($) - Asian
Median house or condo value ($) - Hispanic or Latino
Median house or condo value ($) - American Indian and Alaska Native
Median house or condo value ($) - Multirace
Median house or condo value ($) - Other Race
Median price asked for mobile homes ($)
Household density (households per square mile)
Mean house or condo value by units in structure - 1, detached ($)
Mean house or condo value by units in structure - 1, attached ($)
Mean house or condo value by units in structure - 2 ($)
Mean house or condo value by units in structure by units in structure - 3 or 4 ($)
Mean house or condo value by units in structure - 5 or more ($)
Mean house or condo value by units in structure - Boat, RV, van, etc. ($)
Mean house or condo value by units in structure - Mobile home ($)
Median contract rent ($)
Median contract rent - Lower quartile ($)
Median contract rent - Upper quartile ($)
Median gross rent ($)
Urban houses (%)
Rural houses (%)
Houses occupied (%)
Houses occupied (% change since 2000)
Houses owner occupied (%)
Houses owner occupied (% change since 2000)
Houses renter occupied (%)
Houses renter occupied (% change since 2000)
Vacant housing units - For rent (%)
Vacant housing units - For rent (% change since 2000)
Vacant housing units - For sale only (%)
Vacant housing units - For sale only (% change since 2000)
Vacant housing units - Rented or sold, not occupied (%)
Vacant housing units - Rented or sold, not occupied (% change since 2000)
Vacant housing units - For seasonal, recreational, or occasional use (%)
Vacant housing units - For seasonal, recreational, or occasional use (% change since 2000)
Vacant housing units - For migrant workers (%)
Vacant housing units - For migrant workers (% change since 2000)
Vacant housing units - Other vacant (%)
Vacant housing units - Other vacant (% change since 2000)
Median monthly housing costs ($)
Median household income for houses/condos with a mortgage ($)
Median household income for houses/condos without a mortgage ($)
Median household income ($)
Median household income ($) - White
Median household income ($) - Black or African American
Median household income ($) - Asian
Median household income ($) - Hispanic or Latino
Median household income ($) - American Indian and Alaska Native
Median household income ($) - Multirace
Median household income ($) - Other Race
Mortgage status - with mortgage (%)
Mortgage status - with second mortgage (%)
Mortgage status - with home equity loan (%)
Mortgage status - with both second mortgage and home equity loan (%)
Mortgage status - without a mortgage (%)
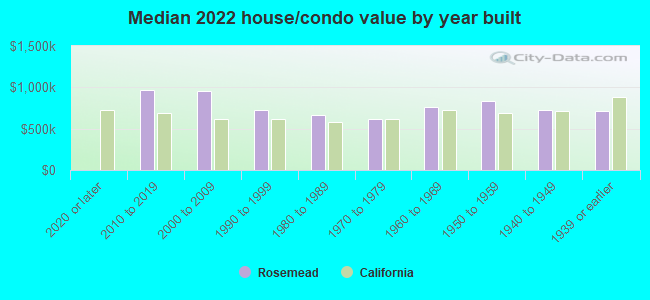
Median year house/condo built
Median year apartment built
Household type by relationship - Male householder living alone (%)
Household type by relationship - Male householder not living alone (%)
Household type by relationship - Female householder living alone (%)
Household type by relationship - Female householder not living alone (%)
Household type by relationship - Opposite-Sex spouse (%)
Household type by relationship - Same-Sex spouse (%)
Household type by relationship - Opposite-Sex unmarried partner (%)
Household type by relationship - Same-Sex unmarried partner (%)
Household type by relationship - In group quarters (%)
Size of family households - 2-person household (%)
Size of family households - 3-person household (%)
Size of family households - 4-person household (%)
Size of family households - 5-person household (%)
Size of family households - 6-person household (%)
Size of family households - 7-or-more-person household (%)
Size of nonfamily households - 1-person household (%)
Size of nonfamily households - 2-person household (%)
Size of nonfamily households - 3-person household (%)
Size of nonfamily households - 4-person household (%)
Size of nonfamily households - 5-person household (%)
Size of nonfamily households - 6-person household (%)
Size of nonfamily households - 7-or-moreperson household (%)
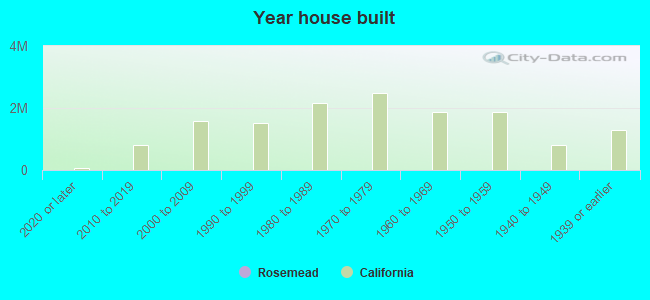
Year house built - Built 2010 or later (%)
Year house built - Built 2000 to 2009 (%)
Year house built - Built 1990 to 1999 (%)
Year house built - Built 1980 to 1989 (%)
Year house built - Built 1970 to 1979 (%)
Year house built - Built 1960 to 1969 (%)
Year house built - Built 1950 to 1959 (%)
Year house built - Built 1940 to 1949 (%)
Year house built - Built 1939 or earlier (%)
Median number of rooms in houses and condos
Median number of rooms in apartments
Median number of bedrooms in owner occupied houses
Mean number of bedrooms in owner occupied houses
Median number of bedrooms in renter occupied houses
Mean number of bedrooms in renter occupied houses
Median number of vehichles in owner occupied houses
Mean number of vehichles in owner occupied houses
Median number of vehichles in renter occupied houses
Mean number of vehichles in renter occupied houses
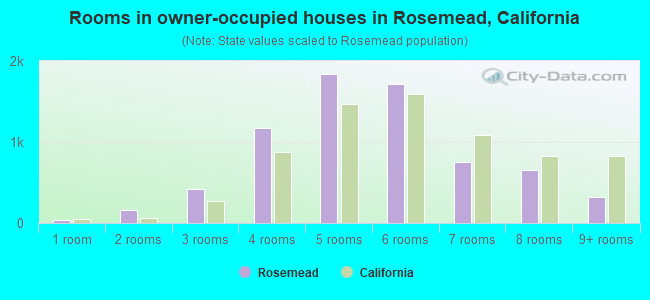
Rooms in owner-occupied houses - 1 room (%)
Rooms in owner-occupied houses - 2 rooms (%)
Rooms in owner-occupied houses - 3 rooms (%)
Rooms in owner-occupied houses - 4 rooms (%)
Rooms in owner-occupied houses - 5 rooms (%)
Rooms in owner-occupied houses - 6 rooms (%)
Rooms in owner-occupied houses - 7 rooms (%)
Rooms in owner-occupied houses - 8 rooms (%)
Rooms in owner-occupied houses - 9+ rooms (%)
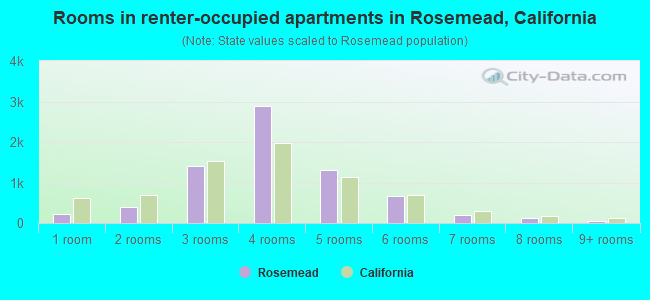
Rooms in renter-occupied houses - 1 room (%)
Rooms in renter-occupied houses - 2 rooms (%)
Rooms in renter-occupied houses - 3 rooms (%)
Rooms in renter-occupied houses - 4 rooms (%)
Rooms in renter-occupied houses - 5 rooms (%)
Rooms in renter-occupied houses - 6 rooms (%)
Rooms in renter-occupied houses - 7 rooms (%)
Rooms in renter-occupied houses - 8 rooms (%)
Rooms in renter-occupied houses - 9+ rooms (%)
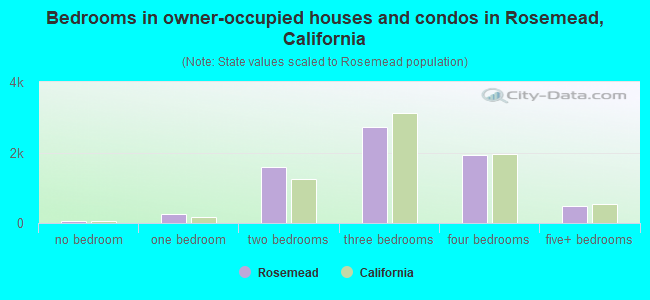
Bedrooms in owner-occupied houses - no bedrooms (%)
Bedrooms in owner-occupied houses - 1 bedroom (%)
Bedrooms in owner-occupied houses - 2 bedrooms (%)
Bedrooms in owner-occupied houses - 3 bedrooms (%)
Bedrooms in owner-occupied houses - 4 bedrooms (%)
Bedrooms in owner-occupied houses - 5+ bedrooms (%)
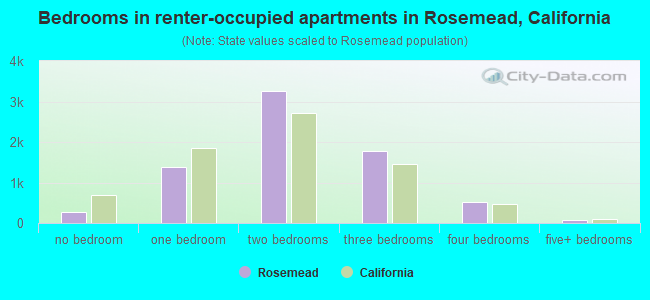
Bedrooms in renter-occupied houses - no bedrooms (%)
Bedrooms in renter-occupied houses - 1 bedroom (%)
Bedrooms in renter-occupied houses - 2 bedrooms (%)
Bedrooms in renter-occupied houses - 3 bedrooms (%)
Bedrooms in renter-occupied houses - 4 bedrooms (%)
Bedrooms in renter-occupied houses - 5+ bedrooms (%)
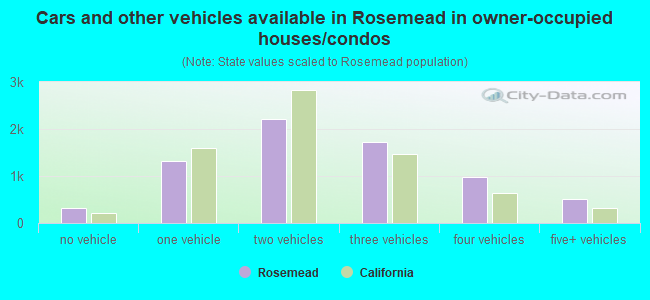
Vehicles available in owner-occupied houses - no vehicle available (%)
Vehicles available in owner-occupied houses - 1 vehicle available(%)
Vehicles available in owner-occupied houses - 2 Vehicles available (%)
Vehicles available in owner-occupied houses - 3 Vehicles available (%)
Vehicles available in owner-occupied houses - 4 Vehicles available (%)
Vehicles available in owner-occupied houses - 5+ Vehicles available (%)
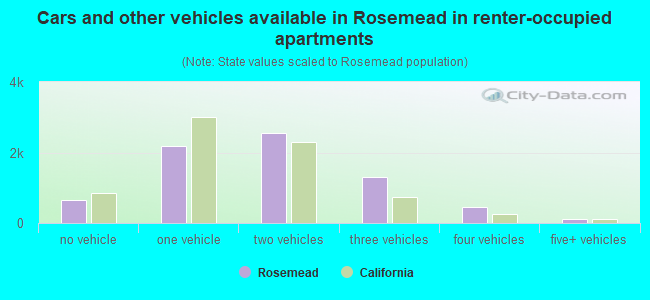
Vehicles available in renter-occupied houses - no vehicle available (%)
Vehicles available in renter-occupied houses - 1 vehicle available (%)
Vehicles available in renter-occupied houses - 2 Vehicles available (%)
Vehicles available in renter-occupied houses - 3 Vehicles available (%)
Vehicles available in renter-occupied houses - 4 Vehicles available (%)
Vehicles available in renter-occupied houses - 5+ Vehicles available (%)
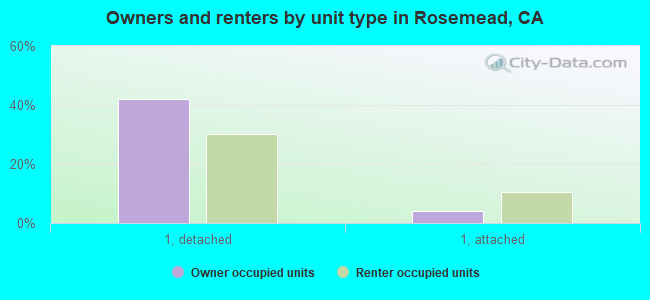
Housing units in structures - 1, detached (%)
Housing units in structures - 1, attached (%)
Housing units in structures - 2 (%)
Housing units in structures - 3 or 4 (%)
Housing units in structures - 5 to 9 (%)
Housing units in structures - 10 to 19 (%)
Housing units in structures - 20 to 49 (%)
Housing units in structures - 50 or more (%)
Housing units in structures - Mobile home (%)
Housing units in structures - Boat, RV, van, etc. (%)
Housing units in structures - Owners - 1, detached (%)
Housing units in structures - Owners - 1, attached (%)
Housing units in structures - Owners - 2 (%)
Housing units in structures - Owners - 3 or 4 (%)
Housing units in structures - Owners - 5 to 9 (%)
Housing units in structures - Owners - 10 to 19 (%)
Housing units in structures - Owners - 20 to 49 (%)
Housing units in structures - Owners - 50 or more (%)
Housing units in structures - Owners - Mobile home (%)
Housing units in structures - Owners - Boat, RV, van, etc. (%)
Housing units in structures - Renters - 1, detached (%)
Housing units in structures - Renters - 1, attached (%)
Housing units in structures - Renters - 2 (%)
Housing units in structures - Renters - 3 or 4 (%)
Housing units in structures - Renters - 5 to 9 (%)
Housing units in structures - Renters - 10 to 19 (%)
Housing units in structures - Renters - 20 to 49 (%)
Housing units in structures - Renters - 50 or more (%)
Housing units in structures - Renters - Mobile home (%)
Housing units in structures - Renters - Boat, RV, van, etc. (%)
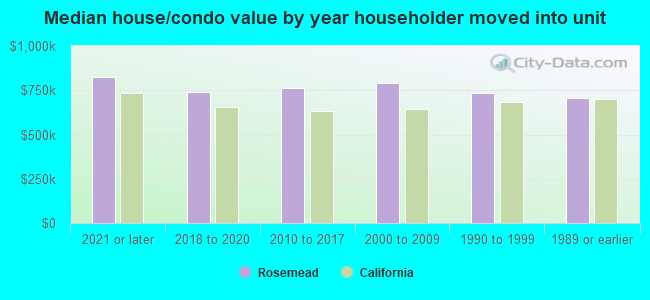
House/condo owner moved in on average (years ago)
Renter moved in on average (years ago)
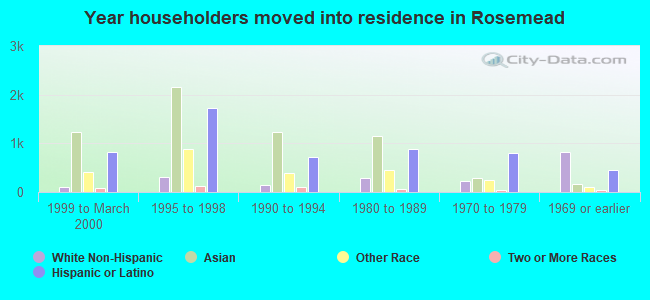
Year householder moved into unit - Moved in 1999 to March 2000 (%)
Year householder moved into unit - Moved in 1999 to March 2000 (%) - White
Year householder moved into unit - Moved in 1999 to March 2000 (%) - Black or African American
Year householder moved into unit - Moved in 1999 to March 2000 (%) - Asian
Year householder moved into unit - Moved in 1999 to March 2000 (%) - Hispanic or Latino
Year householder moved into unit - Moved in 1999 to March 2000 (%) - American Indian and Alaska Native
Year householder moved into unit - Moved in 1999 to March 2000 (%) - Multirace
Year householder moved into unit - Moved in 1999 to March 2000 (%) - Other Race
Year householder moved into unit - Moved in 1995 to 1998 (%)
Year householder moved into unit - Moved in 1995 to 1998 (%) - White
Year householder moved into unit - Moved in 1995 to 1998 (%) - Black or African American
Year householder moved into unit - Moved in 1995 to 1998 (%) - Asian
Year householder moved into unit - Moved in 1995 to 1998 (%) - Hispanic or Latino
Year householder moved into unit - Moved in 1995 to 1998 (%) - American Indian and Alaska Native
Year householder moved into unit - Moved in 1995 to 1998 (%) - Multirace
Year householder moved into unit - Moved in 1995 to 1998 (%) - Other Race
Year householder moved into unit - Moved in 1990 to 1994 (%)
Year householder moved into unit - Moved in 1990 to 1994 (%) - White
Year householder moved into unit - Moved in 1990 to 1994 (%) - Black or African American
Year householder moved into unit - Moved in 1990 to 1994 (%) - Asian
Year householder moved into unit - Moved in 1990 to 1994 (%) - Hispanic or Latino
Year householder moved into unit - Moved in 1990 to 1994 (%) - American Indian and Alaska Native
Year householder moved into unit - Moved in 1990 to 1994 (%) - Multirace
Year householder moved into unit - Moved in 1990 to 1994 (%) - Other Race
Year householder moved into unit - Moved in 1980 to 1989 (%)
Year householder moved into unit - Moved in 1980 to 1989 (%) - White
Year householder moved into unit - Moved in 1980 to 1989 (%) - Black or African American
Year householder moved into unit - Moved in 1980 to 1989 (%) - Asian
Year householder moved into unit - Moved in 1980 to 1989 (%) - Hispanic or Latino
Year householder moved into unit - Moved in 1980 to 1989 (%) - American Indian and Alaska Native
Year householder moved into unit - Moved in 1980 to 1989 (%) - Multirace
Year householder moved into unit - Moved in 1980 to 1989 (%) - Other Race
Year householder moved into unit - Moved in 1970 to 1979 (%)
Year householder moved into unit - Moved in 1970 to 1979 (%) - White
Year householder moved into unit - Moved in 1970 to 1979 (%) - Black or African American
Year householder moved into unit - Moved in 1970 to 1979 (%) - Asian
Year householder moved into unit - Moved in 1970 to 1979 (%) - Hispanic or Latino
Year householder moved into unit - Moved in 1970 to 1979 (%) - American Indian and Alaska Native
Year householder moved into unit - Moved in 1970 to 1979 (%) - Multirace
Year householder moved into unit - Moved in 1970 to 1979 (%) - Other Race
Year householder moved into unit - Moved in 1969 or earlier (%)
Year householder moved into unit - Moved in 1969 or earlier (%) - White
Year householder moved into unit - Moved in 1969 or earlier (%) - Black or African American
Year householder moved into unit - Moved in 1969 or earlier (%) - Asian
Year householder moved into unit - Moved in 1969 or earlier (%) - Hispanic or Latino
Year householder moved into unit - Moved in 1969 or earlier (%) - American Indian and Alaska Native
Year householder moved into unit - Moved in 1969 or earlier (%) - Multirace
Year householder moved into unit - Moved in 1969 or earlier (%) - Other Race
Housing units lacking complete plumbing facilities (%)
Housing units lacking complete kitchen facilities (%)
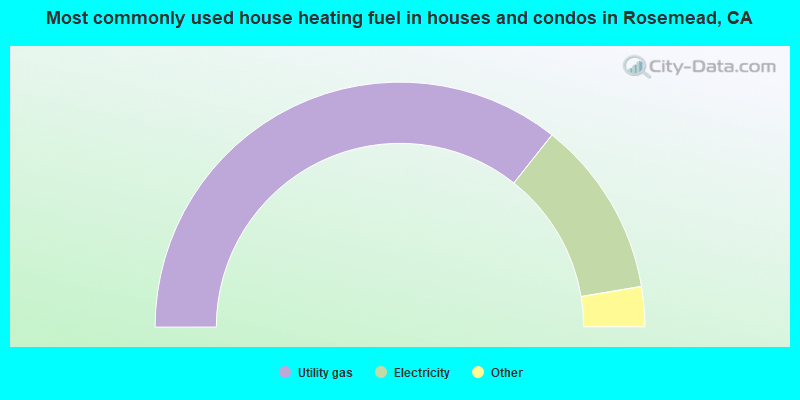
House heating fuel used in houses and condos - Utility gas (%)
House heating fuel used in houses and condos - Bottled, tank, or LP gas (%)
House heating fuel used in houses and condos - Electricity (%)
House heating fuel used in houses and condos - Fuel oil, kerosene, etc. (%)
House heating fuel used in houses and condos - Coal or coke (%)
House heating fuel used in houses and condos - Wood (%)
House heating fuel used in houses and condos - Solar energy (%)
House heating fuel used in houses and condos - Other fuel (%)
House heating fuel used in houses and condos - No fuel used (%)
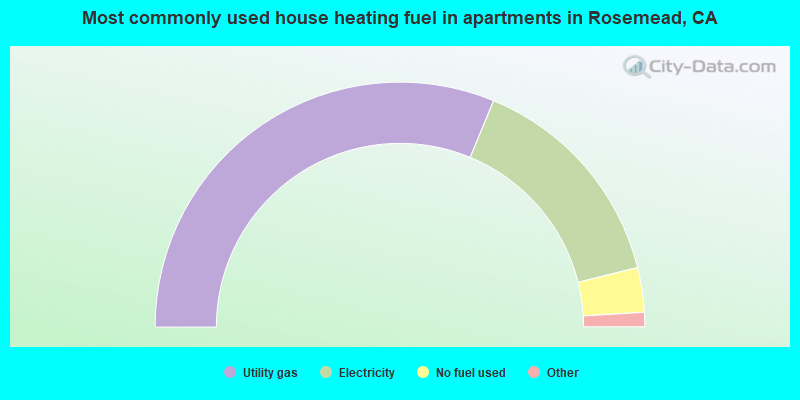
House heating fuel used in apartments - Utility gas (%)
House heating fuel used in apartments - Bottled, tank, or LP gas (%)
House heating fuel used in apartments - Electricity (%)
House heating fuel used in apartments - Fuel oil, kerosene, etc. (%)
House heating fuel used in apartments - Coal or coke (%)
House heating fuel used in apartments - Wood (%)
House heating fuel used in apartments - Solar energy (%)
House heating fuel used in apartments - Other fuel (%)
House heating fuel used in apartments - No fuel used (%)
Latest news about housing in Rosemead, CA collected exclusively by city-data.com from local newspapers, TV, and radio stations
Good Indian Community area, apartments ,good Preschools and public transport like bus in or nearby Rosemead,CA (27 replies)Good Indian Community area, apartments ,good Preschools and public transport like bus in or nearby Rosemead,CA location. (1 reply)Need suggestions for apartments in Covina West, Montebello, Arcadia (0 replies)Can Anyone Recommend Any Good Boarding/Room Houses, Hostels, or other CHEAP (but comparatively okay) Short Term Housing? (8 replies)Can we afford a house and which neighborhood? (19 replies)Moving to LA - Will I be able to afford a house? (15 replies)
Median year house/condo built: 1956Median year apartment built: 1962Household type by relationship:
Households: 49,935
Male householders: 7,591 (681 living alone ), Female householders: 6,193 (1,258 living alone )7,552 spouses (7,478 opposite-sex spouses ), 509 unmarried partners , (481 opposite-sex unmarried partners ), 14,762 children (14,430 natural , 145 adopted , 186 stepchildren ), 1,082 grandchildren , 2,020 brothers or sisters , 4,349 parents , 4 foster children , 2,929 other relatives , 2,346 non-relatives In group quarters: 591
Size of family households: 2,718 2-persons , 2,742 3-persons , 2,745 4-persons , 1,942 5-persons , 795 6-persons , 487 7-or-more-persons .
Size of nonfamily households: 2,080 1-person , 312 2-persons , 97 3-persons , 166 4-persons , 28 5-persons , 9 7-or-more-persons .
5,420 married couples with children. single-parent households (339 men , 1,372 women ).
19.6% of residents of Rosemead speak English at home. of residents speak Spanish at home (65% speak English very well , 13% speak English well , 18% speak English not well , 4% don't speak English at all ).of residents speak other Indo-European language at home (85% speak English very well , 7% speak English well , 8% speak English not well ).of residents speak Asian or Pacific Island language at home (29% speak English very well , 22% speak English well , 32% speak English not well , 17% don't speak English at all ).of residents speak other language at home (83% speak English very well , 17% speak English well ).
Foreign born population: 27,874 (55.8%)of them are naturalized citizens )
Median number of rooms in houses and condos:
Median number of rooms in apartments
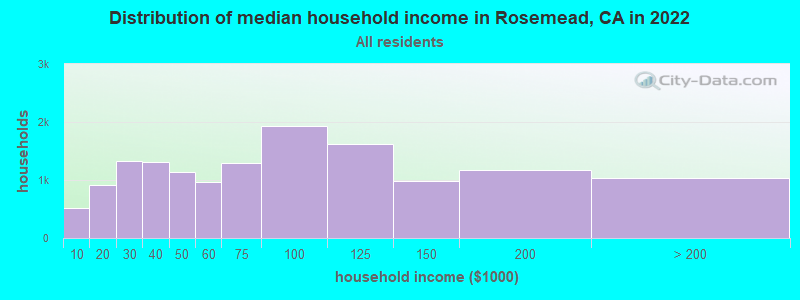
Rosemead, CA household income distribution 521 Less than $10,000922 $10,000 to $19,9991,327 $20,000 to $29,9991,304 $30,000 to $39,9991,142 $40,000 to $49,999973 $50,000 to $59,9991,291 $60,000 to $74,9991,938 $75,000 to $99,9991,626 $100,000 to $124,999986 $125,000 to $149,9991,176 $150,000 to $199,9991,043 $200,000 or more
Home value of owner - occupied houses in 2022 in Rosemead, CA 86 Less than $10,00011 $30,000 to $34,99965 $40,000 to $49,99930 $50,000 to $59,99923 $60,000 to $69,9996 $70,000 to $79,99932 $80,000 to $89,99923 $90,000 to $99,99930 $100,000 to $124,99931 $150,000 to $174,99915 $175,000 to $199,99933 $200,000 to $249,99910 $250,000 to $299,999170 $300,000 to $399,999448 $400,000 to $499,9992,702 $500,000 to $749,9992,228 $750,000 to $999,999672 $1,000,000 to $1,499,99951 $1,500,000 to $1,999,999105 $2,000,000 or moreRent paid by renters in 2022 in Rosemead, CA 18 Less than $10014 $100 to $14960 $200 to $24919 $250 to $29989 $300 to $34915 $350 to $39953 $450 to $49958 $500 to $5496 $550 to $59963 $600 to $64935 $650 to $69961 $700 to $74966 $750 to $799253 $800 to $899102 $900 to $9991,115 $1,000 to $1,2491,071 $1,250 to $1,4992,583 $1,500 to $1,999750 $2,000 to $2,499463 $2,500 to $2,99970 $3,000 to $3,49920 $3,500 or more398 No cash rent
Percentage of workers working in this county: 94.9%Number of people working at home: 2,232 (9.6% of all workers )
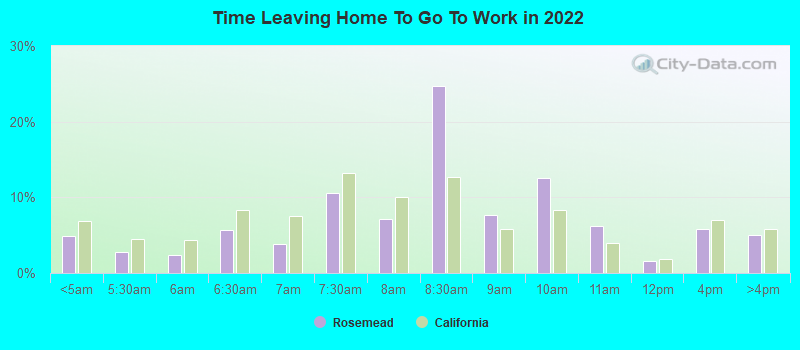
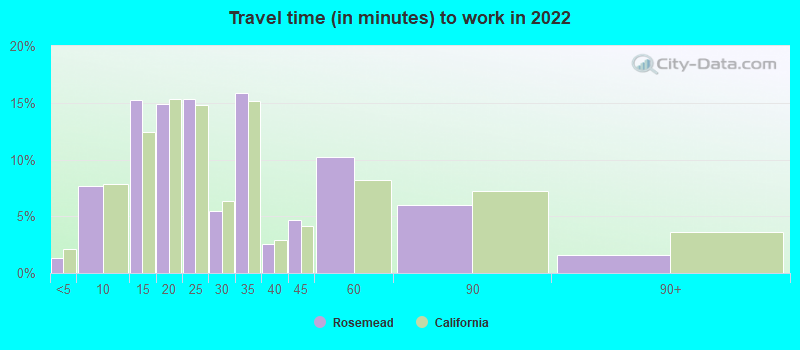
Travel time to work (commute)
Less than 5 minutes: 1135 to 9 minutes: 1,24510 to 14 minutes: 3,23315 to 19 minutes: 2,54020 to 24 minutes: 3,29225 to 29 minutes: 1,27730 to 34 minutes: 3,85035 to 39 minutes: 60740 to 44 minutes: 99445 to 59 minutes: 1,40260 to 89 minutes: 1,44190 or more minutes: 623
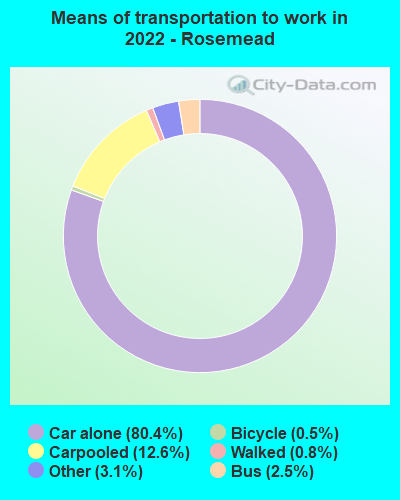
Means of transportation to work:
Drove a car alone: 11,870 (68.6%)Carpooled: 2,063 (11.9%)Bus : 334 (1.9%)Taxi: 505 (2.9%)Bicycle: 79 (0.5%)Walked: 134 (0.8%)Worked at home: 2,232 (12.9%)
Unemployment by race in 2022
Unemployment rate for White non-Hispanic residents 4.6% Males4.2% FemalesUnemployment rate for Black residents 25.0% MalesUnemployment rate for Asian residents 4.8% Males3.7% FemalesUnemployment rate for other race residents 1.9% Males1.5% FemalesUnemployment rate for two or more race residents 5.7% Males9.2% FemalesUnemployment rate for Hispanic or Latino residents 2.4% Males2.3% Females
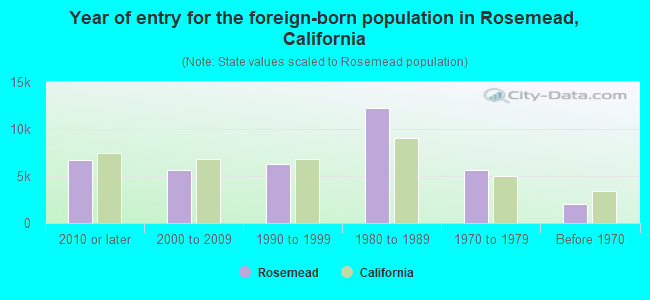
Year of entry for the foreign-born population in Rosemead, California
6,724 2010 or later 5,604 2000 to 2009 6,288 1990 to 1999 12,245 1980 to 1989 5,662 1970 to 1979 2,066 Before 1970
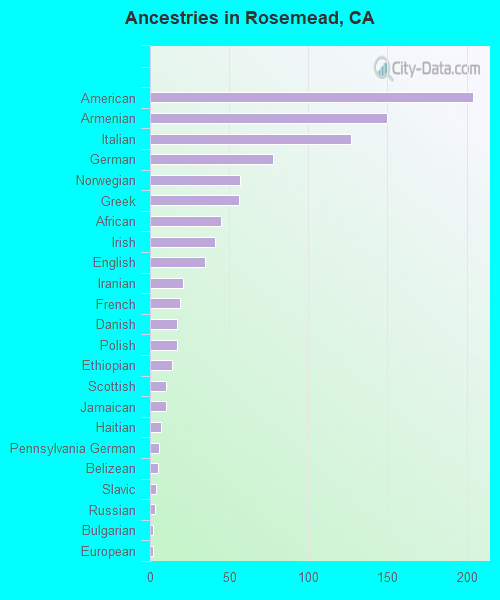
First ancestries reported:
American: 204 (0.5%)
Armenian: 150 (0.4%)
Italian: 127 (0.3%)
German: 78 (0.2%)
Norwegian: 57 (0.2%)
Greek: 56 (0.1%)
African: 45 (0.1%)
Irish: 41 (0.1%)
English: 35 (0.09%)
Iranian: 21 (0.06%)
French: 19 (0.05%)
Danish: 17 (0.04%)
Polish: 17 (0.04%)
Ethiopian: 14 (0.04%)
Scottish: 10 (0.03%)
Jamaican: 10 (0.03%)
Haitian: 7 (0.02%)
Pennsylvania German: 6 (0.02%)
Belizean: 5 (0.01%)
Slavic: 4 (0.01%)
Russian: 3 (0.01%)
Bulgarian: 2 (0.01%)
European: 2 (0.01%) Most common places of birth for foreign-born residents (%): Vietnam Rosemead:
35.6% (9,936)California:
4.9% (512,335)
China, excluding Hong Kong and Taiwan Rosemead:
28.8% (8,040)California:
6.6% (684,672)
Mexico Rosemead:
16.2% (4,519)California:
37.2% (3,881,193)
Hong Kong Rosemead:
3.2% (905)California:
1.0% (105,215)
Burma (Myanmar) Rosemead:
3.0% (848)California:
0.3% (28,176)
Taiwan Rosemead:
2.8% (773)California:
1.7% (176,274)
Philippines Rosemead:
2.8% (767)California:
7.8% (818,297)
Cambodia Rosemead:
2.2% (610)California:
0.5% (51,974)
Place of birth for U.S.-born residents:
This state: 20,075Other state: 1,553Northeast: 302Midwest: 281South: 664West: 301 95.3% of Rosemead residents lived in the same house 1 years ago.
Out of people who lived in different houses, 45.9% lived in this county.
Out of people who lived in different counties, 54.9% lived in California.
Rosemead:
95.3%State average:
88.9%
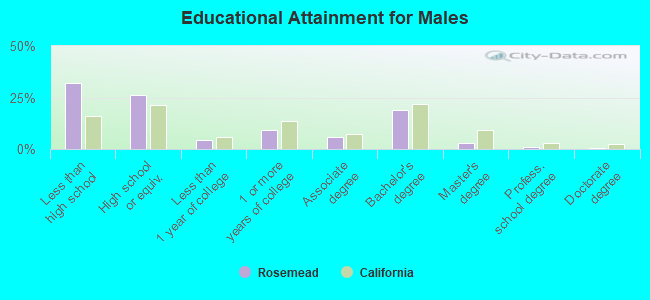
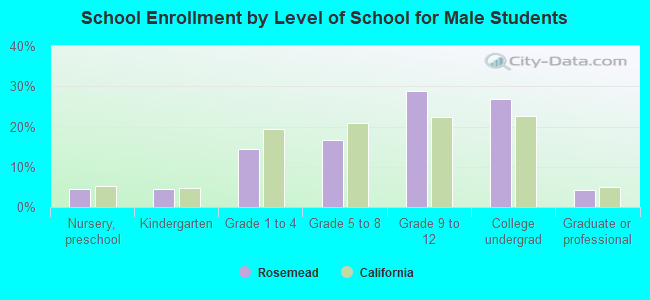
Education attainment for males 25 years and older:
No schooling: 2,692Nursery to 4th grade: 2725th and 6th grade: 7917th and 8th grade: 2149th grade: 72410th grade: 12111th grade: 22412th grade, no diploma: 799High school graduate (or equivalency): 4,764Less than 1 year of college: 775Some college more than 1 year, no degree: 1,693Associate degree: 1,029Bachelor's degree: 3,491Master's degree: 518Professional school degree: 146Doctorate degree: 74
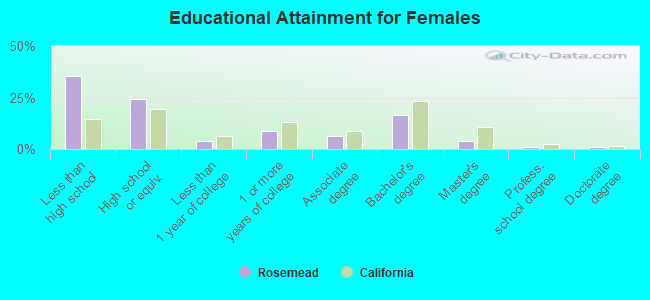
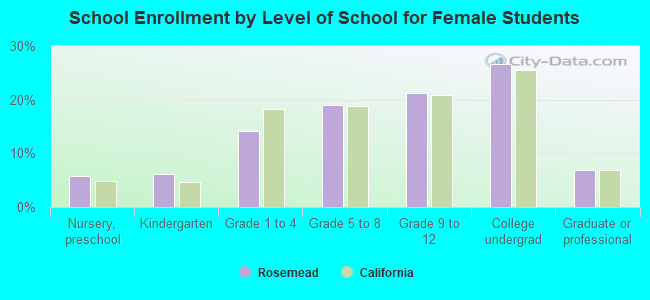
Education attainment for females 25 years and older:
No schooling: 3,115Nursery to 4th grade: 4155th and 6th grade: 7907th and 8th grade: 3909th grade: 55710th grade: 13911th grade: 17812th grade, no diploma: 1,057High school graduate (or equivalency): 4,547Less than 1 year of college: 744Some college more than 1 year, no degree: 1,647Associate degree: 1,160Bachelor's degree: 3,093Master's degree: 702Professional school degree: 171Doctorate degree: 156
Housing units in structures:
One, detached: 10,964One, attached: 2,145Two: 1913 or 4: 2415 to 9: 43910 to 19: 32420 to 49: 30050 or more: 321Mobile homes: 246Median worth of mobile homes: $56,504
Housing units lacking complete plumbing facilities in 2022: 0.3%Housing units lacking complete kitchen facilities in 2022: 4.4%House/condo owner moved in on average 20 years ago
Renter moved in on average 7 years ago
Private vs. public school enrollment:
Students in private schools in grades 1 to 8 (elementary and middle school): 247 Here:
7.2%California:
10.5%
Students in private schools in grades 9 to 12 (high school): 52 Students in private undergraduate colleges: 180 Here:
6.4%California:
15.9%