Round Rock, TX (Texas) Houses and Residents
| Round Rock: | $444,400 |
| Texas: | $275,400 |
Mean price in 2022:
Detached houses: $417,179
Here: $417,179 State: $369,058 Townhouses or other attached units: $324,790
Here: $324,790 State: $327,631 In 2-unit structures: $404,804
Here: $404,804 State: $374,947 In 3-to-4-unit structures: $235,056
Here: $235,056 State: $209,652 In 5-or-more-unit structures: $425,700
Here: $425,700 State: $413,944 Mobile homes: $142,335
Here: $142,335 State: $124,413
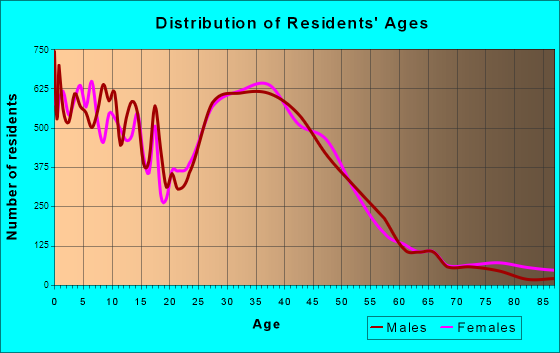
Total population: 112,744 (Urban population: 59,433, Rural population: 974 (all nonfarm))
Houses: 47,702 (45,859 occupied: 24,912 owner occupied, 20,947 renter occupied)
| % of renters here: | 46% |
| State: | 38% |
Housing density: 1,825 houses/condos per square mile
Median price asked for vacant for-sale houses and condos in 2022: $576,345.
Median contract rent in 2022: $1,572 (lower quartile is $1,265, upper quartile is $1,855)
Median rent asked for vacant for-rent units in 2022: $602
Median gross rent in Round Rock, TX in 2022: $1,750
Housing units in Round Rock with a mortgage: 17,801 (689 second mortgage, 33 home equity loan, 558 both second mortgage and home equity loan)
Houses without a mortgage: 133
Median household income for houses/condos with a mortgage: $124,458
Median household income for apartments without a mortgage: $81,932
Median monthly housing costs: $1,779
Compare current foreclosures in Round Rock, TX:
| Photo | Address | Area | Beds / Baths | Price | Details |
|---|---|---|---|---|---|

|
#1
Shiraz Loop
Round Rock, TX 78665
|
2,820 sq. feet
|
3 baths 4 beds |
show details | |

|
#2
Knollwood Cir
Round Rock, TX 78681
|
2,750 sq. feet
|
3 baths 4 beds |
show details | |

|
#3
Huxley Ln
Round Rock, TX 78664
|
1,868 sq. feet
|
2 baths 3 beds |
show details | |

|
#4
Bluff Dr
Round Rock, TX 78681
|
3,612 sq. feet
|
2 baths - beds |
show details | |

|
#5
Buckley Ln
Round Rock, TX 78664
|
1,698 sq. feet
|
2 baths - beds |
show details | |

|
#6
Marsh Harbour Cv
Round Rock, TX 78664
|
2,385 sq. feet
|
2 baths - beds |
show details | |

|
#7
Thorn Creek Pl
Round Rock, TX 78664
|
2,977 sq. feet
|
2 baths - beds |
show details | |

|
#8
S Crossing Dr
Round Rock, TX 78664
|
1,569 sq. feet
|
2 baths - beds |
show details | |

|
#9
E Mesa Park Dr
Round Rock, TX 78664
|
2,052 sq. feet
|
2 baths - beds |
show details | |

|
#10
Cheyenne Valley Dr
Round Rock, TX 78664
|
4,088 sq. feet
|
3 baths - beds |
show details |
| Photo | Address | Area | Beds / Baths | Price | Details |
|---|---|---|---|---|---|

|
#11
Kenneys Way # 1213
Round Rock, TX 78665
|
1,344 sq. feet
|
2 baths - beds |
show details | |

|
#12
Redwing Way
Round Rock, TX 78664
|
1,179 sq. feet
|
1 baths - beds |
show details | |

|
#13
Chatelle Dr
Round Rock, TX 78681
|
3,484 sq. feet
|
2 baths - beds |
show details | |

|
#14
Mohican
Round Rock, TX 78665
|
1,534 sq. feet
|
2 baths - beds |
show details | |

|
#15
E Mesa Park Cv
Round Rock, TX 78664
|
2,229 sq. feet
|
2 baths - beds |
show details | |

|
#16
Longmeadow Dr
Round Rock, TX 78664
|
1,123 sq. feet
|
2 baths - beds |
show details | |

|
#17
Bluebonnet Dr
Round Rock, TX 78664
|
3,127 sq. feet
|
2 baths - beds |
show details | |

|
#18
Zola Ln
Round Rock, TX 78664
|
1,730 sq. feet
|
2 baths - beds |
show details | |

|
#19
White Oak Loop
Round Rock, TX 78681
|
1,504 sq. feet
|
2 baths - beds |
show details | |

|
#20
Almelo Dr
Round Rock, TX 78681
|
2,234 sq. feet
|
3 baths - beds |
show details |
| Photo | Address | Area | Beds / Baths | Price | Details |
|---|---|---|---|---|---|

|
#21
W Pflugerville Pkwy
Round Rock, TX 78664
|
1,560 sq. feet
|
2 baths - beds |
show details | |

|
#22
Rosemary Ln
Round Rock, TX 78664
|
1,376 sq. feet
|
2 baths - beds |
show details | |

|
#23
Zephyr Ln
Round Rock, TX 78664
|
1,583 sq. feet
|
2 baths - beds |
show details | |

|
#24
Oxford Blvd
Round Rock, TX 78664
|
1,343 sq. feet
|
2 baths - beds |
show details | |

|
#25
Mesquite Hollow Pl
Round Rock, TX 78665
|
2,707 sq. feet
|
2 baths - beds |
show details | |

|
#26
White Oak Loop
Round Rock, TX 78681
|
1,345 sq. feet
|
2 baths - beds |
show details | |

|
#27
Old West Pl # B
Round Rock, TX 78681
|
1,744 sq. feet
|
4 baths - beds |
show details | |

|
#28
Monument Dr
Round Rock, TX 78681
|
1,401 sq. feet
|
2 baths - beds |
show details | |

|
#29
Canyon Trail Ct
Round Rock, TX 78664
|
1,776 sq. feet
|
2 baths - beds |
show details | |

|
#30
Rams Horn Way
Round Rock, TX 78665
|
2,398 sq. feet
|
2 baths - beds |
show details |
| Photo | Address | Area | Beds / Baths | Price | Details |
|---|---|---|---|---|---|

|
#31
Butler Way
Round Rock, TX 78665
|
1,928 sq. feet
|
2 baths - beds |
show details | |

|
#32
Gunsight Dr
Round Rock, TX 78665
|
3,619 sq. feet
|
2 baths - beds |
show details | |

|
#33
Walleye Way
Round Rock, TX 78665
|
1,341 sq. feet
|
2 baths - beds |
show details | |

|
#34
Pine Needle Cir
Round Rock, TX 78681
|
2,056 sq. feet
|
2 baths - beds |
show details | |

|
#35
Louis Henna Blvd
Round Rock, TX 78664
|
- sq. feet
|
- baths - beds |
show details | |

|
#36
Old West Pl, Apt B
Round Rock, TX 78681
|
- sq. feet
|
- baths - beds |
show details | |

|
#37
S A W Grimes Blvd, Ste 190
Round Rock, TX 78664
|
- sq. feet
|
- baths - beds |
show details | |

|
#38
Donnell Dr, Unit 4002
Round Rock, TX 78664
|
- sq. feet
|
- baths - beds |
show details | |

|
#39
S Great Oaks Dr Ste 101
Round Rock, TX 78681
|
- sq. feet
|
- baths - beds |
show details | |

|
#40
Santa Rosita Ct # 2307
Round Rock, TX 78665
|
- sq. feet
|
- baths - beds |
show details |
| Photo | Address | Area | Beds / Baths | Price | Details |
|---|---|---|---|---|---|

|
#41
Balboa Way
Round Rock, TX 78665
|
- sq. feet
|
- baths - beds |
show details | |

|
#42
Sam Bass Rd
Round Rock, TX 78681
|
- sq. feet
|
- baths - beds |
show details | |

|
#43
S Interstate 35
Round Rock, TX 78664
|
- sq. feet
|
- baths - beds |
show details | |

|
#44
Santa Clara Ln
Round Rock, TX 78665
|
- sq. feet
|
- baths - beds |
show details | |

|
#45
Louis Henna Blvd Apt 1308
Round Rock, TX 78664
|
- sq. feet
|
- baths - beds |
show details | |

|
#46
Hidden Valley Dr Apt 1535
Round Rock, TX 78665
|
- sq. feet
|
- baths - beds |
show details | |

|
#47
Great Oaks Dr Apt 303
Round Rock, TX 78681
|
- sq. feet
|
- baths - beds |
show details | |

|
#48
Florin Cv
Round Rock, TX 78665
|
- sq. feet
|
- baths - beds |
show details | |

|
#49
Texana Loop
Round Rock, TX 78665
|
- sq. feet
|
- baths - beds |
show details | |

|
Check over 1 million property listings on Foreclosure.com!
|
browse all offers | |||


Median year apartment built: 2006
Household type by relationship:
Households: 124,790- Male householders: 23,059 (4,219 living alone), Female householders: 22,800 (5,836 living alone)
23,173 spouses (23,111 opposite-sex spouses), 4,170 unmarried partners, (4,170 opposite-sex unmarried partners), 40,392 children (38,826 natural, 120 adopted, 1,446 stepchildren), 970 grandchildren, 1,140 brothers or sisters, 2,674 parents, 63 foster children, 1,255 other relatives, 4,266 non-relatives
- In group quarters: 828
Size of family households: 11,059 2-persons, 7,870 3-persons, 6,996 4-persons, 3,556 5-persons, 838 6-persons, 623 7-or-more-persons.
Size of nonfamily households: 10,055 1-person, 4,209 2-persons, 599 3-persons, 54 5-persons.
22,442 married couples with children.
7,273 single-parent households (681 men, 6,592 women).
70.4% of residents of Round Rock speak English at home.
18.3% of residents speak Spanish at home (67% speak English very well, 19% speak English well, 9% speak English not well, 5% don't speak English at all).
3.9% of residents speak other Indo-European language at home (78% speak English very well, 15% speak English well, 7% speak English not well).
4.7% of residents speak Asian or Pacific Island language at home (68% speak English very well, 23% speak English well, 8% speak English not well, 1% don't speak English at all).
1.9% of residents speak other language at home (72% speak English very well, 14% speak English well, 14% speak English not well).
Foreign born population: 19,023 (15.2%)
(53.4% of them are naturalized citizens)
| Here: | 6.4 |
| State: | 6.3 |
| Here: | 4.2 |
| State: | 4.0 |

- Bedrooms in owner-occupied houses and condos in Round Rock, Texas
- 0no bedroom
- 1841 bedroom
- 1,8982 bedrooms
- 12,5503 bedrooms
- 8,1944 bedrooms
- 2,0865+ bedrooms

- Bedrooms in renter-occupied apartments in Round Rock, Texas
- 1,126no bedroom
- 5,4731 bedroom
- 5,6542 bedrooms
- 6,0903 bedrooms
- 2,4254 bedrooms
- 1795+ bedrooms

- Cars and other vehicles available in Round Rock in owner-occupied houses/condos
- 166no vehicle
- 6,6911 vehicle
- 11,1372 vehicles
- 4,6473 vehicles
- 2,0704 vehicles
- 2015+ vehicles

- Cars and other vehicles available in Round Rock in renter-occupied apartments
- 1,407no vehicle
- 8,6211 vehicle
- 7,8972 vehicles
- 2,5933 vehicles
- 2344 vehicles
- 1955+ vehicles

- Rooms in owner-occupied houses in Round Rock, Texas
- 01 room
- 02 rooms
- 7083 rooms
- 2,3594 rooms
- 5,2685 rooms
- 4,4066 rooms
- 3,5637 rooms
- 2,8128 rooms
- 5,7969+ rooms

- Rooms in renter-occupied apartments in Round Rock, Texas
- 1,0611 room
- 1,3662 rooms
- 4,3633 rooms
- 5,0694 rooms
- 3,4165 rooms
- 2,4726 rooms
- 1,9197 rooms
- 6558 rooms
- 6269+ rooms


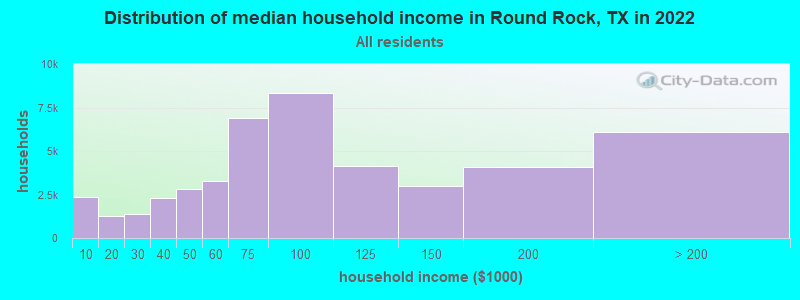
Round Rock, TX household income distribution

- 2,337Less than $10,000
- 1,238$10,000 to $19,999
- 1,353$20,000 to $29,999
- 2,319$30,000 to $39,999
- 2,792$40,000 to $49,999
- 3,274$50,000 to $59,999
- 6,916$60,000 to $74,999
- 8,360$75,000 to $99,999
- 4,146$100,000 to $124,999
- 2,986$125,000 to $149,999
- 4,052$150,000 to $199,999
- 6,086$200,000 or more
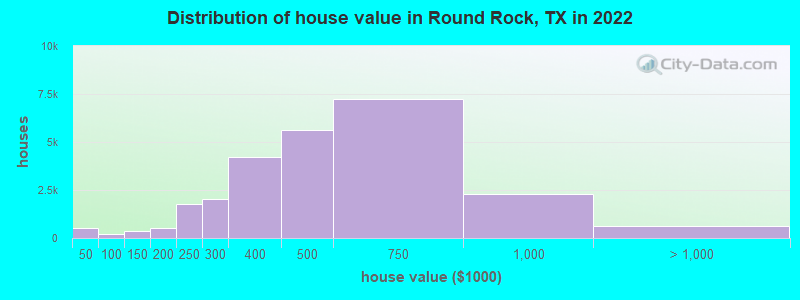
Home value of owner - occupied houses in 2022 in Round Rock, TX
-
- 205Less than $10,000
- 94$10,000 to $14,999
- 45$15,000 to $19,999
- 21$20,000 to $24,999
- 70$25,000 to $29,999
- 70$35,000 to $39,999
- 36$40,000 to $49,999
- 90$50,000 to $59,999
- 53$60,000 to $69,999
- 19$80,000 to $89,999
- 15$90,000 to $99,999
- 111$100,000 to $124,999
- 262$125,000 to $149,999
- 278$150,000 to $174,999
- 266$175,000 to $199,999
- 1,752$200,000 to $249,999
- 2,018$250,000 to $299,999
- 4,234$300,000 to $399,999
- 5,602$400,000 to $499,999
- 7,249$500,000 to $749,999
- 2,271$750,000 to $999,999
- 515$1,000,000 to $1,499,999
- 30$1,500,000 to $1,999,999
- 56$2,000,000 or more
Rent paid by renters in 2022 in Round Rock, TX
-
- 12Less than $100
- 50$150 to $199
- 110$200 to $249
- 7$250 to $299
- 41$300 to $349
- 22$450 to $499
- 166$500 to $549
- 84$550 to $599
- 123$600 to $649
- 121$650 to $699
- 38$700 to $749
- 166$750 to $799
- 194$800 to $899
- 947$900 to $999
- 4,633$1,000 to $1,249
- 5,084$1,250 to $1,499
- 8,084$1,500 to $1,999
- 1,489$2,000 to $2,499
- 262$2,500 to $2,999
- 21$3,000 to $3,499
- 168$3,500 or more
- 253No cash rent


Percentage of workers working in this county: 67.9%
Number of people working at home: 18,868 (25.7% of all workers)
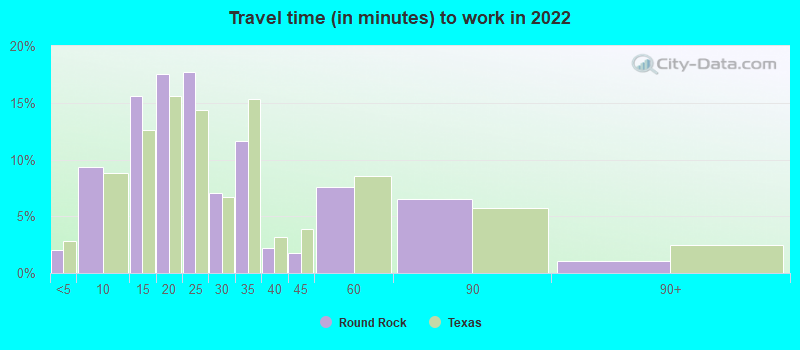
Travel time to work (commute)
- Less than 5 minutes: 1,006
- 5 to 9 minutes: 4,632
- 10 to 14 minutes: 6,302
- 15 to 19 minutes: 7,502
- 20 to 24 minutes: 8,396
- 25 to 29 minutes: 4,236
- 30 to 34 minutes: 7,046
- 35 to 39 minutes: 1,913
- 40 to 44 minutes: 1,505
- 45 to 59 minutes: 2,619
- 60 to 89 minutes: 1,306
- 90 or more minutes: 623
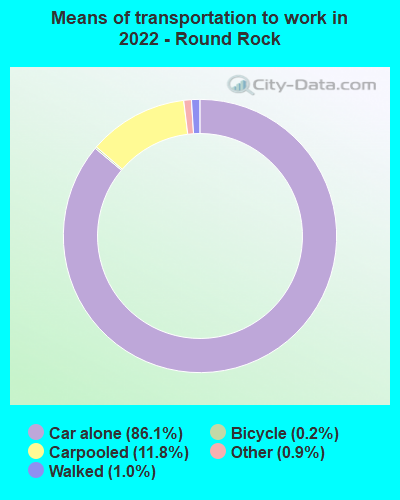
Means of transportation to work:
- Drove a car alone: 55,513 (65.2%)
- Carpooled: 6,174 (7.2%)
- Bus: 17 (0.0%)
- Long-distance train or commuter rail: 2 (0.0%)
- Taxi: 811 (1.0%)
- Bicycle: 101 (0.1%)
- Walked: 834 (1.0%)
- Worked at home: 18,868 (22.2%)

- Unemployment by race in 2022
- Unemployment rate for White non-Hispanic residents
- 2.8%Males
- 2.6%Females
- Unemployment rate for Black residents
- 2.8%Males
- 6.4%Females
- Unemployment rate for American Indian and Alaska Native residents
- 13.6%Males
- 11.2%Females
- Unemployment rate for Asian residents
- 0.9%Males
- 10.3%Females
- Unemployment rate for other race residents
- 0.2%Males
- 1.9%Females
- Unemployment rate for two or more race residents
- 1.1%Males
- 2.7%Females
- Unemployment rate for Hispanic or Latino residents
- 2.0%Males
- 3.7%Females

- Year of entry for the foreign-born population in Round Rock, Texas
- 9,5872010 or later
- 4,2192000 to 2009
- 3,7181990 to 1999
- 1,6461980 to 1989
- 1,0261970 to 1979
- 506Before 1970

First ancestries reported:
- German: 5,556 (8.9%)
- English: 4,185 (6.7%)
- American: 3,886 (6.2%)
- Irish: 1,473 (2.4%)
- Italian: 1,134 (1.8%)
- European: 1,123 (1.8%)
- Nigerian: 571 (0.9%)
- French: 539 (0.9%)
- Canadian: 466 (0.7%)
- African: 436 (0.7%)
- Scottish: 397 (0.6%)
- Norwegian: 375 (0.6%)
- Palestinian: 369 (0.6%)
- Turkish: 368 (0.6%)
- Ethiopian: 361 (0.6%)
- French Canadian: 325 (0.5%)
- Dutch: 319 (0.5%)
- Scotch-Irish: 311 (0.5%)
- Arab: 283 (0.5%)
- Polish: 221 (0.4%)
- British: 221 (0.4%)
- Portuguese: 191 (0.3%)
- Czech: 185 (0.3%)
- Eastern European: 177 (0.3%)
- Swedish: 167 (0.3%)
- Welsh: 167 (0.3%)
- Brazilian: 161 (0.3%)
- Israeli: 144 (0.2%)
- Russian: 137 (0.2%)
- Cajun: 130 (0.2%)
- Iranian: 123 (0.2%)
- Haitian: 110 (0.2%)
- Danish: 103 (0.2%)
- Romanian: 72 (0.1%)
- Scandinavian: 72 (0.1%)
- Lebanese: 71 (0.1%)
- Northern European: 63 (0.1%)
- Iraqi: 63 (0.1%)
- Kenyan: 61 (0.10%)
- Jamaican: 61 (0.10%)
- Austrian: 56 (0.09%)
- Syrian: 49 (0.08%)
- Slovene: 48 (0.08%)
- Czechoslovakian: 46 (0.07%)
- Ukrainian: 43 (0.07%)
- Albanian: 40 (0.06%)
- Zimbabwean: 38 (0.06%)
- Trinidadian and Tobagonian: 37 (0.06%)
- Hungarian: 34 (0.05%)
- Yugoslavian: 32 (0.05%)
- Swiss: 30 (0.05%)
- Egyptian: 28 (0.04%)
- Afghan: 26 (0.04%)
- Slovak: 21 (0.03%)
- Australian: 21 (0.03%)
- Greek: 20 (0.03%)
- Maltese: 19 (0.03%)
- West Indian: 16 (0.03%)
- Finnish: 15 (0.02%)
- Belgian: 15 (0.02%)
- Lithuanian: 11 (0.02%)
- Barbadian: 10 (0.02%)
- Armenian: 5 (0.01%)
Most common places of birth for foreign-born residents (%):
| Round Rock: | 30.2% (5,627) |
| Texas: | 48.4% (2,411,723) |
| Round Rock: | 16.1% (2,994) |
| Texas: | 6.1% (306,347) |
| Round Rock: | 3.4% (635) |
| Texas: | 3.7% (184,770) |
| Round Rock: | 2.8% (524) |
| Texas: | 1.9% (96,110) |
| Round Rock: | 2.6% (493) |
| Texas: | 0.4% (18,642) |
| Round Rock: | 2.4% (452) |
| Texas: | 0.2% (9,654) |
| Round Rock: | 2.3% (430) |
| Texas: | 0.6% (27,480) |
| Round Rock: | 2.0% (364) |
| Texas: | 1.2% (62,159) |
| Round Rock: | 1.7% (317) |
| Texas: | 1.2% (60,172) |
| Round Rock: | 1.7% (312) |
| Texas: | 2.1% (103,148) |
| Round Rock: | 1.7% (308) |
| Texas: | 0.3% (13,298) |
| Round Rock: | 1.5% (280) |
| Texas: | 0.4% (21,746) |
Place of birth for U.S.-born residents:
- This state: 63,882
- Other state: 39,389
- Northeast: 5,900
- Midwest: 11,047
- South: 13,487
- West: 8,955
81.4% of Round Rock residents lived in the same house 1 years ago.
Out of people who lived in different houses, 22.5% lived in this county.
Out of people who lived in different counties, 60.7% lived in Texas.
| Round Rock: | 81.4% |
| State average: | 85.7% |
Education attainment for males 25 years and older:
- No schooling: 211
- Nursery to 4th grade: 0
- 5th and 6th grade: 99
- 7th and 8th grade: 382
- 9th grade: 208
- 10th grade: 262
- 11th grade: 774
- 12th grade, no diploma: 331
- High school graduate (or equivalency): 5,656
- Less than 1 year of college: 2,549
- Some college more than 1 year, no degree: 5,216
- Associate degree: 3,171
- Bachelor's degree: 10,857
- Master's degree: 6,387
- Professional school degree: 696
- Doctorate degree: 378

Education attainment for females 25 years and older:
- No schooling: 415
- Nursery to 4th grade: 49
- 5th and 6th grade: 0
- 7th and 8th grade: 587
- 9th grade: 0
- 10th grade: 96
- 11th grade: 278
- 12th grade, no diploma: 322
- High school graduate (or equivalency): 9,620
- Less than 1 year of college: 2,274
- Some college more than 1 year, no degree: 6,265
- Associate degree: 4,993
- Bachelor's degree: 11,439
- Master's degree: 4,516
- Professional school degree: 672
- Doctorate degree: 424

Housing units in structures:
- One, detached: 30,661
- One, attached: 1,151
- Two: 1,185
- 3 or 4: 788
- 5 to 9: 1,721
- 10 to 19: 3,423
- 20 to 49: 3,314
- 50 or more: 5,459
House/condo owner moved in on average 8 years ago
Renter moved in on average 1 years ago

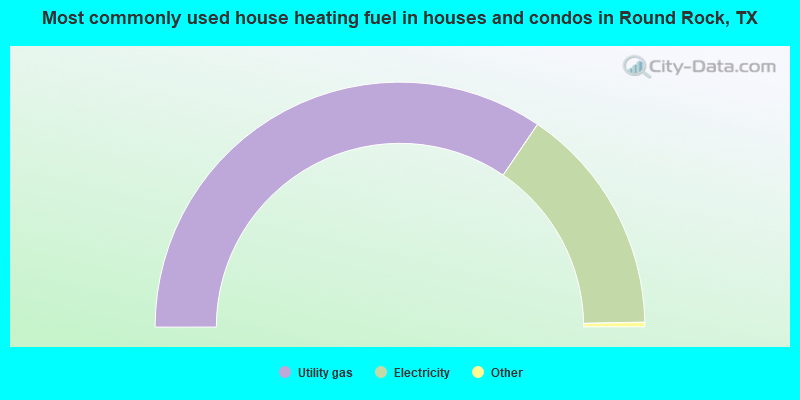
- 69.0%Utility gas
- 30.4%Electricity
- 0.3%Bottled, tank, or LP gas
- 0.2%No fuel used
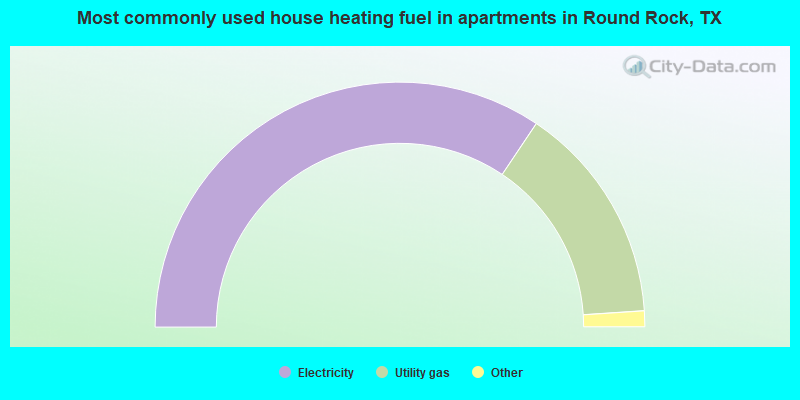
- 68.8%Electricity
- 29.1%Utility gas
- 0.9%No fuel used
- 0.6%Bottled, tank, or LP gas
- 0.3%Solar energy
- 0.3%Fuel oil, kerosene, etc.
Private vs. public school enrollment:
| Here: | 8.0% |
| Texas: | 8.8% |
| Here: | 10.5% |
| Texas: | 8.0% |
| Here: | 24.7% |
| Texas: | 16.2% |


