Housing density: 811 houses/condos per square mile
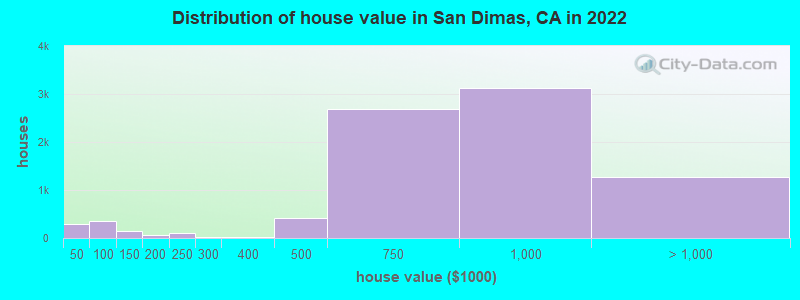
Median price asked for vacant for-sale houses and condos in 2022: $3,788,966.
Median contract rent in 2022: over $2,000 (lower quartile is $1,662, upper quartile is over $2,000)
Median rent asked for vacant for-rent units in 2022: $4,004
Median gross rent in San Dimas, CA in 2022: over $2,000
Housing units in San Dimas with a mortgage: 5,530 (580 second mortgage, 17 home equity loan, 451 both second mortgage and home equity loan) Houses without a mortgage: 109
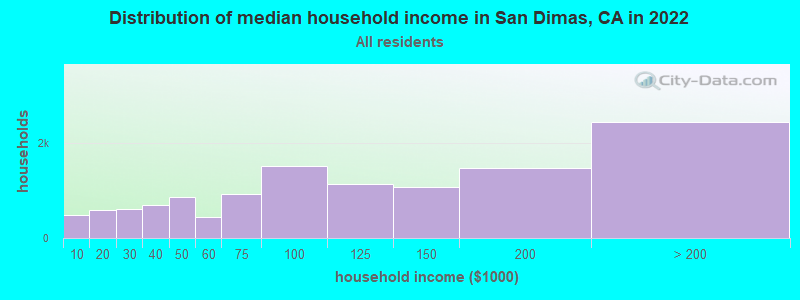
Median household income for houses/condos with a mortgage: $147,116
Median household income for apartments without a mortgage: $66,843
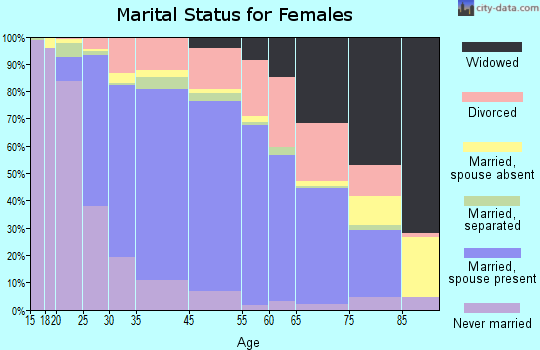
4,206 married couples with children.
1,131 single-parent households (518 men, 613 women).
67.3% of residents of San Dimas speak English at home.
17.5% of residents speak Spanish at home (80% speak English very well, 14% speak English well, 6% speak English not well, 1% don't speak English at all).
2.4% of residents speak other Indo-European language at home (82% speak English very well, 16% speak English well, 2% speak English not well).
11.8% of residents speak Asian or Pacific Island language at home (57% speak English very well, 24% speak English well, 13% speak English not well, 6% don't speak English at all).
1.7% of residents speak other language at home (77% speak English very well, 7% speak English well, 12% speak English not well, 4% don't speak English at all).
Foreign born population: 6,693 (19.8%)
(73.2% of them are naturalized citizens)
Percentage of workers working in this county: 80.5% Number of people working at home: 3,000 (18.2% of all workers)
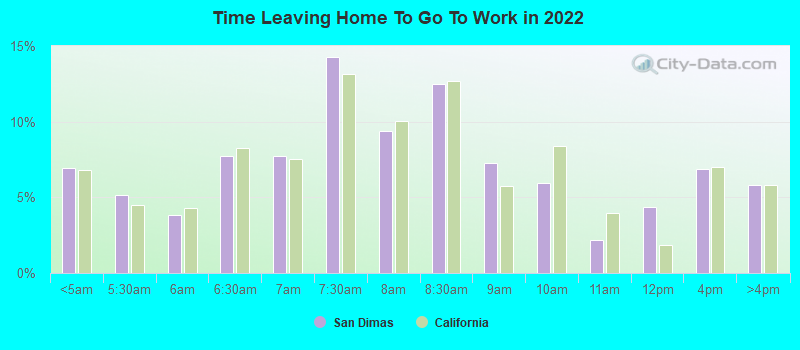
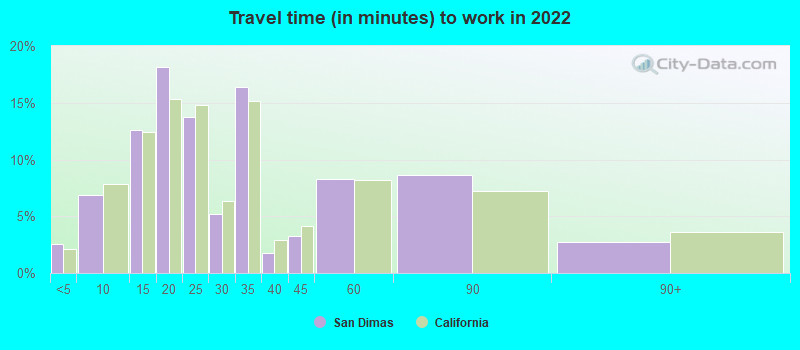
Travel time to work (commute)
Less than 5 minutes: 168
5 to 9 minutes: 845
10 to 14 minutes: 1,311
15 to 19 minutes: 2,058
20 to 24 minutes: 2,290
25 to 29 minutes: 443
30 to 34 minutes: 2,179
35 to 39 minutes: 478
40 to 44 minutes: 311
45 to 59 minutes: 1,481
60 to 89 minutes: 1,341
90 or more minutes: 600
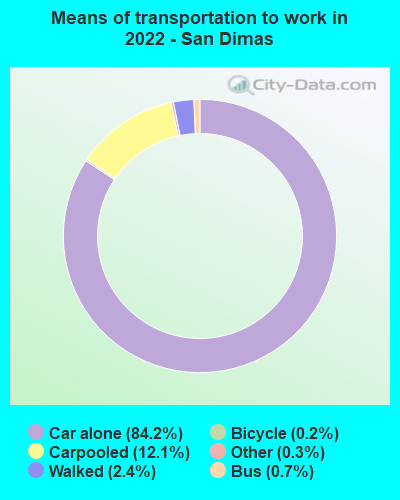
Means of transportation to work:
Drove a car alone: 12,898 (69.8%)
Carpooled: 2,058 (11.1%)
Bus: 98 (0.5%)
Subway or elevated rail: 7 (0.0%)
Taxi: 53 (0.3%)
Bicycle: 34 (0.2%)
Walked: 394 (2.1%)
Worked at home: 3,000 (16.2%)
Unemployment by race in 2022
Unemployment rate for White non-Hispanic residents
5.4%Males
3.2%Females
Unemployment rate for Black residents
5.6%Males
2.8%Females
Unemployment rate for Asian residents
1.9%Males
1.5%Females
Unemployment rate for other race residents
5.6%Males
Unemployment rate for two or more race residents
11.1%Males
6.3%Females
Unemployment rate for Hispanic or Latino residents
5.8%Males
3.8%Females
Year of entry for the foreign-born population in San Dimas, California
1,5802010 or later
7602000 to 2009
1,0841990 to 1999
1,5401980 to 1989
1,6411970 to 1979
1,422Before 1970
First ancestries reported:
English: 795 (4.3%)
German: 709 (3.9%)
Irish: 693 (3.8%)
Italian: 591 (3.2%)
American: 464 (2.5%)
European: 331 (1.8%)
Polish: 273 (1.5%)
Greek: 196 (1.1%)
Scottish: 188 (1.0%)
Swedish: 122 (0.7%)
Czech: 119 (0.7%)
Iranian: 110 (0.6%)
Iraqi: 82 (0.4%)
Nigerian: 75 (0.4%)
Egyptian: 74 (0.4%)
Jamaican: 72 (0.4%)
British: 67 (0.4%)
French: 62 (0.3%)
Croatian: 57 (0.3%)
French Canadian: 57 (0.3%)
Lebanese: 47 (0.3%)
Belizean: 44 (0.2%)
Scotch-Irish: 40 (0.2%)
Northern European: 38 (0.2%)
Dutch: 36 (0.2%)
Russian: 35 (0.2%)
Armenian: 23 (0.1%)
Slovak: 22 (0.1%)
Ethiopian: 20 (0.1%)
Canadian: 16 (0.09%)
Scandinavian: 15 (0.08%)
Slovene: 13 (0.07%)
Basque: 12 (0.07%)
Bulgarian: 12 (0.07%)
Lithuanian: 9 (0.05%)
Austrian: 8 (0.04%)
Swiss: 7 (0.04%)
Danish: 5 (0.03%)
Norwegian: 5 (0.03%)
Palestinian: 3 (0.02%)
Most common places of birth for foreign-born residents (%):
Mexico
San Dimas:
20.2% (1,354)
California:
37.2% (3,881,193)
China, excluding Hong Kong and Taiwan
San Dimas:
15.5% (1,038)
California:
6.6% (684,672)
Philippines
San Dimas:
13.3% (890)
California:
7.8% (818,297)
Taiwan
San Dimas:
9.8% (656)
California:
1.7% (176,274)
Hong Kong
San Dimas:
3.1% (209)
California:
1.0% (105,215)
Vietnam
San Dimas:
3.0% (202)
California:
4.9% (512,335)
India
San Dimas:
2.8% (190)
California:
5.2% (539,184)
Guatemala
San Dimas:
2.0% (136)
California:
2.8% (290,436)
Cuba
San Dimas:
1.9% (125)
California:
0.3% (30,441)
El Salvador
San Dimas:
1.6% (109)
California:
4.2% (440,287)
Cambodia
San Dimas:
1.5% (101)
California:
0.5% (51,974)
Place of birth for U.S.-born residents:
This state: 22,463
Other state: 4,191
Northeast: 1,153
Midwest: 1,497
South: 988
West: 540
93.3% of San Dimas residents lived in the same house 1 years ago. Out of people who lived in different houses, 38.1% lived in this county. Out of people who lived in different counties, 86.1% lived in California.
San Dimas:
93.3%
State average:
88.9%
Education attainment for males 25 years and older:
No schooling: 131
Nursery to 4th grade: 2
5th and 6th grade: 24
7th and 8th grade: 32
9th grade: 15
10th grade: 56
11th grade: 106
12th grade, no diploma: 337
High school graduate (or equivalency): 2,420
Less than 1 year of college: 996
Some college more than 1 year, no degree: 2,026
Associate degree: 1,132
Bachelor's degree: 2,771
Master's degree: 1,202
Professional school degree: 308
Doctorate degree: 201
Education attainment for females 25 years and older:
No schooling: 271
Nursery to 4th grade: 59
5th and 6th grade: 78
7th and 8th grade: 55
9th grade: 74
10th grade: 10
11th grade: 122
12th grade, no diploma: 197
High school graduate (or equivalency): 2,604
Less than 1 year of college: 756
Some college more than 1 year, no degree: 2,156
Associate degree: 1,420
Bachelor's degree: 2,961
Master's degree: 1,968
Professional school degree: 206
Doctorate degree: 82
Housing units in structures:
One, detached: 7,670
One, attached: 1,575
Two: 110
3 or 4: 356
5 to 9: 306
10 to 19: 501
20 to 49: 164
50 or more: 732
Mobile homes: 1,145
Boats, RVs, vans, etc.: 18
Median worth of mobile homes: $117,729
Housing units lacking complete plumbing facilities in 2022: 2.1%
Housing units lacking complete kitchen facilities in 2022: 4.6%
House/condo owner moved in on average 17 years ago