Sanatoga, PA (Pennsylvania) Houses and Residents
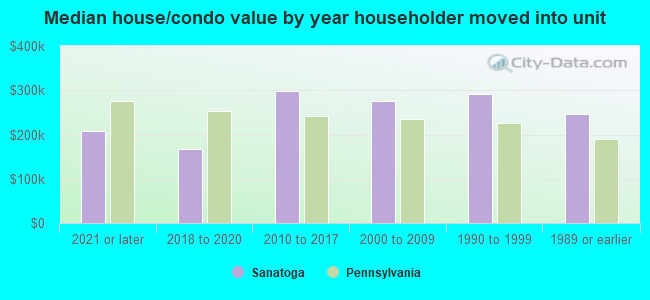
| Sanatoga: | $265,063 |
| Pennsylvania: | $245,500 |
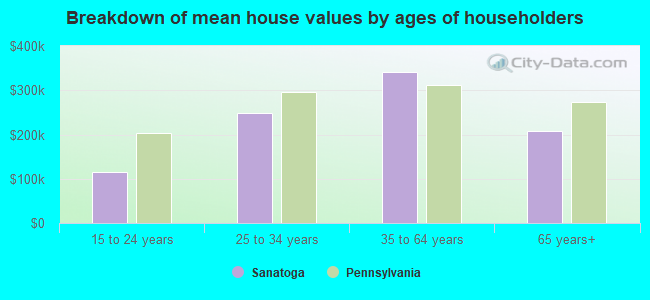
Mean price in 2022:
Detached houses: $292,856
Here: $292,856 State: $317,202 Townhouses or other attached units: $390,952
Here: $390,952 State: $254,369 In 5-or-more-unit structures: $185,798
Here: $185,798 State: $320,068 Mobile homes: $72,596
Here: $72,596 State: $92,414
Total population: 8,378 (Urban population: 7,657, Rural population: 87 (all nonfarm))
Houses: 3,378 (3,149 occupied: 2,221 owner occupied, 948 renter occupied)
| % of renters here: | 30% |
| State: | 31% |
Housing density: 990 houses/condos per square mile
Median price asked for vacant for-sale houses and condos in 2022: $232,833.
Median contract rent in 2022: $1,248 (lower quartile is $860, upper quartile is $1,586)
Median rent asked for vacant for-rent units in 2022: $1,593
Median gross rent in Sanatoga, PA in 2022: $1,475
Housing units in Sanatoga with a mortgage: 1,358 (157 second mortgage, 0 home equity loan, 121 both second mortgage and home equity loan)
Houses without a mortgage: 101
Median household income for houses/condos with a mortgage: $120,835
Median household income for apartments without a mortgage: $88,435
Median monthly housing costs: $1,334
Compare current foreclosures near Sanatoga, PA:
| Photo | Address | Area | Beds / Baths | Price | Details |
|---|---|---|---|---|---|

|
#1
Lakeview Ct
Downingtown, PA 19335
|
1,890 sq. feet
|
2 baths 3 beds |
$28,237
|
show details |

|
#2
Richmond Rd
Paoli, PA 19301
|
1,706 sq. feet
|
2 baths 2 beds |
$179,198
|
show details |

|
#3
Jeffords Ct
Phoenixville, PA 19460
|
2,385 sq. feet
|
2 baths 2 beds |
$262,604
|
show details |

|
#4
Bridge St
Spring City, PA 19475
|
1,743 sq. feet
|
1 baths 3 beds |
$89,980
|
show details |

|
#5
Bala Ter W
West Chester, PA 19380
|
1,632 sq. feet
|
1 baths 3 beds |
$180,258
|
show details |

|
#6
Hawthorne Pl
Paoli, PA 19301
|
2,486 sq. feet
|
2 baths 5 beds |
$231,081
|
show details |

|
#7
Kimberton Rd
Phoenixville, PA 19460
|
1,302 sq. feet
|
2 baths 4 beds |
$382,337
|
show details |

|
#8
Overlook Pointe
Douglassville, PA 19518
|
2,424 sq. feet
|
2 baths 4 beds |
$170,217
|
show details |

|
#9
Gulph Rd
Wayne, PA 19087
|
3,262 sq. feet
|
2 baths 4 beds |
$651,481
|
show details |

|
#10
Creek Rd
Glenmoore, PA 19343
|
874 sq. feet
|
1 baths 2 beds |
$128,755
|
show details |
| Photo | Address | Area | Beds / Baths | Price | Details |
|---|---|---|---|---|---|

|
#11
Josephs Way
Malvern, PA 19355
|
1,853 sq. feet
|
2 baths 3 beds |
$128,821
|
show details |

|
#12
Brown Dr
Spring City, PA 19475
|
1,563 sq. feet
|
2 baths 4 beds |
$121,104
|
show details |

|
#13
Richmond Rd
Paoli, PA 19301
|
1,215 sq. feet
|
1 baths 2 beds |
$263,438
|
show details |

|
#14
Hares Hill Rd
Phoenixville, PA 19460
|
1,246 sq. feet
|
1 baths 3 beds |
$146,425
|
show details |

|
#15
Pughtown Rd
Spring City, PA 19475
|
2,535 sq. feet
|
2 baths 4 beds |
$483,689
|
show details |

|
#16
New Market Ct
Wayne, PA 19087
|
1,080 sq. feet
|
1 baths 2 beds |
$98,656
|
show details |

|
#17
Lewisville Ct
Phoenixville, PA 19460
|
1,605 sq. feet
|
2 baths 2 beds |
$51,546
|
show details |

|
#18
Hoffecker Rd
Phoenixville, PA 19460
|
1,260 sq. feet
|
2 baths 3 beds |
$217,558
|
show details |

|
#19
White Horse Rd
Malvern, PA 19355
|
9,288 sq. feet
|
4 baths 4 beds |
$2,198,797
|
show details |

|
#20
2nd Ave
Phoenixville, PA 19460
|
1,120 sq. feet
|
1 baths 3 beds |
$39,472
|
show details |
| Photo | Address | Area | Beds / Baths | Price | Details |
|---|---|---|---|---|---|

|
#21
Howellville Rd
Berwyn, PA 19312
|
1,390 sq. feet
|
1 baths 4 beds |
$134,019
|
show details |

|
#22
Meadow Ln
Pottstown, PA 19465
|
3,115 sq. feet
|
3 baths 4 beds |
$497,757
|
show details |

|
#23
L Fleur
Devon, PA 19333
|
1,412 sq. feet
|
1 baths 2 beds |
$50,690
|
show details |

|
#24
W Central Ave
Paoli, PA 19301
|
1,939 sq. feet
|
2 baths 4 beds |
$438,947
|
show details |

|
#25
King Of Prussia Rd
Wayne, PA 19087
|
1,509 sq. feet
|
1 baths 3 beds |
$334,200
|
show details |

|
#26
Woodside Ave
Berwyn, PA 19312
|
2,080 sq. feet
|
2 baths 5 beds |
$525,082
|
show details |

|
#27
Shady Brook Ln
Malvern, PA 19355
|
3,974 sq. feet
|
3 baths 4 beds |
$185,445
|
show details |

|
#28
Gwynedd Ct
Exton, PA 19341
|
1,760 sq. feet
|
2 baths 3 beds |
$296,451
|
show details |

|
#29
Harvey Ln
Malvern, PA 19355
|
2,163 sq. feet
|
2 baths 4 beds |
$61,867
|
show details |

|
#30
Fairview Ave
Reading, PA 19606
|
1,056 sq. feet
|
1 baths 3 beds |
$109,846
|
show details |
| Photo | Address | Area | Beds / Baths | Price | Details |
|---|---|---|---|---|---|

|
#31
Woodbine Ave
Paoli, PA 19301
|
1,421 sq. feet
|
1 baths 3 beds |
$110,237
|
show details |

|
#32
Denton Dr
Glenmoore, PA 19343
|
1,590 sq. feet
|
1 baths 3 beds |
$34,159
|
show details |

|
#33
Rickmar Ln
Malvern, PA 19355
|
1,300 sq. feet
|
2 baths 3 beds |
$4,200
|
show details |

|
#34
Marshall Rd
Glenmoore, PA 19343
|
905 sq. feet
|
1 baths 2 beds |
$34,621
|
show details |

|
#35
South St
Phoenixville, PA 19460
|
1,568 sq. feet
|
1 baths 3 beds |
$178,971
|
show details |

|
#36
Hopkinson Ct # 160
Wayne, PA 19087
|
1,656 sq. feet
|
2 baths 2 beds |
$214,896
|
show details |

|
#37
Hartman Run # 1
Phoenixville, PA 19460
|
2,919 sq. feet
|
2 baths 3 beds |
show details | |

|
#38
Fairview Ave
Reading, PA 19606
|
1,821 sq. feet
|
2 baths 4 beds |
show details | |

|
#39
Montgomery Ave
New Berlinville, PA 19545
|
1,768 sq. feet
|
2 baths 3 beds |
show details | |

|
#40
Quail Dr N
Phoenixville, PA 19460
|
2,922 sq. feet
|
3 baths 4 beds |
show details |
| Photo | Address | Area | Beds / Baths | Price | Details |
|---|---|---|---|---|---|

|
#41
Elverson Rd
Morgantown, PA 19543
|
1,287 sq. feet
|
1 baths 3 beds |
show details | |

|
#42
Saint Marys St
Phoenixville, PA 19460
|
- sq. feet
|
1 baths 3 beds |
show details | |

|
#43
W Airy St
Norristown, PA 19401
|
2,176 sq. feet
|
2 baths 5 beds |
show details | |

|
#44
Stanbridge St
Norristown, PA 19401
|
1,737 sq. feet
|
1 baths 5 beds |
show details | |

|
#45
Red Oak Dr
Boyertown, PA 19512
|
1,628 sq. feet
|
2 baths 3 beds |
show details | |

|
#46
W Washington St
Norristown, PA 19401
|
1,425 sq. feet
|
1 baths 4 beds |
show details | |

|
#47
W Fornance St
Norristown, PA 19401
|
1,972 sq. feet
|
2 baths 4 beds |
show details | |

|
#48
Mint Tier Ct
Reading, PA 19606
|
1,520 sq. feet
|
3 baths 2 beds |
show details | |

|
#49
E Spring St
Bechtelsville, PA 19505
|
1,472 sq. feet
|
2 baths 3 beds |
show details | |

|
Check over 1 million property listings on Foreclosure.com!
|
browse all offers | |||

Latest news about housing in Sanatoga, PA collected exclusively by city-data.com from local newspapers, TV, and radio stations

 | Retail coming to Philadelphia (5386 replies) |
| So...what do Y'all think of Pottstown? (14 replies) |
| Living around Pottstown (0 replies) |
| Douglassville? (11 replies) |
| NC versus PA (58 replies) |
| Need Info About Pottstown, PA! (32 replies) |

Median year apartment built: 1983
Household type by relationship:
Households: 8,914- Male householders: 1,668 (347 living alone), Female householders: 1,479 (477 living alone)
1,567 spouses (1,567 opposite-sex spouses), 299 unmarried partners, (299 opposite-sex unmarried partners), 3,138 children (2,853 natural, 68 adopted, 216 stepchildren), 117 grandchildren, 62 brothers or sisters, 168 parents, 0 foster children, 49 other relatives, 178 non-relatives
- In group quarters: 184
Size of family households: 643 2-persons, 542 3-persons, 451 4-persons, 382 5-persons, 75 6-persons, 22 7-or-more-persons.
Size of nonfamily households: 849 1-person, 160 2-persons, 6 3-persons, 16 4-persons.
1,405 married couples with children.
902 single-parent households (455 men, 447 women).
89.8% of residents of Sanatoga speak English at home.
2.7% of residents speak Spanish at home (95% speak English very well, 5% speak English not well).
2.0% of residents speak other Indo-European language at home (64% speak English very well, 28% speak English well, 8% speak English not well).
1.6% of residents speak Asian or Pacific Island language at home (86% speak English very well, 8% speak English well, 6% speak English not well).
4.2% of residents speak other language at home (51% speak English very well, 16% speak English well, 33% speak English not well).
Foreign born population: 695 (7.8%)
(69.4% of them are naturalized citizens)
| Here: | 6.9 |
| State: | 6.8 |
| Here: | 5.0 |
| State: | 4.3 |
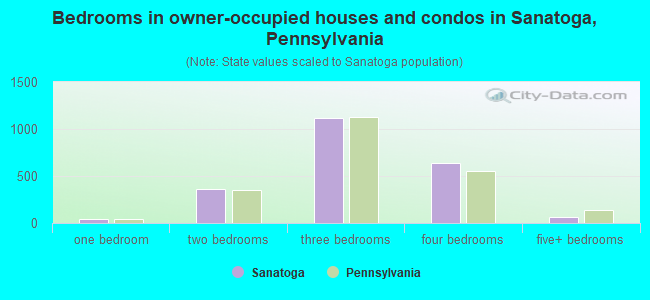
- Bedrooms in owner-occupied houses and condos in Sanatoga, Pennsylvania
- 7no bedroom
- 381 bedroom
- 3592 bedrooms
- 1,1123 bedrooms
- 6434 bedrooms
- 635+ bedrooms
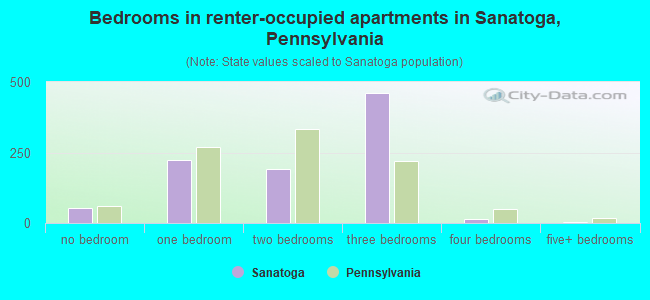
- Bedrooms in renter-occupied apartments in Sanatoga, Pennsylvania
- 53no bedroom
- 2221 bedroom
- 1932 bedrooms
- 4623 bedrooms
- 144 bedrooms
- 55+ bedrooms
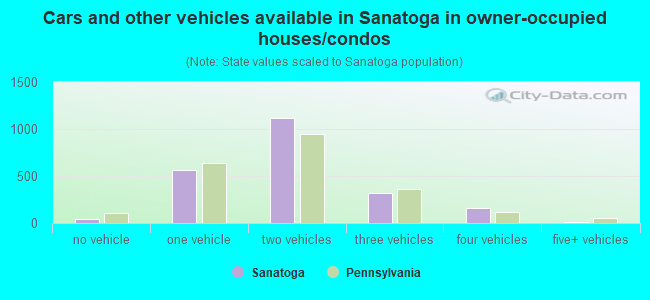
- Cars and other vehicles available in Sanatoga in owner-occupied houses/condos
- 43no vehicle
- 5681 vehicle
- 1,1212 vehicles
- 3153 vehicles
- 1634 vehicles
- 125+ vehicles
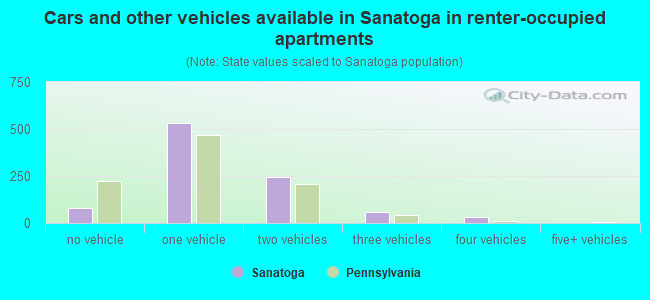
- Cars and other vehicles available in Sanatoga in renter-occupied apartments
- 82no vehicle
- 5301 vehicle
- 2452 vehicles
- 613 vehicles
- 314 vehicles
- 05+ vehicles
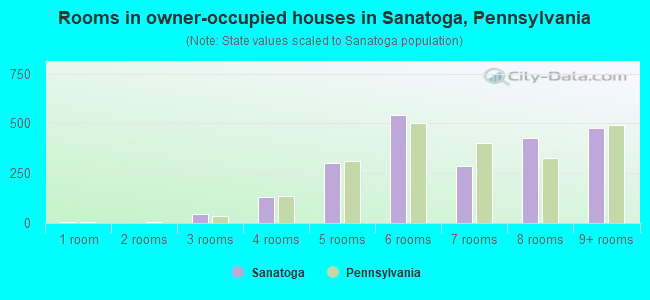
- Rooms in owner-occupied houses in Sanatoga, Pennsylvania
- 71 room
- 02 rooms
- 473 rooms
- 1324 rooms
- 2995 rooms
- 5436 rooms
- 2867 rooms
- 4298 rooms
- 4799+ rooms
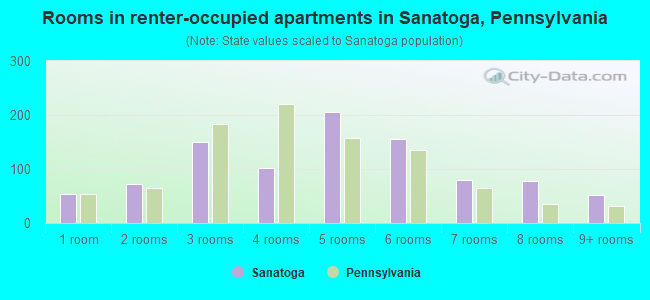
- Rooms in renter-occupied apartments in Sanatoga, Pennsylvania
- 531 room
- 722 rooms
- 1503 rooms
- 1024 rooms
- 2065 rooms
- 1566 rooms
- 807 rooms
- 778 rooms
- 529+ rooms
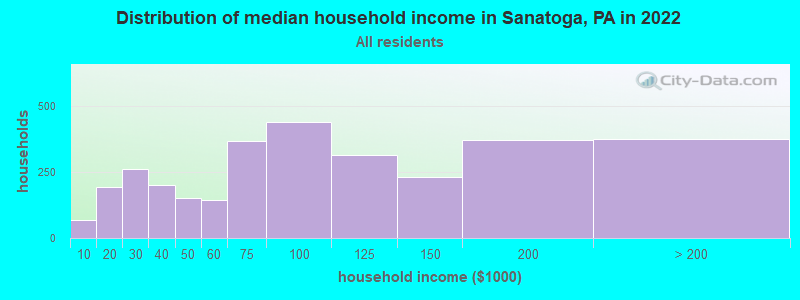
Sanatoga, PA household income distribution

- 67Less than $10,000
- 195$10,000 to $19,999
- 260$20,000 to $29,999
- 200$30,000 to $39,999
- 151$40,000 to $49,999
- 145$50,000 to $59,999
- 368$60,000 to $74,999
- 440$75,000 to $99,999
- 315$100,000 to $124,999
- 230$125,000 to $149,999
- 373$150,000 to $199,999
- 377$200,000 or more
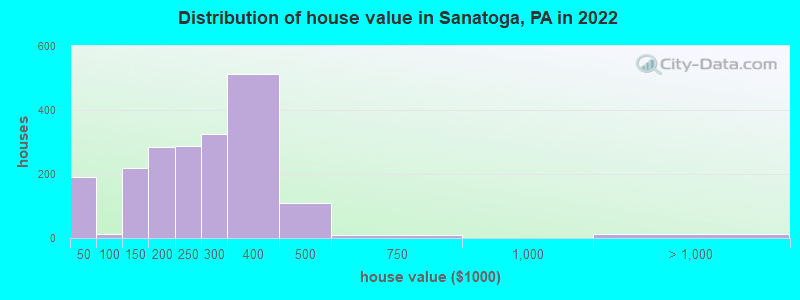
Home value of owner - occupied houses in 2022 in Sanatoga, PA
-
- 65Less than $10,000
- 26$10,000 to $14,999
- 19$15,000 to $19,999
- 14$20,000 to $24,999
- 64$30,000 to $34,999
- 5$80,000 to $89,999
- 6$90,000 to $99,999
- 39$100,000 to $124,999
- 180$125,000 to $149,999
- 176$150,000 to $174,999
- 107$175,000 to $199,999
- 287$200,000 to $249,999
- 325$250,000 to $299,999
- 512$300,000 to $399,999
- 108$400,000 to $499,999
- 10$500,000 to $749,999
- 12$2,000,000 or more
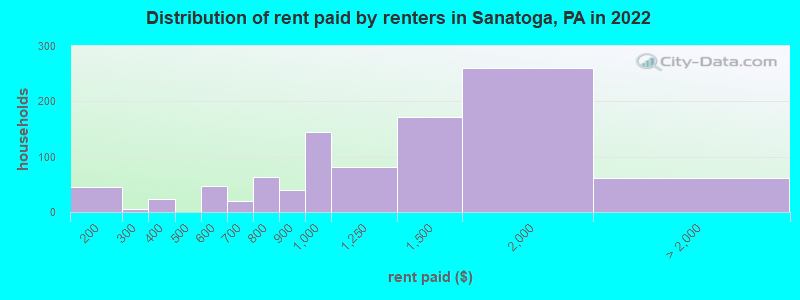
Rent paid by renters in 2022 in Sanatoga, PA
-
- 15$100 to $149
- 30$150 to $199
- 4$250 to $299
- 23$350 to $399
- 46$500 to $549
- 19$600 to $649
- 46$700 to $749
- 16$750 to $799
- 39$800 to $899
- 144$900 to $999
- 80$1,000 to $1,249
- 171$1,250 to $1,499
- 259$1,500 to $1,999
- 11$2,000 to $2,499
- 49No cash rent
Percentage of workers working in this county: 73.2%
Number of people working at home: 655 (15.4% of all workers)
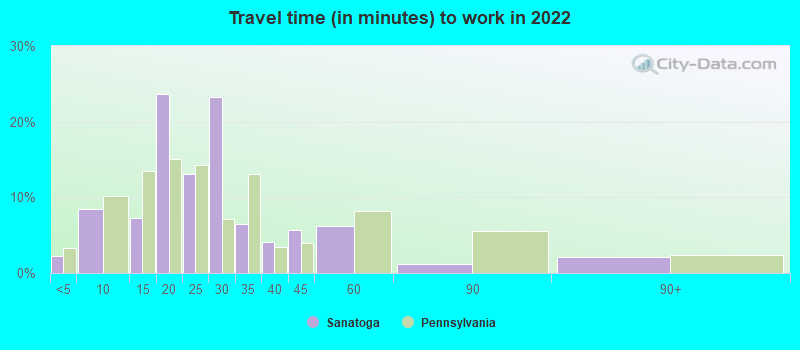
Travel time to work (commute)
- Less than 5 minutes: 128
- 5 to 9 minutes: 170
- 10 to 14 minutes: 480
- 15 to 19 minutes: 609
- 20 to 24 minutes: 367
- 25 to 29 minutes: 302
- 30 to 34 minutes: 367
- 35 to 39 minutes: 155
- 40 to 44 minutes: 317
- 45 to 59 minutes: 312
- 60 to 89 minutes: 216
- 90 or more minutes: 88
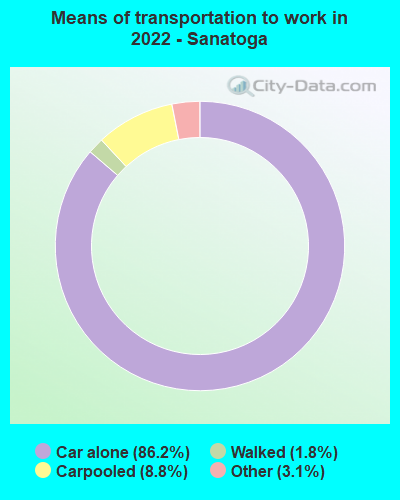
Means of transportation to work:
- Drove a car alone: 1,731 (66.0%)
- Carpooled: 184 (7.0%)
- Bus: 1 (0.0%)
- Taxi: 79 (3.0%)
- Walked: 36 (1.4%)
- Worked at home: 655 (25.0%)
- Unemployment by race in 2022
- Unemployment rate for White non-Hispanic residents
- 2.6%Males
- 2.7%Females
- Unemployment rate for Black residents
- 6.4%Males
- 11.3%Females
- Unemployment rate for Hispanic or Latino residents
- 33.2%Females
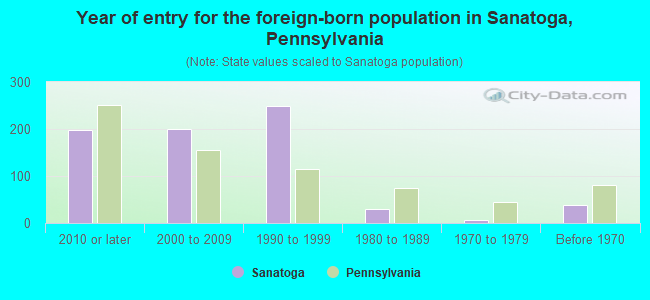
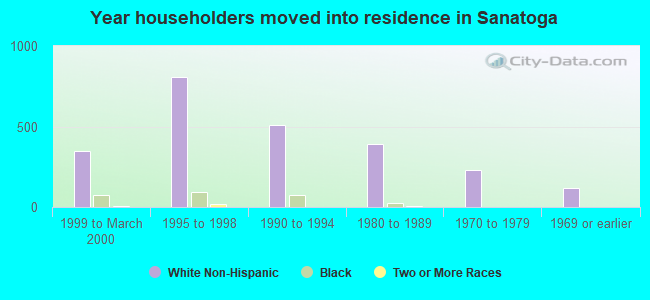
- Year of entry for the foreign-born population in Sanatoga, Pennsylvania
- 1972010 or later
- 1992000 to 2009
- 2501990 to 1999
- 301980 to 1989
- 61970 to 1979
- 38Before 1970
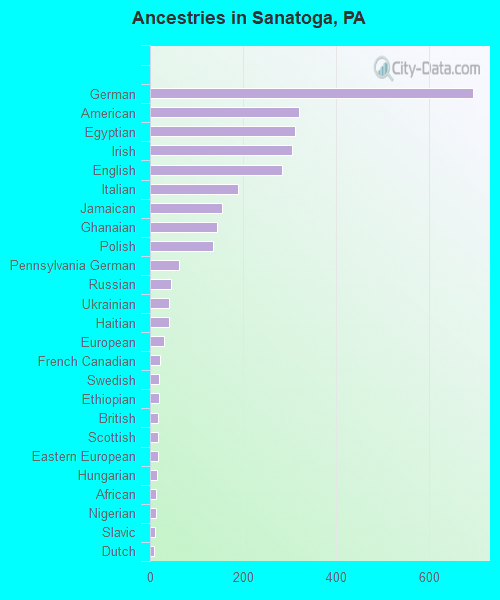
First ancestries reported:
- German: 695 (17.0%)
- American: 321 (7.8%)
- Egyptian: 312 (7.6%)
- Irish: 305 (7.4%)
- English: 284 (6.9%)
- Italian: 189 (4.6%)
- Jamaican: 156 (3.8%)
- Ghanaian: 144 (3.5%)
- Polish: 135 (3.3%)
- Pennsylvania German: 63 (1.5%)
- Russian: 46 (1.1%)
- Ukrainian: 40 (1.0%)
- Haitian: 40 (1.0%)
- European: 31 (0.8%)
- French Canadian: 22 (0.5%)
- Swedish: 20 (0.5%)
- Ethiopian: 19 (0.5%)
- British: 18 (0.4%)
- Scottish: 18 (0.4%)
- Eastern European: 17 (0.4%)
- Hungarian: 15 (0.4%)
- African: 13 (0.3%)
- Nigerian: 12 (0.3%)
- Slavic: 11 (0.3%)
- Dutch: 9 (0.2%)
- Slovak: 8 (0.2%)
- Welsh: 7 (0.2%)
Most common places of birth for foreign-born residents (%):
| Sanatoga: | 26.2% (190) |
| Pennsylvania: | 0.8% (7,272) |
| Sanatoga: | 20.4% (148) |
| Pennsylvania: | 10.7% (100,596) |
| Sanatoga: | 10.8% (78) |
| Pennsylvania: | 0.6% (5,368) |
| Sanatoga: | 5.5% (40) |
| Pennsylvania: | 2.4% (22,612) |
| Sanatoga: | 4.1% (30) |
| Pennsylvania: | 1.1% (10,709) |
| Sanatoga: | 4.0% (29) |
| Pennsylvania: | 1.1% (10,035) |
| Sanatoga: | 3.5% (25) |
| Pennsylvania: | 1.3% (12,172) |
| Sanatoga: | 3.3% (24) |
| Pennsylvania: | 2.9% (27,433) |
| Sanatoga: | 3.3% (24) |
| Pennsylvania: | 1.6% (15,224) |
| Sanatoga: | 2.8% (20) |
| Pennsylvania: | 0.1% (564) |
| Sanatoga: | 2.1% (15) |
| Pennsylvania: | 2.1% (19,841) |
| Sanatoga: | 1.5% (11) |
| Pennsylvania: | 0.5% (4,658) |
Place of birth for U.S.-born residents:
- This state: 6,966
- Other state: 1,200
- Northeast: 448
- Midwest: 204
- South: 447
- West: 104
85.9% of Sanatoga residents lived in the same house 1 years ago.
Out of people who lived in different houses, 35.5% lived in this county.
Out of people who lived in different counties, 97.7% lived in Pennsylvania.
| Sanatoga: | 85.9% |
| State average: | 89.3% |
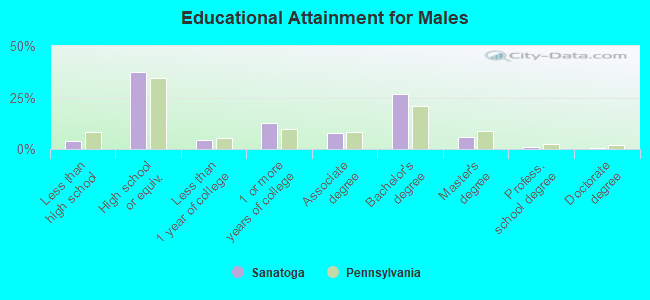
Education attainment for males 25 years and older:
- No schooling: 10
- Nursery to 4th grade: 0
- 5th and 6th grade: 0
- 7th and 8th grade: 27
- 9th grade: 7
- 10th grade: 4
- 11th grade: 14
- 12th grade, no diploma: 51
- High school graduate (or equivalency): 1,041
- Less than 1 year of college: 116
- Some college more than 1 year, no degree: 357
- Associate degree: 216
- Bachelor's degree: 744
- Master's degree: 165
- Professional school degree: 26
- Doctorate degree: 20
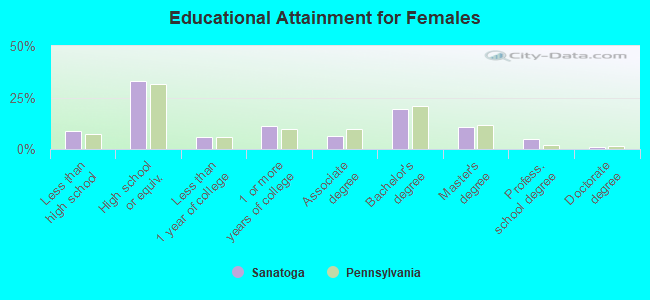
Education attainment for females 25 years and older:
- No schooling: 46
- Nursery to 4th grade: 0
- 5th and 6th grade: 0
- 7th and 8th grade: 35
- 9th grade: 47
- 10th grade: 56
- 11th grade: 34
- 12th grade, no diploma: 46
- High school graduate (or equivalency): 1,020
- Less than 1 year of college: 173
- Some college more than 1 year, no degree: 344
- Associate degree: 190
- Bachelor's degree: 594
- Master's degree: 331
- Professional school degree: 145
- Doctorate degree: 27


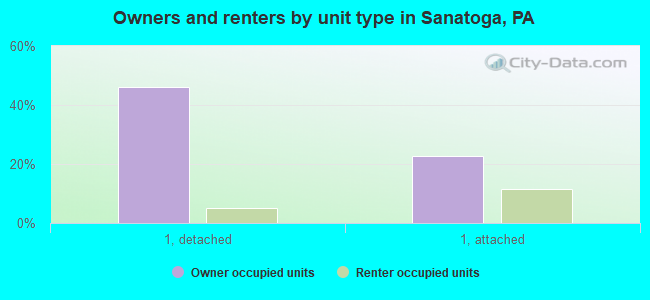
Housing units in structures:
- One, detached: 1,590
- One, attached: 1,333
- Two: 30
- 3 or 4: 27
- 5 to 9: 64
- 10 to 19: 24
- 20 to 49: 135
- 50 or more: 63
- Mobile homes: 92
- Boats, RVs, vans, etc.: 16
Housing units lacking complete kitchen facilities in 2022: 2.3%
House/condo owner moved in on average 14 years ago
Renter moved in on average 3 years ago
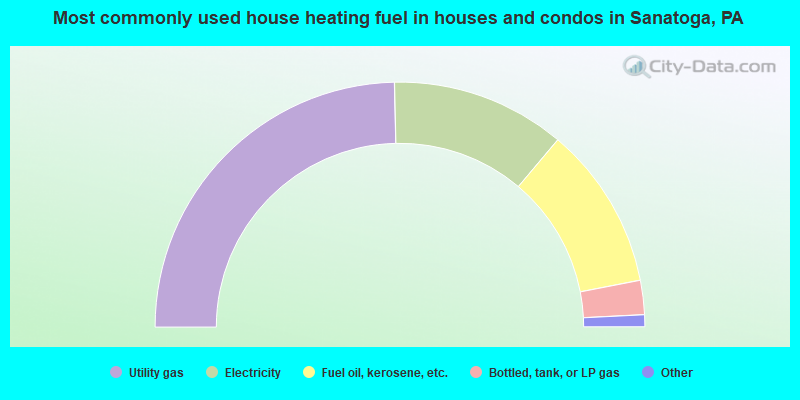
- 49.3%Utility gas
- 23.0%Electricity
- 21.6%Fuel oil, kerosene, etc.
- 4.5%Bottled, tank, or LP gas
- 0.9%Wood
- 0.6%Other fuel
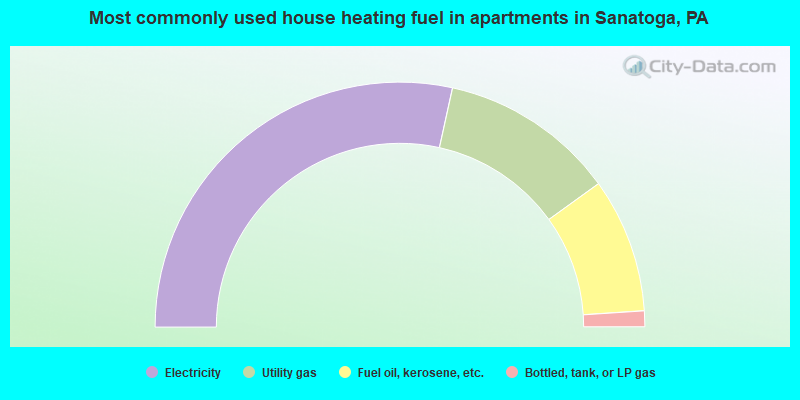
- 56.9%Electricity
- 23.2%Utility gas
- 17.8%Fuel oil, kerosene, etc.
- 2.1%Bottled, tank, or LP gas
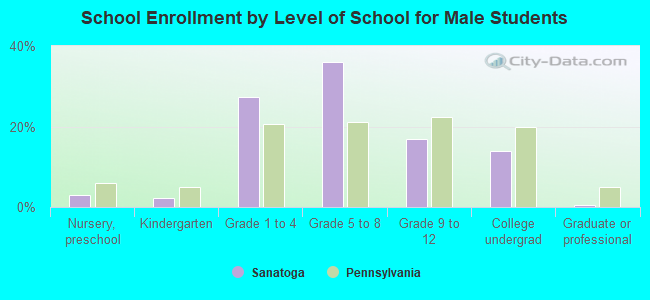
Private vs. public school enrollment:
| Here: | 6.9% |
| Pennsylvania: | 15.7% |
| Here: | 10.6% |
| Pennsylvania: | 13.4% |
| Here: | 36.2% |
| Pennsylvania: | 39.8% |