Santa Monica, CA (California) Houses and Residents
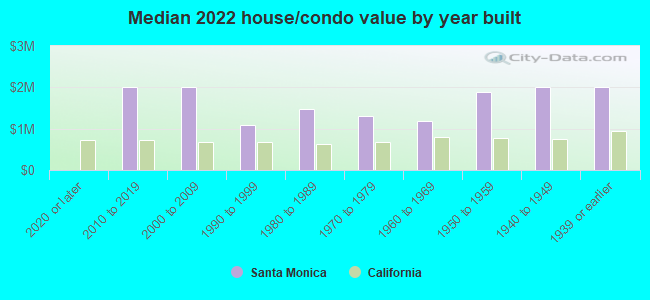
| Santa Monica: | $2,000,001 |
| California: | $715,900 |
Mean price in 2022:
Detached houses: $3,625,952
Here: $3,625,952 State: $988,808 Townhouses or other attached units: $1,586,556
Here: $1,586,556 State: $838,546 In 2-unit structures: $1,158,987
Here: $1,158,987 State: $1,138,100 In 3-to-4-unit structures: $2,010,731
Here: $2,010,731 State: $824,253 In 5-or-more-unit structures: $1,626,807
Here: $1,626,807 State: $730,996 Mobile homes: $321,025
Here: $321,025 State: $184,506
Total population: 92,987 (Urban population: 84,084, Rural population: 0)
Houses: 47,914 (43,189 occupied: 13,744 owner occupied, 29,445 renter occupied)
| % of renters here: | 68% |
| State: | 44% |
Housing density: 5,800 houses/condos per square mile
Median price asked for vacant for-sale houses and condos in 2022: $1,485,566.
Median contract rent in 2022: over $2,000 (lower quartile is $1,221, upper quartile is over $2,000)
Median rent asked for vacant for-rent units in 2022: $3,472
Median gross rent in Santa Monica, CA in 2022: over $2,000
Housing units in Santa Monica with a mortgage: 7,530 (1,153 second mortgage, 0 home equity loan, 682 both second mortgage and home equity loan)
Houses without a mortgage: 0
Median household income for houses/condos with a mortgage: $250,001
Median household income for apartments without a mortgage: $151,913
Median monthly housing costs: $2,278
Compare current foreclosures in Santa Monica, CA:
| Photo | Address | Area | Beds / Baths | Price | Details |
|---|---|---|---|---|---|

|
#1
Ozone Ave
Santa Monica, CA 90405
|
946 sq. feet
|
2 baths 4 beds |
show details | |

|
#2
Ashland Ave
Santa Monica, CA 90405
|
1,114 sq. feet
|
1 baths 2 beds |
show details | |

|
#3
33rd St
Santa Monica, CA 90405
|
2,246 sq. feet
|
3 baths 4 beds |
show details | |

|
#4
Broadway
Santa Monica, CA 90404
|
2,036 sq. feet
|
3 baths 4 beds |
show details | |

|
#5
11th St Apt 6
Santa Monica, CA 90404
|
1,716 sq. feet
|
3 baths 3 beds |
show details | |

|
#6
7th St
Santa Monica, CA 90401
|
- sq. feet
|
- baths - beds |
show details | |

|
#7
Colorado Ave
Santa Monica, CA 90401
|
- sq. feet
|
- baths - beds |
show details | |

|
#8
5th St Apt 503
Santa Monica, CA 90401
|
- sq. feet
|
- baths - beds |
show details | |

|
#9
20th St Apt 202
Santa Monica, CA 90403
|
- sq. feet
|
- baths - beds |
show details | |

|
#10
6th St # 6
Santa Monica, CA 90403
|
- sq. feet
|
- baths - beds |
show details |
| Photo | Address | Area | Beds / Baths | Price | Details |
|---|---|---|---|---|---|

|
#11
Ocean Park Blvd # 1077
Santa Monica, CA 90405
|
- sq. feet
|
- baths - beds |
show details | |

|
#12
Colorado Ave
Santa Monica, CA 90401
|
- sq. feet
|
- baths - beds |
show details | |

|
#13
7th St
Santa Monica, CA 90401
|
- sq. feet
|
- baths - beds |
show details | |

|
#14
1/2 3rd St
Santa Monica, CA 90408
|
- sq. feet
|
- baths - beds |
show details | |

|
#15
Strand St # B
Santa Monica, CA 90405
|
- sq. feet
|
- baths - beds |
show details | |

|
#16
California Ave Apt 218
Santa Monica, CA 90403
|
- sq. feet
|
- baths - beds |
show details | |

|
#17
Ocean Ave Apt 411
Santa Monica, CA 90401
|
- sq. feet
|
- baths - beds |
show details | |

|
#18
Princeton St Apt A
Santa Monica, CA 90404
|
- sq. feet
|
- baths - beds |
show details | |

|
#19
Ocean Ave Apt 204
Santa Monica, CA 90405
|
- sq. feet
|
- baths - beds |
show details | |

|
#20
Broadway # 1224
Santa Monica, CA 90401
|
- sq. feet
|
- baths - beds |
show details |
| Photo | Address | Area | Beds / Baths | Price | Details |
|---|---|---|---|---|---|

|
#21
Colorado Ave
Santa Monica, CA 90401
|
- sq. feet
|
- baths - beds |
show details | |

|
#22
Bay St Apt B
Santa Monica, CA 90405
|
- sq. feet
|
- baths - beds |
show details | |

|
#23
Lincoln Blvd # 308
Santa Monica, CA 90404
|
- sq. feet
|
- baths - beds |
show details | |

|
#24
Ocean Ave Apt 120
Santa Monica, CA 90401
|
- sq. feet
|
- baths - beds |
show details | |

|
#25
Santa Monica Blvd Ste 300
Santa Monica, CA 90401
|
- sq. feet
|
- baths - beds |
show details | |

|
#26
Oak St Apt C
Santa Monica, CA 90405
|
- sq. feet
|
- baths - beds |
show details | |

|
#27
Berkeley St # 3
Santa Monica, CA 90404
|
- sq. feet
|
- baths - beds |
show details | |

|
#28
Berkeley St # 3
Santa Monica, CA 90404
|
- sq. feet
|
- baths - beds |
show details | |

|
#29
22nd St Unit A
Santa Monica, CA 90403
|
- sq. feet
|
- baths - beds |
show details | |

|
#30
Neilson Way Unit 5573
Santa Monica, CA 90409
|
- sq. feet
|
- baths - beds |
show details |
| Photo | Address | Area | Beds / Baths | Price | Details |
|---|---|---|---|---|---|

|
#31
Wilshire Blvd # 290
Santa Monica, CA 90403
|
- sq. feet
|
- baths - beds |
show details | |

|
#32
Broadway # 441
Santa Monica, CA 90401
|
- sq. feet
|
- baths - beds |
show details | |

|
#33
Broadway
Santa Monica, CA 90401
|
- sq. feet
|
- baths - beds |
show details | |

|
#34
3rd St
Santa Monica, CA 90405
|
- sq. feet
|
- baths - beds |
show details | |

|
#35
11th St Apt 4
Santa Monica, CA 90401
|
- sq. feet
|
- baths - beds |
show details | |

|
#36
Lincoln Blvd Ste 310
Santa Monica, CA 90404
|
- sq. feet
|
- baths - beds |
show details | |

|
#37
Beach St
Santa Monica, CA 90405
|
- sq. feet
|
- baths - beds |
show details | |

|
#38
4th St Apt 108
Santa Monica, CA 90403
|
- sq. feet
|
- baths - beds |
show details | |

|
#39
Centinela Ave Apt B
Santa Monica, CA 90404
|
- sq. feet
|
- baths - beds |
show details | |

|
#40
Euclid St # 4
Santa Monica, CA 90403
|
- sq. feet
|
10 baths - beds |
show details |
| Photo | Address | Area | Beds / Baths | Price | Details |
|---|---|---|---|---|---|

|
#41
Princeton St Apt 204
Santa Monica, CA 90404
|
- sq. feet
|
- baths - beds |
show details | |

|
#42
Pier Ave # 435
Santa Monica, CA 90405
|
- sq. feet
|
- baths - beds |
show details | |

|
#43
18th Ct Apt 302
Santa Monica, CA 90404
|
- sq. feet
|
- baths - beds |
show details | |

|
#44
Marine St Apt A
Santa Monica, CA 90405
|
- sq. feet
|
- baths - beds |
show details | |

|
#45
12th St
Santa Monica, CA 90401
|
- sq. feet
|
- baths - beds |
show details | |

|
#46
Montana Ave Ste 13
Santa Monica, CA 90403
|
- sq. feet
|
- baths - beds |
show details | |

|
Check over 1 million property listings on Foreclosure.com!
|
browse all offers | |||


Median year apartment built: 1968
Household type by relationship:
Households: 89,951- Male householders: 18,141 (6,468 living alone), Female householders: 25,048 (11,504 living alone)
14,780 spouses (13,926 opposite-sex spouses), 3,893 unmarried partners, (3,835 opposite-sex unmarried partners), 18,266 children (17,241 natural, 801 adopted, 224 stepchildren), 1,210 grandchildren, 483 brothers or sisters, 807 parents, 89 foster children, 1,520 other relatives, 3,620 non-relatives
- In group quarters: 2,094
Size of family households: 10,007 2-persons, 5,038 3-persons, 4,466 4-persons, 686 5-persons, 144 6-persons.
Size of nonfamily households: 17,972 1-person, 4,335 2-persons, 541 3-persons.
8,759 married couples with children.
3,219 single-parent households (894 men, 2,325 women).
74.0% of residents of Santa Monica speak English at home.
11.0% of residents speak Spanish at home (73% speak English very well, 14% speak English well, 10% speak English not well, 3% don't speak English at all).
7.9% of residents speak other Indo-European language at home (73% speak English very well, 15% speak English well, 7% speak English not well, 4% don't speak English at all).
5.4% of residents speak Asian or Pacific Island language at home (61% speak English very well, 22% speak English well, 14% speak English not well, 3% don't speak English at all).
2.5% of residents speak other language at home (66% speak English very well, 14% speak English well, 19% speak English not well, 1% don't speak English at all).
Foreign born population: 21,268 (23.6%)
(69.2% of them are naturalized citizens)
| Here: | 5.4 |
| State: | 6.0 |
| Here: | 3.6 |
| State: | 3.9 |
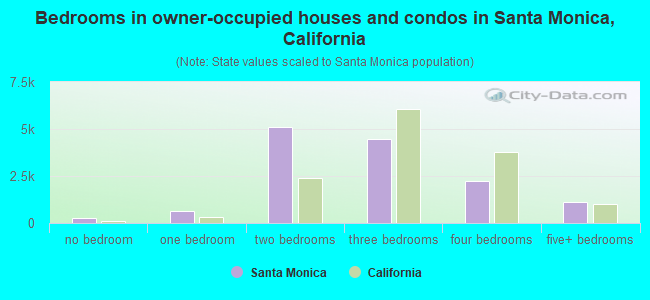
- Bedrooms in owner-occupied houses and condos in Santa Monica, California
- 242no bedroom
- 6231 bedroom
- 5,0922 bedrooms
- 4,4473 bedrooms
- 2,2364 bedrooms
- 1,1045+ bedrooms
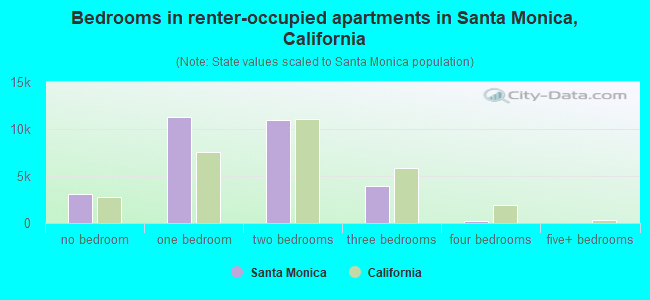
- Bedrooms in renter-occupied apartments in Santa Monica, California
- 3,110no bedroom
- 11,2991 bedroom
- 10,9192 bedrooms
- 3,8953 bedrooms
- 1714 bedrooms
- 515+ bedrooms
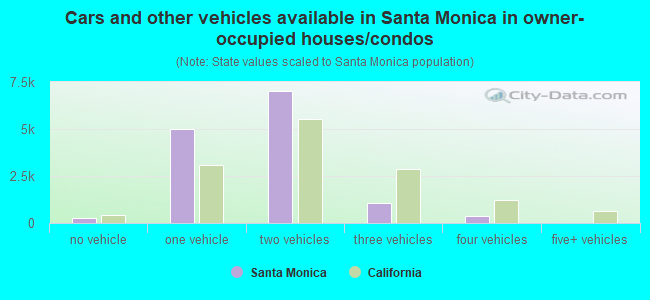
- Cars and other vehicles available in Santa Monica in owner-occupied houses/condos
- 278no vehicle
- 4,9801 vehicle
- 7,0342 vehicles
- 1,0553 vehicles
- 3974 vehicles
- 05+ vehicles
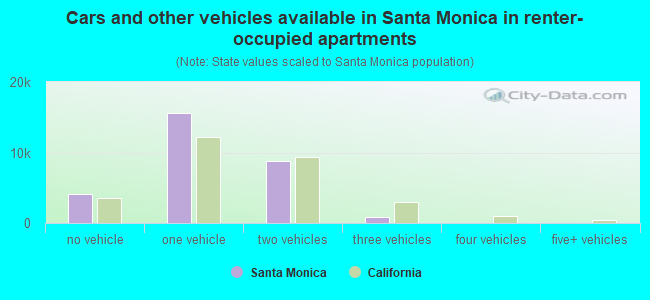
- Cars and other vehicles available in Santa Monica in renter-occupied apartments
- 4,123no vehicle
- 15,6721 vehicle
- 8,7462 vehicles
- 8343 vehicles
- 704 vehicles
- 05+ vehicles
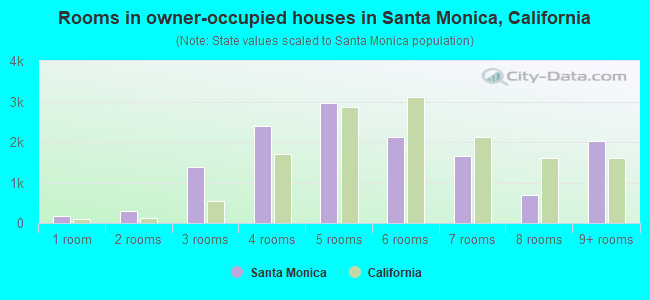
- Rooms in owner-occupied houses in Santa Monica, California
- 1751 room
- 2892 rooms
- 1,3913 rooms
- 2,3984 rooms
- 2,9655 rooms
- 2,1256 rooms
- 1,6667 rooms
- 6998 rooms
- 2,0369+ rooms
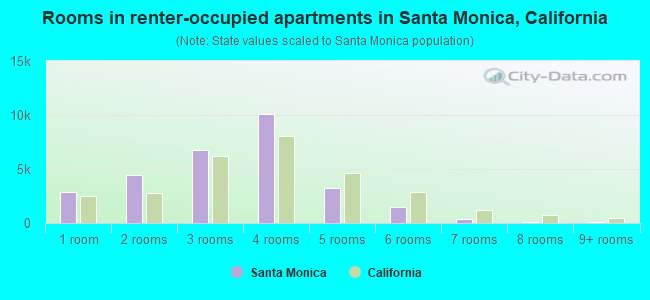
- Rooms in renter-occupied apartments in Santa Monica, California
- 2,8471 room
- 4,4172 rooms
- 6,7803 rooms
- 10,0644 rooms
- 3,2565 rooms
- 1,5256 rooms
- 3337 rooms
- 1288 rooms
- 959+ rooms
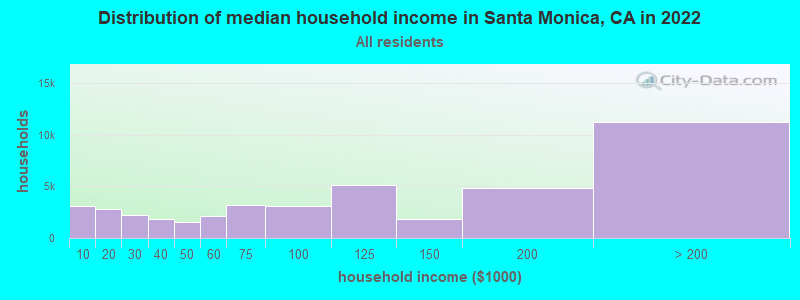
Santa Monica, CA household income distribution

- 3,133Less than $10,000
- 2,770$10,000 to $19,999
- 2,268$20,000 to $29,999
- 1,864$30,000 to $39,999
- 1,563$40,000 to $49,999
- 2,132$50,000 to $59,999
- 3,191$60,000 to $74,999
- 3,120$75,000 to $99,999
- 5,168$100,000 to $124,999
- 1,881$125,000 to $149,999
- 4,856$150,000 to $199,999
- 11,243$200,000 or more
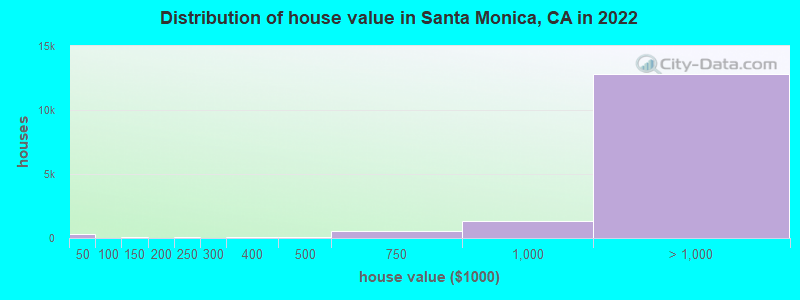
Home value of owner - occupied houses in 2022 in Santa Monica, CA
-
- 268Less than $10,000
- 18$10,000 to $14,999
- 13$25,000 to $29,999
- 29$35,000 to $39,999
- 38$80,000 to $89,999
- 71$100,000 to $124,999
- 3$175,000 to $199,999
- 83$200,000 to $249,999
- 20$250,000 to $299,999
- 45$300,000 to $399,999
- 113$400,000 to $499,999
- 580$500,000 to $749,999
- 1,357$750,000 to $999,999
- 3,748$1,000,000 to $1,499,999
- 2,490$1,500,000 to $1,999,999
- 6,581$2,000,000 or more
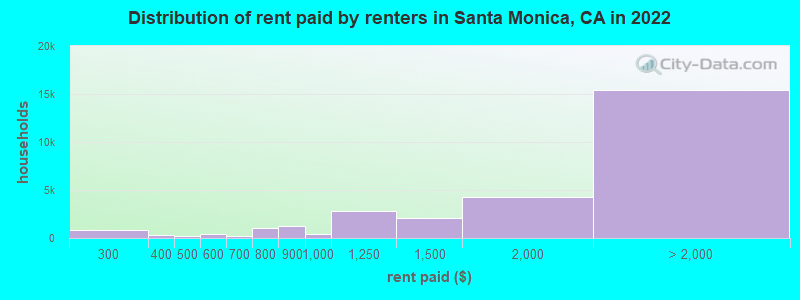
Rent paid by renters in 2022 in Santa Monica, CA
-
- 676$200 to $249
- 208$250 to $299
- 242$300 to $349
- 69$350 to $399
- 169$400 to $449
- 370$500 to $549
- 80$550 to $599
- 205$600 to $649
- 45$650 to $699
- 446$700 to $749
- 562$750 to $799
- 1,278$800 to $899
- 405$900 to $999
- 2,856$1,000 to $1,249
- 2,073$1,250 to $1,499
- 4,297$1,500 to $1,999
- 4,716$2,000 to $2,499
- 2,845$2,500 to $2,999
- 1,567$3,000 to $3,499
- 6,006$3,500 or more
- 330No cash rent
Percentage of workers working in this county: 95.4%
Number of people working at home: 17,732 (35.9% of all workers)
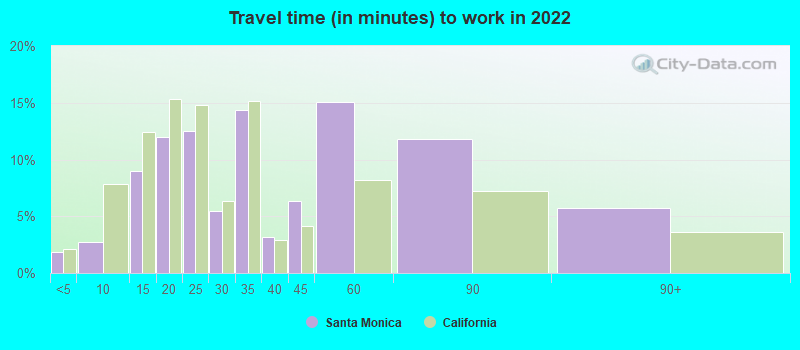
Travel time to work (commute)
- Less than 5 minutes: 540
- 5 to 9 minutes: 1,359
- 10 to 14 minutes: 5,799
- 15 to 19 minutes: 4,884
- 20 to 24 minutes: 4,487
- 25 to 29 minutes: 2,468
- 30 to 34 minutes: 3,800
- 35 to 39 minutes: 1,460
- 40 to 44 minutes: 1,422
- 45 to 59 minutes: 1,756
- 60 to 89 minutes: 1,632
- 90 or more minutes: 60
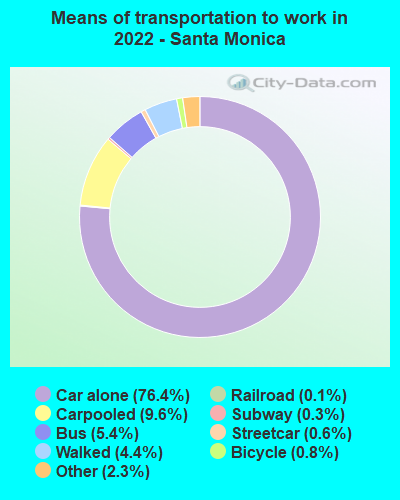
Means of transportation to work:
- Drove a car alone: 59,479 (61.8%)
- Carpooled: 7,476 (7.8%)
- Bus: 4,236 (4.4%)
- Subway or elevated rail: 453 (0.5%)
- Long-distance train or commuter rail: 256 (0.3%)
- Light rail, streetcar or trolley: 113 (0.1%)
- Taxi: 1,786 (1.9%)
- Bicycle: 641 (0.7%)
- Walked: 3,447 (3.6%)
- Worked at home: 18,324 (19.0%)
- Unemployment by race in 2022
- Unemployment rate for White non-Hispanic residents
- 2.6%Males
- 4.4%Females
- Unemployment rate for Black residents
- 20.4%Males
- 8.6%Females
- Unemployment rate for American Indian and Alaska Native residents
- 4.7%Males
- 3.8%Females
- Unemployment rate for Asian residents
- 1.9%Males
- 1.6%Females
- Unemployment rate for other race residents
- 4.7%Males
- 5.2%Females
- Unemployment rate for two or more race residents
- 5.5%Males
- 1.3%Females
- Unemployment rate for Hispanic or Latino residents
- 1.6%Males
- 1.3%Females
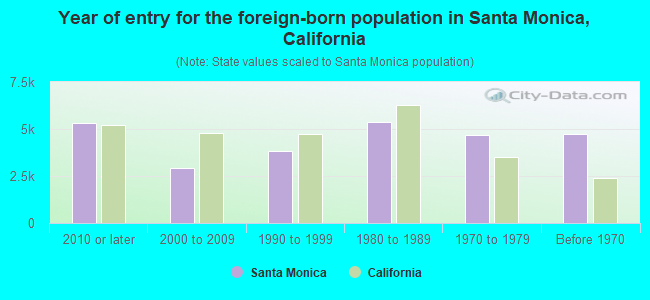
- Year of entry for the foreign-born population in Santa Monica, California
- 5,3092010 or later
- 2,9512000 to 2009
- 3,8491990 to 1999
- 5,3961980 to 1989
- 4,6701970 to 1979
- 4,713Before 1970
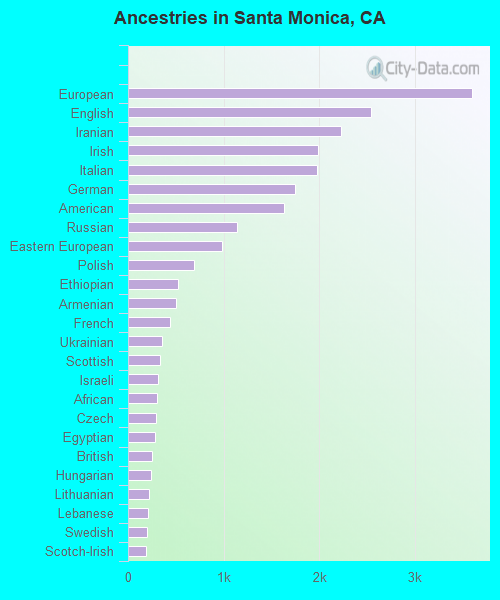
First ancestries reported:
- European: 3,595 (7.9%)
- English: 2,541 (5.6%)
- Iranian: 2,228 (4.9%)
- Irish: 1,982 (4.4%)
- Italian: 1,981 (4.4%)
- German: 1,748 (3.9%)
- American: 1,629 (3.6%)
- Russian: 1,141 (2.5%)
- Eastern European: 986 (2.2%)
- Polish: 689 (1.5%)
- Ethiopian: 528 (1.2%)
- Armenian: 499 (1.1%)
- French: 439 (1.0%)
- Ukrainian: 359 (0.8%)
- Scottish: 330 (0.7%)
- Israeli: 314 (0.7%)
- African: 306 (0.7%)
- Czech: 298 (0.7%)
- Egyptian: 278 (0.6%)
- British: 248 (0.5%)
- Hungarian: 237 (0.5%)
- Lithuanian: 218 (0.5%)
- Lebanese: 212 (0.5%)
- Swedish: 201 (0.4%)
- Scotch-Irish: 184 (0.4%)
- Dutch: 182 (0.4%)
- Turkish: 181 (0.4%)
- Danish: 170 (0.4%)
- Jamaican: 150 (0.3%)
- Norwegian: 143 (0.3%)
- Serbian: 141 (0.3%)
- Greek: 134 (0.3%)
- Romanian: 134 (0.3%)
- Brazilian: 127 (0.3%)
- Belizean: 115 (0.3%)
- French Canadian: 113 (0.2%)
- Canadian: 110 (0.2%)
- Austrian: 100 (0.2%)
- Australian: 96 (0.2%)
- Portuguese: 91 (0.2%)
- Scandinavian: 88 (0.2%)
- Nigerian: 74 (0.2%)
- Finnish: 63 (0.1%)
- Arab: 51 (0.1%)
- Croatian: 48 (0.1%)
- Northern European: 47 (0.1%)
- Bulgarian: 35 (0.08%)
- Welsh: 34 (0.07%)
- Albanian: 33 (0.07%)
- Guyanese: 31 (0.07%)
- Swiss: 28 (0.06%)
- Trinidadian and Tobagonian: 22 (0.05%)
- Czechoslovakian: 20 (0.04%)
- New Zealander: 18 (0.04%)
- Haitian: 15 (0.03%)
- Latvian: 15 (0.03%)
- Yugoslavian: 12 (0.03%)
- Slovak: 8 (0.02%)
- Soviet Union: 4 (0.01%)
Most common places of birth for foreign-born residents (%):
| Santa Monica: | 13.5% (2,727) |
| California: | 37.2% (3,881,193) |
| Santa Monica: | 8.6% (1,726) |
| California: | 2.0% (206,004) |
| Santa Monica: | 5.5% (1,108) |
| California: | 6.6% (684,672) |
| Santa Monica: | 3.9% (793) |
| California: | 3.0% (315,248) |
| Santa Monica: | 3.7% (752) |
| California: | 0.6% (60,582) |
| Santa Monica: | 3.4% (690) |
| California: | 0.7% (71,932) |
| Santa Monica: | 3.4% (690) |
| California: | 1.2% (127,477) |
| Santa Monica: | 3.3% (664) |
| California: | 1.0% (103,575) |
| Santa Monica: | 3.1% (629) |
| California: | 0.6% (57,953) |
| Santa Monica: | 2.5% (500) |
| California: | 0.2% (23,338) |
| Santa Monica: | 2.5% (500) |
| California: | 5.2% (539,184) |
| Santa Monica: | 2.1% (426) |
| California: | 7.8% (818,297) |
| Santa Monica: | 2.0% (402) |
| California: | 0.2% (24,635) |
| Santa Monica: | 2.0% (401) |
| California: | 0.7% (73,304) |
| Santa Monica: | 1.9% (389) |
| California: | 0.6% (60,761) |
| Santa Monica: | 1.8% (365) |
| California: | 0.2% (20,614) |
| Santa Monica: | 1.7% (349) |
| California: | 4.2% (440,287) |
| Santa Monica: | 1.7% (348) |
| California: | 0.4% (40,224) |
| Santa Monica: | 1.6% (318) |
| California: | 0.4% (42,718) |
| Santa Monica: | 1.5% (310) |
| California: | 2.8% (290,436) |
| Santa Monica: | 1.5% (308) |
| California: | 1.7% (176,274) |
| Santa Monica: | 1.5% (307) |
| California: | 0.3% (33,960) |
Place of birth for U.S.-born residents:
- This state: 37,240
- Other state: 29,782
- Northeast: 13,254
- Midwest: 8,339
- South: 5,333
- West: 2,856
87.5% of Santa Monica residents lived in the same house 1 years ago.
Out of people who lived in different houses, 40.1% lived in this county.
Out of people who lived in different counties, 47.4% lived in California.
| Santa Monica: | 87.5% |
| State average: | 88.9% |
Education attainment for males 25 years and older:
- No schooling: 400
- Nursery to 4th grade: 191
- 5th and 6th grade: 118
- 7th and 8th grade: 0
- 9th grade: 254
- 10th grade: 117
- 11th grade: 0
- 12th grade, no diploma: 656
- High school graduate (or equivalency): 3,796
- Less than 1 year of college: 924
- Some college more than 1 year, no degree: 2,353
- Associate degree: 1,890
- Bachelor's degree: 11,530
- Master's degree: 5,215
- Professional school degree: 2,862
- Doctorate degree: 1,831

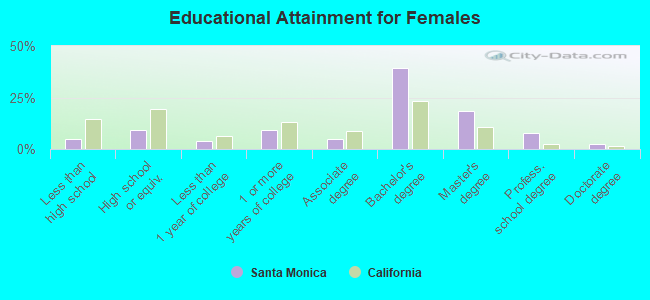
Education attainment for females 25 years and older:
- No schooling: 394
- Nursery to 4th grade: 293
- 5th and 6th grade: 145
- 7th and 8th grade: 84
- 9th grade: 216
- 10th grade: 71
- 11th grade: 135
- 12th grade, no diploma: 495
- High school graduate (or equivalency): 3,634
- Less than 1 year of college: 1,416
- Some college more than 1 year, no degree: 3,637
- Associate degree: 1,883
- Bachelor's degree: 15,050
- Master's degree: 7,002
- Professional school degree: 3,043
- Doctorate degree: 933
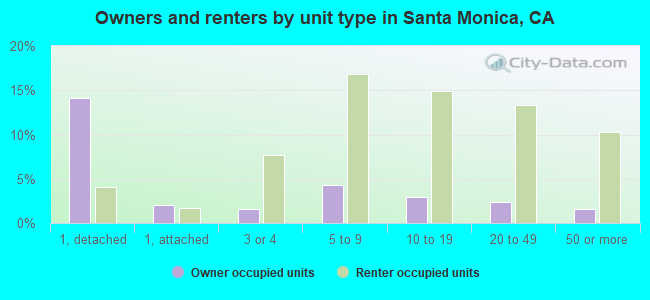
Housing units in structures:
- One, detached: 11,966
- One, attached: 1,025
- Two: 346
- 3 or 4: 4,599
- 5 to 9: 8,849
- 10 to 19: 8,098
- 20 to 49: 6,278
- 50 or more: 6,610
- Mobile homes: 143
Housing units lacking complete kitchen facilities in 2022: 1.6%
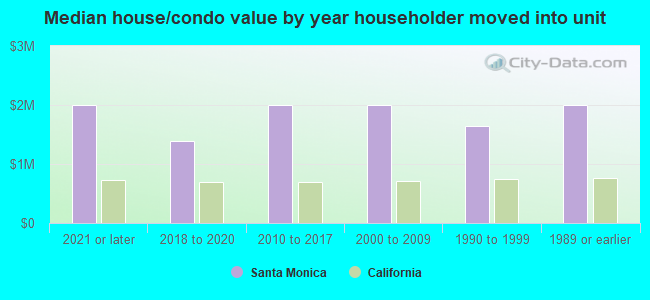
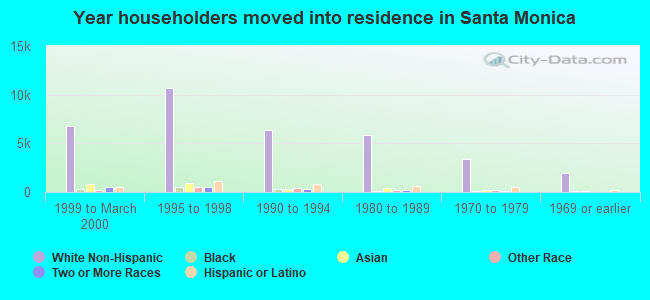
House/condo owner moved in on average 16 years ago
Renter moved in on average 6 years ago
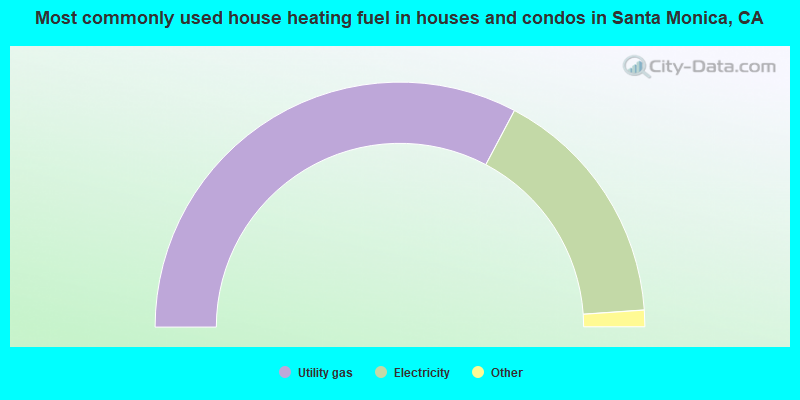
- 65.5%Utility gas
- 32.3%Electricity
- 0.9%No fuel used
- 0.9%Bottled, tank, or LP gas
- 0.4%Solar energy
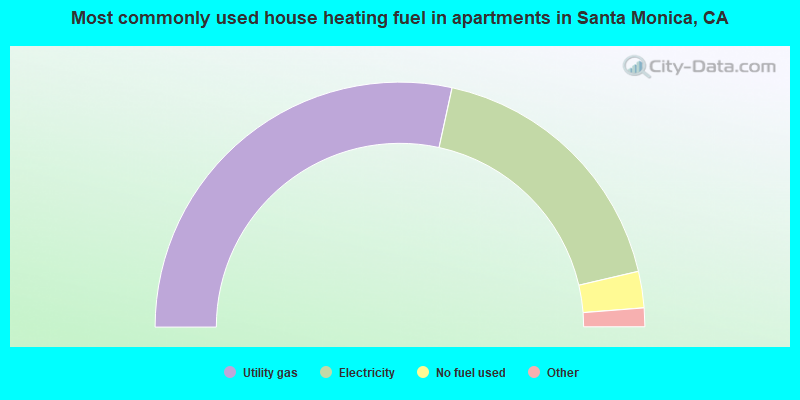
- 56.9%Utility gas
- 35.9%Electricity
- 4.8%No fuel used
- 1.9%Bottled, tank, or LP gas
- 0.4%Other fuel
- 0.1%Wood
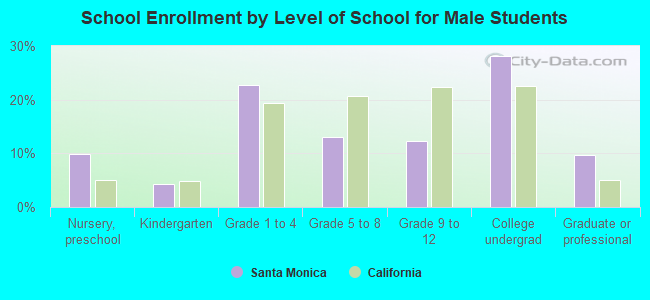
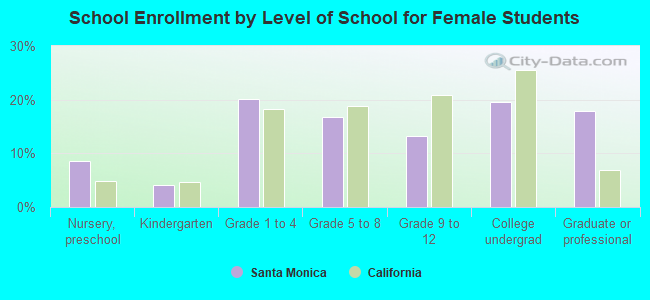
Private vs. public school enrollment:
| Here: | 19.3% |
| California: | 10.5% |
| Here: | 33.1% |
| California: | 8.5% |
| Here: | 11.1% |
| California: | 15.9% |