Santa Paula, CA (California) Houses and Residents
| Santa Paula: | $575,493 |
| California: | $715,900 |
Mean price in 2022:
Detached houses: $714,067
Here: $714,067 State: $988,808 Townhouses or other attached units: $447,040
Here: $447,040 State: $838,546 In 2-unit structures: $213,205
Here: $213,205 State: $1,138,100 In 3-to-4-unit structures: $416,730
Here: $416,730 State: $824,253 In 5-or-more-unit structures: $235,105
Here: $235,105 State: $730,996 Mobile homes: $144,568
Here: $144,568 State: $184,506
Total population: 30,441 (Urban population: 28,601 (all inside urban clusters), Rural population: 30 (all nonfarm))
Houses: 9,769 (9,256 occupied: 4,887 owner occupied, 4,385 renter occupied)
| % of renters here: | 47% |
| State: | 44% |
Housing density: 2,123 houses/condos per square mile
Median price asked for vacant for-sale houses and condos in 2022: $683,462.
Median contract rent in 2022: $1,441 (lower quartile is $1,163, upper quartile is $1,823)
Median rent asked for vacant for-rent units in 2022: $1,409
Median gross rent in Santa Paula, CA in 2022: $1,671
Housing units in Santa Paula with a mortgage: 2,916 (115 second mortgage, 18 home equity loan, 39 both second mortgage and home equity loan)
Houses without a mortgage: 92
Median household income for houses/condos with a mortgage: $108,465
Median household income for apartments without a mortgage: $73,673
Median monthly housing costs: $1,604
Compare current foreclosures near Santa Paula, CA:
| Photo | Address | Area | Beds / Baths | Price | Details |
|---|---|---|---|---|---|

|
#1
Sycamore St
Santa Paula, CA 93060
|
720 sq. feet
|
1 baths 2 beds |
show details | |

|
#2
Elizabeth Ct
Santa Paula, CA 93060
|
1,381 sq. feet
|
2 baths 3 beds |
show details | |

|
#3
Pinehill Ln
Santa Paula, CA 93060
|
1,682 sq. feet
|
3 baths 3 beds |
show details | |

|
#4
N Palm Ave
Santa Paula, CA 93060
|
1,202 sq. feet
|
1 baths 3 beds |
show details | |

|
#5
Jubilee Pl
Santa Paula, CA 93060
|
1,860 sq. feet
|
3 baths 3 beds |
show details | |

|
#6
Garcia St
Santa Paula, CA 93060
|
1,461 sq. feet
|
2 baths 3 beds |
show details | |

|
#7
Center Ln
Santa Paula, CA 93060
|
1,250 sq. feet
|
2 baths 3 beds |
show details | |

|
#8
E Orchard St
Santa Paula, CA 93060
|
1,239 sq. feet
|
2 baths 3 beds |
show details | |

|
#9
E Pleasant St
Santa Paula, CA 93060
|
1,997 sq. feet
|
1 baths 3 beds |
show details | |

|
#10
Acacia Rd
Santa Paula, CA 93060
|
1,616 sq. feet
|
2 baths 3 beds |
show details |
| Photo | Address | Area | Beds / Baths | Price | Details |
|---|---|---|---|---|---|

|
#11
Prieto St
Santa Paula, CA 93060
|
850 sq. feet
|
1 baths 2 beds |
show details | |

|
#12
Amber Dr
Santa Paula, CA 93060
|
2,333 sq. feet
|
2 baths 4 beds |
show details | |

|
#13
Lucada St
Santa Paula, CA 93060
|
1,216 sq. feet
|
1 baths 2 beds |
show details | |

|
#14
Corte Granada
Santa Paula, CA 93060
|
2,020 sq. feet
|
3 baths 4 beds |
show details | |

|
#15
Dana Dr
Santa Paula, CA 93060
|
1,614 sq. feet
|
2 baths 2 beds |
show details | |

|
#16
E Santa Paula St
Santa Paula, CA 93060
|
2,501 sq. feet
|
- baths - beds |
show details | |

|
#17
Alder Ct
Santa Paula, CA 93060
|
- sq. feet
|
- baths - beds |
show details | |

|
#18
W Telegraph Rd Spc 9w
Santa Paula, CA 93060
|
- sq. feet
|
- baths - beds |
show details | |

|
#19
Saticoy St
Santa Paula, CA 93060
|
1,385 sq. feet
|
- baths - beds |
show details | |

|
#20
Larmon Loop
Santa Paula, CA 93060
|
- sq. feet
|
- baths - beds |
show details |
| Photo | Address | Area | Beds / Baths | Price | Details |
|---|---|---|---|---|---|

|
#21
S Steckel Dr Apt C
Santa Paula, CA 93060
|
- sq. feet
|
- baths - beds |
show details | |

|
#22
W Telegraph Rd Spc B49
Santa Paula, CA 93060
|
- sq. feet
|
- baths - beds |
show details | |

|
#23
12 Sycamore St
Santa Paula, CA 93060
|
- sq. feet
|
- baths - beds |
show details | |

|
#24
S 12th St # 768
Santa Paula, CA 93060
|
- sq. feet
|
- baths - beds |
show details | |

|
#25
Acacia Rd
Santa Paula, CA 93060
|
- sq. feet
|
- baths - beds |
show details | |

|
#26
Meyer Ct
Santa Paula, CA 93060
|
- sq. feet
|
- baths - beds |
show details | |

|
#27
Campus Park Dr Apt A
Moorpark, CA 93021
|
1,029 sq. feet
|
2 baths 2 beds |
show details | |

|
#28
Islander Walk
Oxnard, CA 93035
|
1,283 sq. feet
|
2 baths 2 beds |
show details | |

|
#29
Kernvale Ave
Moorpark, CA 93021
|
1,172 sq. feet
|
2 baths 2 beds |
show details | |

|
#30
Upper Bay Dr
Oxnard, CA 93036
|
1,689 sq. feet
|
2 baths 3 beds |
show details |
| Photo | Address | Area | Beds / Baths | Price | Details |
|---|---|---|---|---|---|

|
#31
Katherine Ave
Ventura, CA 93003
|
1,981 sq. feet
|
3 baths 5 beds |
show details | |

|
#32
Elmhurst St
Ventura, CA 93003
|
2,629 sq. feet
|
3 baths 5 beds |
show details | |

|
#33
La Paloma Cir
Thousand Oaks, CA 91360
|
956 sq. feet
|
1 baths 2 beds |
show details | |

|
#34
Saratoga Ave Unit 606
Ventura, CA 93003
|
963 sq. feet
|
2 baths 2 beds |
show details | |

|
#35
Hillrose Pl
Oxnard, CA 93036
|
2,362 sq. feet
|
3 baths 4 beds |
show details | |

|
#36
S L St
Oxnard, CA 93033
|
1,128 sq. feet
|
2 baths 3 beds |
show details | |

|
#37
Via Marina Ct
Oxnard, CA 93035
|
1,739 sq. feet
|
2 baths 3 beds |
show details | |

|
#38
Saratoga Ave Unit 112
Ventura, CA 93003
|
1,135 sq. feet
|
2 baths 3 beds |
show details | |

|
#39
Clearcreek Ct
Moorpark, CA 93021
|
1,978 sq. feet
|
2 baths 3 beds |
show details | |

|
#40
Shenandoah St
Ventura, CA 93003
|
903 sq. feet
|
1 baths 2 beds |
show details |
| Photo | Address | Area | Beds / Baths | Price | Details |
|---|---|---|---|---|---|

|
#41
Grand Ave
Ventura, CA 93003
|
1,815 sq. feet
|
3 baths 3 beds |
show details | |

|
#42
Mira Sol Dr
Moorpark, CA 93021
|
1,644 sq. feet
|
2 baths 3 beds |
show details | |

|
#43
Edgar Ct
Newbury Park, CA 91320
|
1,956 sq. feet
|
3 baths 4 beds |
show details | |

|
#44
Northbrook Dr
Oxnard, CA 93036
|
2,333 sq. feet
|
3 baths 4 beds |
show details | |

|
#45
Tulane Ave
Ventura, CA 93003
|
1,543 sq. feet
|
2 baths 3 beds |
show details | |

|
#46
Corte Primavera
Oxnard, CA 93030
|
1,261 sq. feet
|
3 baths 3 beds |
show details | |

|
#47
Callas Dr
Oxnard, CA 93035
|
2,469 sq. feet
|
3 baths 5 beds |
show details | |

|
#48
Ribera Dr
Oxnard, CA 93030
|
2,419 sq. feet
|
3 baths 4 beds |
show details | |

|
#49
Village 26
Camarillo, CA 93012
|
1,070 sq. feet
|
2 baths 2 beds |
show details | |

|
Check over 1 million property listings on Foreclosure.com!
|
browse all offers | |||


 | Looking for quiet place in Ventura (9 replies) |
| Differences in Camarillo and Thousand Oaks (38 replies) |
| Safe Community in Ventura with Great Air Quality? (5 replies) |
| methods other than craigslist how2 find a guest house in Ventura county (1 reply) |
| Downtown Santa Paula vs. Downtown Oxnard (27 replies) |
| Possible relocation to near Santa Barbara (2 replies) |

Median year apartment built: 1970
Household type by relationship:
Households: 30,444- Male householders: 4,472 (834 living alone), Female householders: 4,599 (1,051 living alone)
4,752 spouses (4,752 opposite-sex spouses), 577 unmarried partners, (554 opposite-sex unmarried partners), 11,382 children (10,900 natural, 75 adopted, 406 stepchildren), 940 grandchildren, 780 brothers or sisters, 737 parents, 0 foster children, 827 other relatives, 1,223 non-relatives
- In group quarters: 151
Size of family households: 2,148 2-persons, 1,138 3-persons, 1,796 4-persons, 1,006 5-persons, 352 6-persons, 537 7-or-more-persons.
Size of nonfamily households: 1,908 1-person, 188 2-persons, 125 3-persons, 28 5-persons, 26 6-persons.
4,380 married couples with children.
2,571 single-parent households (452 men, 2,119 women).
33.9% of residents of Santa Paula speak English at home.
63.4% of residents speak Spanish at home (53% speak English very well, 17% speak English well, 15% speak English not well, 15% don't speak English at all).
0.6% of residents speak other Indo-European language at home (66% speak English very well, 25% speak English well, 9% speak English not well).
0.9% of residents speak Asian or Pacific Island language at home (65% speak English very well, 27% speak English well, 3% speak English not well, 5% don't speak English at all).
0.3% of residents speak other language at home (100% speak English not well).
Foreign born population: 9,681 (31.8%)
(33.4% of them are naturalized citizens)
| Here: | 5.7 |
| State: | 6.0 |
| Here: | 4.1 |
| State: | 3.9 |

- Bedrooms in owner-occupied houses and condos in Santa Paula, California
- 16no bedroom
- 151 bedroom
- 1,2212 bedrooms
- 2,7193 bedrooms
- 7834 bedrooms
- 1325+ bedrooms

- Bedrooms in renter-occupied apartments in Santa Paula, California
- 153no bedroom
- 6351 bedroom
- 1,9982 bedrooms
- 1,2423 bedrooms
- 3374 bedrooms
- 215+ bedrooms

- Cars and other vehicles available in Santa Paula in owner-occupied houses/condos
- 69no vehicle
- 1,3641 vehicle
- 1,4652 vehicles
- 1,0073 vehicles
- 7234 vehicles
- 2615+ vehicles

- Cars and other vehicles available in Santa Paula in renter-occupied apartments
- 208no vehicle
- 1,7161 vehicle
- 1,5892 vehicles
- 7043 vehicles
- 1234 vehicles
- 455+ vehicles

- Rooms in owner-occupied houses in Santa Paula, California
- 101 room
- 02 rooms
- 903 rooms
- 5624 rooms
- 1,4535 rooms
- 1,4076 rooms
- 8527 rooms
- 2408 rooms
- 2749+ rooms

- Rooms in renter-occupied apartments in Santa Paula, California
- 1451 room
- 1342 rooms
- 6613 rooms
- 1,5404 rooms
- 9545 rooms
- 7186 rooms
- 1687 rooms
- 418 rooms
- 249+ rooms


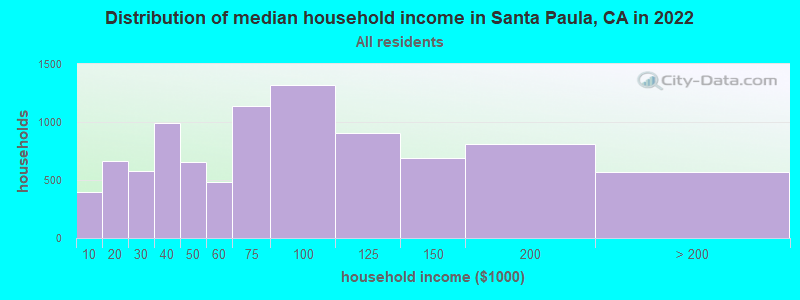
Santa Paula, CA household income distribution

- 398Less than $10,000
- 667$10,000 to $19,999
- 575$20,000 to $29,999
- 993$30,000 to $39,999
- 658$40,000 to $49,999
- 487$50,000 to $59,999
- 1,141$60,000 to $74,999
- 1,319$75,000 to $99,999
- 904$100,000 to $124,999
- 688$125,000 to $149,999
- 813$150,000 to $199,999
- 570$200,000 or more
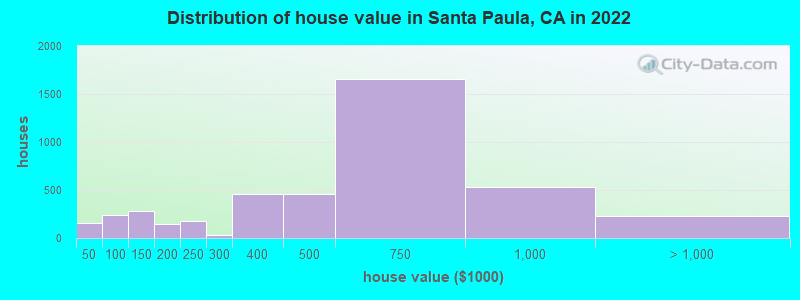
Home value of owner - occupied houses in 2022 in Santa Paula, CA
-
- 79Less than $10,000
- 12$10,000 to $14,999
- 2$15,000 to $19,999
- 39$25,000 to $29,999
- 21$40,000 to $49,999
- 19$50,000 to $59,999
- 88$70,000 to $79,999
- 31$80,000 to $89,999
- 81$90,000 to $99,999
- 211$100,000 to $124,999
- 70$125,000 to $149,999
- 69$150,000 to $174,999
- 76$175,000 to $199,999
- 178$200,000 to $249,999
- 26$250,000 to $299,999
- 461$300,000 to $399,999
- 461$400,000 to $499,999
- 1,651$500,000 to $749,999
- 534$750,000 to $999,999
- 190$1,000,000 to $1,499,999
- 17$1,500,000 to $1,999,999
- 20$2,000,000 or more
Rent paid by renters in 2022 in Santa Paula, CA
-
- 7$150 to $199
- 104$200 to $249
- 104$250 to $299
- 13$350 to $399
- 30$400 to $449
- 38$450 to $499
- 46$500 to $549
- 16$650 to $699
- 30$700 to $749
- 20$750 to $799
- 41$800 to $899
- 317$900 to $999
- 492$1,000 to $1,249
- 1,104$1,250 to $1,499
- 1,103$1,500 to $1,999
- 388$2,000 to $2,499
- 119$2,500 to $2,999
- 12$3,500 or more
- 110No cash rent


Percentage of workers working in this county: 93.4%
Number of people working at home: 692 (5.1% of all workers)
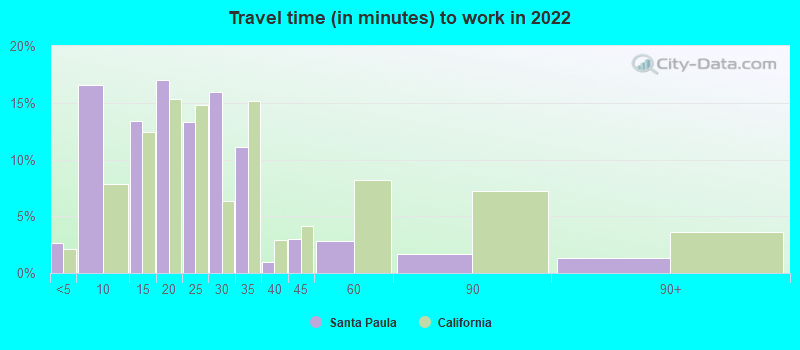
Travel time to work (commute)
- Less than 5 minutes: 202
- 5 to 9 minutes: 1,260
- 10 to 14 minutes: 1,188
- 15 to 19 minutes: 1,575
- 20 to 24 minutes: 1,670
- 25 to 29 minutes: 1,260
- 30 to 34 minutes: 2,446
- 35 to 39 minutes: 395
- 40 to 44 minutes: 684
- 45 to 59 minutes: 1,059
- 60 to 89 minutes: 545
- 90 or more minutes: 350
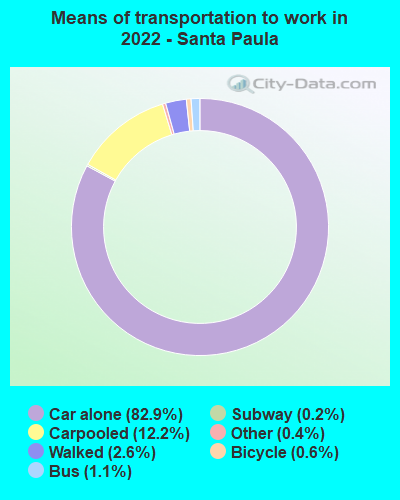
Means of transportation to work:
- Drove a car alone: 5,784 (72.5%)
- Carpooled: 1,003 (12.6%)
- Bus: 80 (1.0%)
- Long-distance train or commuter rail: 7 (0.1%)
- Taxi: 35 (0.4%)
- Bicycle: 47 (0.6%)
- Walked: 200 (2.5%)
- Worked at home: 692 (8.7%)

- Unemployment by race in 2022
- Unemployment rate for White non-Hispanic residents
- 4.2%Males
- 1.2%Females
- Unemployment rate for American Indian and Alaska Native residents
- 1.5%Males
- Unemployment rate for other race residents
- 7.8%Males
- 8.8%Females
- Unemployment rate for two or more race residents
- 5.6%Males
- 3.8%Females
- Unemployment rate for Hispanic or Latino residents
- 6.0%Males
- 4.6%Females

- Year of entry for the foreign-born population in Santa Paula, California
- 1,0952010 or later
- 2,3812000 to 2009
- 2,5951990 to 1999
- 2,3921980 to 1989
- 1,5211970 to 1979
- 1,144Before 1970

First ancestries reported:
- American: 578 (2.6%)
- German: 167 (0.8%)
- Irish: 122 (0.6%)
- European: 112 (0.5%)
- English: 103 (0.5%)
- Polish: 85 (0.4%)
- Dutch: 70 (0.3%)
- Italian: 63 (0.3%)
- African: 40 (0.2%)
- French Canadian: 39 (0.2%)
- Norwegian: 37 (0.2%)
- Iranian: 35 (0.2%)
- British: 29 (0.1%)
- Scottish: 27 (0.1%)
- Russian: 24 (0.1%)
- Haitian: 22 (0.10%)
- French: 18 (0.08%)
- Scandinavian: 15 (0.07%)
- Scotch-Irish: 15 (0.07%)
- Danish: 13 (0.06%)
- Basque: 9 (0.04%)
- Northern European: 7 (0.03%)
- Hungarian: 6 (0.03%)
Most common places of birth for foreign-born residents (%):
| Santa Paula: | 92.7% (8,633) |
| California: | 37.2% (3,881,193) |
| Santa Paula: | 1.6% (152) |
| California: | 2.8% (290,436) |
Place of birth for U.S.-born residents:
- This state: 18,355
- Other state: 2,185
- Northeast: 212
- Midwest: 580
- South: 731
- West: 635
93.2% of Santa Paula residents lived in the same house 1 years ago.
Out of people who lived in different houses, 45.4% lived in this county.
Out of people who lived in different counties, 83.2% lived in California.
| Santa Paula: | 93.2% |
| State average: | 88.9% |
Education attainment for males 25 years and older:
- No schooling: 679
- Nursery to 4th grade: 311
- 5th and 6th grade: 907
- 7th and 8th grade: 180
- 9th grade: 250
- 10th grade: 349
- 11th grade: 326
- 12th grade, no diploma: 403
- High school graduate (or equivalency): 2,328
- Less than 1 year of college: 613
- Some college more than 1 year, no degree: 1,268
- Associate degree: 499
- Bachelor's degree: 884
- Master's degree: 211
- Professional school degree: 54
- Doctorate degree: 93

Education attainment for females 25 years and older:
- No schooling: 561
- Nursery to 4th grade: 365
- 5th and 6th grade: 725
- 7th and 8th grade: 330
- 9th grade: 326
- 10th grade: 280
- 11th grade: 228
- 12th grade, no diploma: 421
- High school graduate (or equivalency): 1,706
- Less than 1 year of college: 519
- Some college more than 1 year, no degree: 1,133
- Associate degree: 896
- Bachelor's degree: 1,020
- Master's degree: 485
- Professional school degree: 149
- Doctorate degree: 2


Housing units in structures:
- One, detached: 5,708
- One, attached: 883
- Two: 383
- 3 or 4: 713
- 5 to 9: 537
- 10 to 19: 201
- 20 to 49: 128
- 50 or more: 141
- Mobile homes: 1,070
Median worth of mobile homes: $164,062
Housing units lacking complete kitchen facilities in 2022: 1.2%
House/condo owner moved in on average 16 years ago
Renter moved in on average 5 years ago

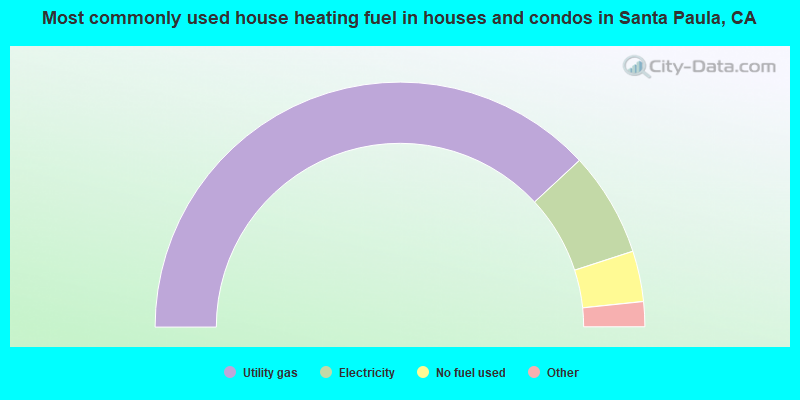
- 76.2%Utility gas
- 13.8%Electricity
- 6.7%No fuel used
- 2.5%Wood
- 0.4%Bottled, tank, or LP gas
- 0.2%Solar energy
- 0.1%Other fuel
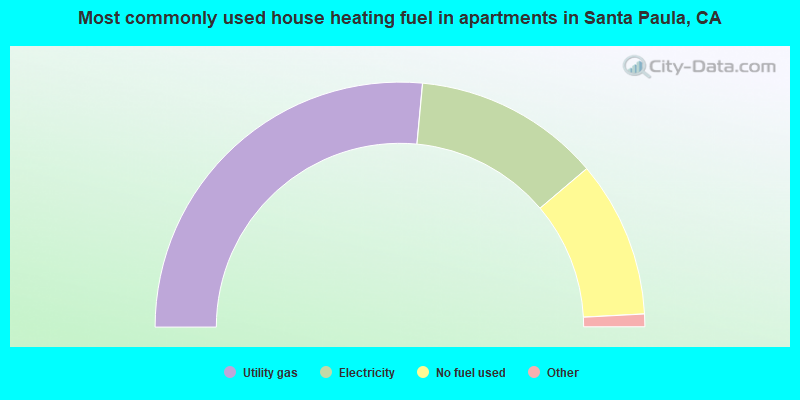
- 53.0%Utility gas
- 24.7%Electricity
- 20.7%No fuel used
- 1.5%Bottled, tank, or LP gas
- 0.1%Other fuel
Private vs. public school enrollment:
| Here: | 6.4% |
| California: | 10.5% |
| Here: | 3.6% |
| California: | 8.5% |
| Here: | 6.0% |
| California: | 15.9% |


