Sarasota Springs, FL (Florida) Houses and Residents
| Sarasota Springs: | $329,685 |
| Florida: | $354,100 |
Mean price in 2022:
Detached houses: $343,056
Here: $343,056 State: $500,941 Townhouses or other attached units: $269,628
Here: $269,628 State: $370,869 In 2-unit structures: $254,374
Here: $254,374 State: $423,188 In 3-to-4-unit structures: $107,285
Here: $107,285 State: $309,944 In 5-or-more-unit structures: $186,863
Here: $186,863 State: $447,145 Mobile homes: $50,537
Here: $50,537 State: $113,202
Total population: 14,395 (All urban)
Houses: 5,396 (4,833 occupied: 3,914 owner occupied, 1,075 renter occupied)
| % of renters here: | 22% |
| State: | 33% |
Housing density: 1,492 houses/condos per square mile
Median price asked for vacant for-sale houses and condos in 2022: $277,134.
Median contract rent in 2022: $1,751 (lower quartile is $1,471, upper quartile is $1,975)
Median rent asked for vacant for-rent units in 2022: $2,096
Median gross rent in Sarasota Springs, FL in 2022: $1,957
Housing units in Sarasota Springs with a mortgage: 2,606 (193 second mortgage, 0 home equity loan, 132 both second mortgage and home equity loan)
Houses without a mortgage: 214
Median household income for houses/condos with a mortgage: $93,047
Median household income for apartments without a mortgage: $87,596
Median monthly housing costs: $1,374
Compare current foreclosures near Sarasota Springs, FL:
| Photo | Address | Area | Beds / Baths | Price | Details |
|---|---|---|---|---|---|

|
#1
Fruitville Rd Unit 54
Sarasota, FL 34232
|
832 sq. feet
|
1 baths 1 beds |
$195,000
|
show details |

|
#2
Hampton Wood Ct
Sarasota, FL 34232
|
2,476 sq. feet
|
2 baths 3 beds |
$655,000
|
show details |

|
#3
Eagles Point Cir Apt 202
Sarasota, FL 34231
|
1,608 sq. feet
|
2 baths 2 beds |
$514,900
|
show details |

|
#4
122nd Ter E
Parrish, FL 34219
|
- sq. feet
|
2 baths 2 beds |
$384,900
|
show details |

|
#5
30th Ave W Apt C201
Bradenton, FL 34205
|
1,050 sq. feet
|
2 baths 2 beds |
show details | |

|
#6
16th St W
Palmetto, FL 34221
|
1,958 sq. feet
|
2 baths 3 beds |
show details | |

|
#7
Curzon Ter
Bradenton, FL 34201
|
3,570 sq. feet
|
3 baths 3 beds |
show details | |

|
#8
31st St W
Bradenton, FL 34205
|
1,492 sq. feet
|
1 baths 3 beds |
show details | |

|
#9
22nd St
Sarasota, FL 34234
|
1,376 sq. feet
|
2 baths 4 beds |
show details | |

|
#10
Wilderness Blvd W
Parrish, FL 34219
|
2,759 sq. feet
|
2 baths 3 beds |
show details |
| Photo | Address | Area | Beds / Baths | Price | Details |
|---|---|---|---|---|---|

|
#11
Cedar Oak Way
Sarasota, FL 34233
|
2,702 sq. feet
|
3 baths 3 beds |
show details | |

|
#12
Jungle Way
Sarasota, FL 34243
|
1,812 sq. feet
|
3 baths 4 beds |
show details | |

|
#13
22nd St E
Palmetto, FL 34221
|
1,614 sq. feet
|
2 baths 3 beds |
show details | |

|
#14
Phillippi St
Sarasota, FL 34231
|
2,012 sq. feet
|
2 baths 3 beds |
show details | |

|
#15
128th St NE
Bradenton, FL 34212
|
2,441 sq. feet
|
3 baths 4 beds |
show details | |

|
#16
Maiden Ln
Sarasota, FL 34231
|
864 sq. feet
|
2 baths 3 beds |
show details | |

|
#17
Belmont Blvd
Sarasota, FL 34232
|
1,013 sq. feet
|
1 baths 2 beds |
show details | |

|
#18
21st St E
Bradenton, FL 34208
|
2,944 sq. feet
|
2 baths 3 beds |
show details | |

|
#19
43rd St W Apt 108d
Bradenton, FL 34210
|
1,178 sq. feet
|
1 baths 2 beds |
show details | |

|
#20
Shire St
Nokomis, FL 34275
|
4,119 sq. feet
|
4 baths 5 beds |
show details |
| Photo | Address | Area | Beds / Baths | Price | Details |
|---|---|---|---|---|---|

|
#21
17th St W
Bradenton, FL 34207
|
1,196 sq. feet
|
2 baths 3 beds |
show details | |

|
#22
1st St
Bradenton, FL 34203
|
1,308 sq. feet
|
2 baths 4 beds |
show details | |

|
#23
19th St E
Bradenton, FL 34203
|
1,176 sq. feet
|
2 baths 3 beds |
show details | |

|
#24
51st Ave E
Bradenton, FL 34203
|
768 sq. feet
|
1 baths 2 beds |
show details | |

|
#25
20th St W
Bradenton, FL 34207
|
1,146 sq. feet
|
1 baths 2 beds |
show details | |

|
#26
26th Ave E # 903
Bradenton, FL 34208
|
2,172 sq. feet
|
2 baths 3 beds |
show details | |

|
#27
46th Avenue Ter W Apt 402
Bradenton, FL 34207
|
725 sq. feet
|
1 baths 1 beds |
show details | |

|
#28
49th Ave W
Bradenton, FL 34207
|
1,049 sq. feet
|
1 baths 2 beds |
show details | |

|
#29
Millet Pl
Nokomis, FL 34275
|
1,692 sq. feet
|
2 baths 2 beds |
show details | |

|
#30
Water Oak Dr Apt 209
Bradenton, FL 34207
|
960 sq. feet
|
2 baths 2 beds |
show details |
| Photo | Address | Area | Beds / Baths | Price | Details |
|---|---|---|---|---|---|

|
#31
Lena Ln
Sarasota, FL 34240
|
2,007 sq. feet
|
2 baths 3 beds |
show details | |

|
#32
14th Ave E
Bradenton, FL 34208
|
1,486 sq. feet
|
2 baths 3 beds |
show details | |

|
#33
28th Ave E
Bradenton, FL 34208
|
1,365 sq. feet
|
2 baths 3 beds |
show details | |

|
#34
19th St W
Bradenton, FL 34205
|
1,104 sq. feet
|
2 baths 2 beds |
show details | |

|
#35
46th Avenue Dr W
Bradenton, FL 34210
|
1,216 sq. feet
|
1 baths 3 beds |
show details | |

|
#36
40th Ave W
Bradenton, FL 34205
|
1,199 sq. feet
|
1 baths 2 beds |
show details | |

|
#37
38th Ave W
Bradenton, FL 34205
|
828 sq. feet
|
1 baths 2 beds |
show details | |

|
#38
14th Ave E
Bradenton, FL 34208
|
1,175 sq. feet
|
1 baths 3 beds |
show details | |

|
#39
25th Street Ct E
Bradenton, FL 34208
|
954 sq. feet
|
2 baths 2 beds |
show details | |

|
#40
35th Ct E
Bradenton, FL 34203
|
2,013 sq. feet
|
3 baths 3 beds |
show details |
| Photo | Address | Area | Beds / Baths | Price | Details |
|---|---|---|---|---|---|

|
#41
Searobbin Dr
Bradenton, FL 34202
|
1,700 sq. feet
|
2 baths 4 beds |
show details | |

|
#42
Turtle Bay Ter
Bradenton, FL 34203
|
2,184 sq. feet
|
3 baths 4 beds |
show details | |

|
#43
Pine Prairie Rd # 4101
Sarasota, FL 34240
|
2,159 sq. feet
|
5 baths 5 beds |
show details | |

|
#44
Twin Hills Ter
Bradenton, FL 34202
|
2,633 sq. feet
|
2 baths 3 beds |
show details | |

|
#45
Hyacinth Pl
Bradenton, FL 34202
|
2,570 sq. feet
|
3 baths 4 beds |
show details | |

|
#46
66th Ave E
Bradenton, FL 34203
|
1,302 sq. feet
|
2 baths 3 beds |
show details | |

|
#47
Pine Lilly Pl
Bradenton, FL 34202
|
2,317 sq. feet
|
4 baths 4 beds |
show details | |

|
#48
65th Avenue Cir E
Sarasota, FL 34243
|
1,146 sq. feet
|
2 baths 3 beds |
show details | |

|
#49
Wingspan Way
Bradenton, FL 34203
|
1,814 sq. feet
|
2 baths 2 beds |
show details | |

|
Check over 1 million property listings on Foreclosure.com!
|
browse all offers | |||


 | It's hotter than ever in Bradenton/Sarasota! New records set, more ER trips and A/C repairs (71 replies) |
| Ground finally broken for Bath & Racquet redevelopment in Sarasota County (2 replies) |
| Buying an occupied rental house (2 replies) |
| Relocating to Bradenton\Sarasota 2021 (18 replies) |
| safe neighborhood for LVNs (18 replies) |
| Want to buy a House (7 replies) |

Median year apartment built: 1982
Household type by relationship:
Households: 13,151- Male householders: 2,161 (456 living alone), Female householders: 2,703 (667 living alone)
2,360 spouses (2,337 opposite-sex spouses), 537 unmarried partners, (516 opposite-sex unmarried partners), 3,873 children (3,676 natural, 32 adopted, 165 stepchildren), 221 grandchildren, 157 brothers or sisters, 166 parents, 24 foster children, 392 other relatives, 551 non-relatives
Size of family households: 1,660 2-persons, 691 3-persons, 655 4-persons, 230 5-persons, 246 6-persons, 32 7-or-more-persons.
Size of nonfamily households: 1,134 1-person, 246 2-persons, 94 3-persons, 26 6-persons.
1,230 married couples with children.
1,226 single-parent households (244 men, 982 women).
81.6% of residents of Sarasota Springs speak English at home.
12.8% of residents speak Spanish at home (43% speak English very well, 38% speak English well, 18% speak English not well, 1% don't speak English at all).
4.3% of residents speak other Indo-European language at home (76% speak English very well, 22% speak English well, 2% speak English not well).
0.1% of residents speak Asian or Pacific Island language at home (100% speak English not well).
0.3% of residents speak other language at home (100% speak English very well).
Foreign born population: 1,887 (14.3%)
(66.8% of them are naturalized citizens)
| Here: | 5.6 |
| State: | 5.9 |
| Here: | 5.2 |
| State: | 4.2 |

- Bedrooms in owner-occupied houses and condos in Sarasota Springs, Florida
- 0no bedroom
- 181 bedroom
- 9722 bedrooms
- 2,4943 bedrooms
- 3914 bedrooms
- 395+ bedrooms

- Bedrooms in renter-occupied apartments in Sarasota Springs, Florida
- 0no bedroom
- 391 bedroom
- 3042 bedrooms
- 5713 bedrooms
- 1624 bedrooms
- 05+ bedrooms

- Cars and other vehicles available in Sarasota Springs in owner-occupied houses/condos
- 81no vehicle
- 1,0411 vehicle
- 1,7232 vehicles
- 8063 vehicles
- 2104 vehicles
- 525+ vehicles

- Cars and other vehicles available in Sarasota Springs in renter-occupied apartments
- 10no vehicle
- 4661 vehicle
- 4952 vehicles
- 623 vehicles
- 64 vehicles
- 375+ vehicles

- Rooms in owner-occupied houses in Sarasota Springs, Florida
- 01 room
- 102 rooms
- 703 rooms
- 5654 rooms
- 1,3775 rooms
- 1,0626 rooms
- 4087 rooms
- 1938 rooms
- 2299+ rooms

- Rooms in renter-occupied apartments in Sarasota Springs, Florida
- 01 room
- 02 rooms
- 813 rooms
- 2134 rooms
- 3425 rooms
- 4046 rooms
- 227 rooms
- 108 rooms
- 59+ rooms


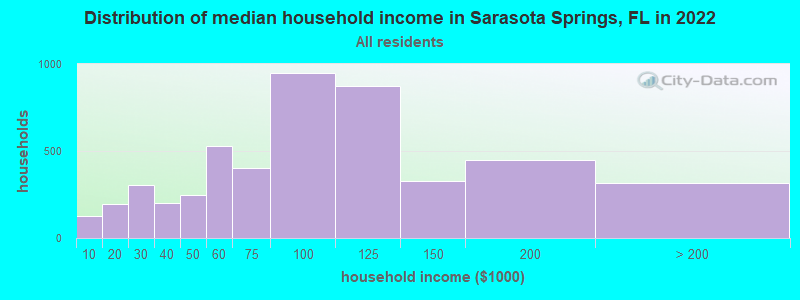
Sarasota Springs, FL household income distribution

- 126Less than $10,000
- 198$10,000 to $19,999
- 305$20,000 to $29,999
- 203$30,000 to $39,999
- 250$40,000 to $49,999
- 531$50,000 to $59,999
- 405$60,000 to $74,999
- 950$75,000 to $99,999
- 875$100,000 to $124,999
- 327$125,000 to $149,999
- 447$150,000 to $199,999
- 314$200,000 or more
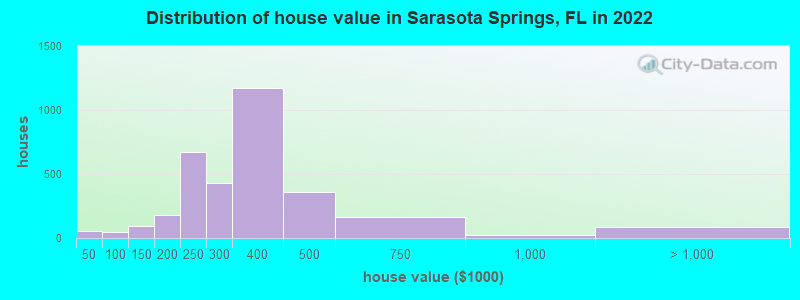
Home value of owner - occupied houses in 2022 in Sarasota Springs, FL
-
- 12$15,000 to $19,999
- 17$25,000 to $29,999
- 8$30,000 to $34,999
- 15$35,000 to $39,999
- 19$60,000 to $69,999
- 4$80,000 to $89,999
- 19$90,000 to $99,999
- 46$100,000 to $124,999
- 48$125,000 to $149,999
- 118$150,000 to $174,999
- 58$175,000 to $199,999
- 671$200,000 to $249,999
- 425$250,000 to $299,999
- 1,174$300,000 to $399,999
- 362$400,000 to $499,999
- 166$500,000 to $749,999
- 25$750,000 to $999,999
- 17$1,000,000 to $1,499,999
- 71$2,000,000 or more
Rent paid by renters in 2022 in Sarasota Springs, FL
-
- 59$600 to $649
- 16$900 to $999
- 34$1,000 to $1,249
- 239$1,250 to $1,499
- 576$1,500 to $1,999
- 50$2,000 to $2,499
- 134No cash rent


Percentage of workers working in this county: 88.1%
Number of people working at home: 735 (9.9% of all workers)
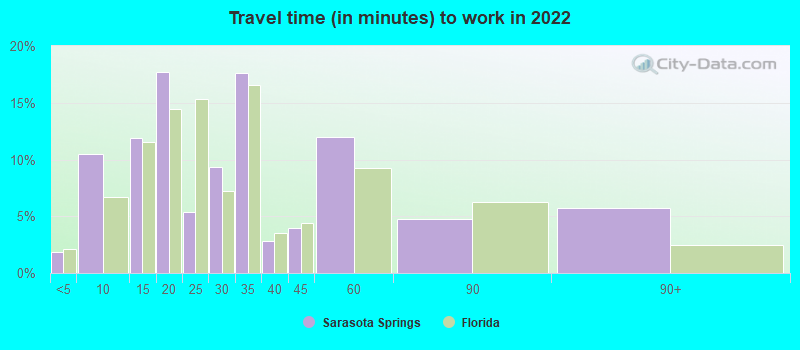
Travel time to work (commute)
- Less than 5 minutes: 239
- 5 to 9 minutes: 517
- 10 to 14 minutes: 754
- 15 to 19 minutes: 1,180
- 20 to 24 minutes: 1,414
- 25 to 29 minutes: 370
- 30 to 34 minutes: 1,099
- 35 to 39 minutes: 60
- 40 to 44 minutes: 173
- 45 to 59 minutes: 221
- 60 to 89 minutes: 142
- 90 or more minutes: 118
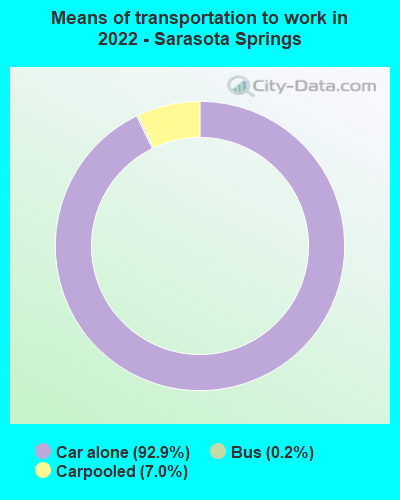
Means of transportation to work:
- Drove a car alone: 1,831 (68.2%)
- Carpooled: 161 (6.0%)
- Bus: 1 (0.0%)
- Worked at home: 735 (27.4%)

- Unemployment by race in 2022
- Unemployment rate for White non-Hispanic residents
- 2.7%Males
- 2.5%Females
- Unemployment rate for other race residents
- 13.1%Females
- Unemployment rate for Hispanic or Latino residents
- 0.9%Females

- Year of entry for the foreign-born population in Sarasota Springs, Florida
- 6242010 or later
- 4322000 to 2009
- 4731990 to 1999
- 1901980 to 1989
- 831970 to 1979
- 351Before 1970

First ancestries reported:
- American: 1,887 (27.1%)
- German: 568 (8.2%)
- Irish: 507 (7.3%)
- Italian: 451 (6.5%)
- English: 377 (5.4%)
- Norwegian: 148 (2.1%)
- Swedish: 115 (1.7%)
- Polish: 112 (1.6%)
- Scottish: 109 (1.6%)
- French: 94 (1.4%)
- Dutch: 83 (1.2%)
- Scotch-Irish: 63 (0.9%)
- Russian: 59 (0.8%)
- British: 45 (0.6%)
- European: 38 (0.5%)
- Turkish: 34 (0.5%)
- Ukrainian: 33 (0.5%)
- Welsh: 31 (0.4%)
- Brazilian: 27 (0.4%)
- Lebanese: 21 (0.3%)
- Swiss: 19 (0.3%)
- Eastern European: 18 (0.3%)
- Czech: 16 (0.2%)
- Slovak: 16 (0.2%)
- Yugoslavian: 16 (0.2%)
- Croatian: 12 (0.2%)
- Northern European: 11 (0.2%)
- Scandinavian: 11 (0.2%)
- Canadian: 9 (0.1%)
- Hungarian: 8 (0.1%)
- Danish: 5 (0.07%)
- French Canadian: 5 (0.07%)
- Austrian: 4 (0.06%)
- Portuguese: 4 (0.06%)
- Slovene: 4 (0.06%)
Most common places of birth for foreign-born residents (%):
| Sarasota Springs: | 32.4% (539) |
| Florida: | 22.0% (1,006,576) |
| Sarasota Springs: | 23.0% (383) |
| Florida: | 5.6% (257,152) |
| Sarasota Springs: | 9.3% (154) |
| Florida: | 5.7% (262,042) |
| Sarasota Springs: | 4.0% (66) |
| Florida: | 6.5% (298,669) |
| Sarasota Springs: | 2.6% (43) |
| Florida: | 3.0% (137,727) |
| Sarasota Springs: | 2.5% (42) |
| Florida: | 2.1% (96,693) |
| Sarasota Springs: | 2.5% (41) |
| Florida: | 0.7% (31,076) |
| Sarasota Springs: | 2.5% (41) |
| Florida: | 2.4% (109,132) |
| Sarasota Springs: | 2.4% (40) |
| Florida: | 0.2% (8,103) |
| Sarasota Springs: | 2.1% (35) |
| Florida: | 0.5% (21,886) |
| Sarasota Springs: | 1.9% (31) |
| Florida: | 2.7% (122,906) |
| Sarasota Springs: | 1.5% (25) |
| Florida: | 0.2% (8,695) |
Place of birth for U.S.-born residents:
- This state: 4,645
- Other state: 6,298
- Northeast: 2,378
- Midwest: 2,547
- South: 903
- West: 474
89.2% of Sarasota Springs residents lived in the same house 1 years ago.
Out of people who lived in different houses, 35.9% lived in this county.
Out of people who lived in different counties, 60.0% lived in Florida.
| Sarasota Springs: | 89.2% |
| State average: | 86.3% |
Education attainment for males 25 years and older:
- No schooling: 69
- Nursery to 4th grade: 0
- 5th and 6th grade: 33
- 7th and 8th grade: 95
- 9th grade: 18
- 10th grade: 13
- 11th grade: 36
- 12th grade, no diploma: 69
- High school graduate (or equivalency): 1,894
- Less than 1 year of college: 322
- Some college more than 1 year, no degree: 420
- Associate degree: 407
- Bachelor's degree: 752
- Master's degree: 223
- Professional school degree: 25
- Doctorate degree: 68

Education attainment for females 25 years and older:
- No schooling: 8
- Nursery to 4th grade: 4
- 5th and 6th grade: 68
- 7th and 8th grade: 44
- 9th grade: 18
- 10th grade: 87
- 11th grade: 36
- 12th grade, no diploma: 59
- High school graduate (or equivalency): 1,490
- Less than 1 year of college: 414
- Some college more than 1 year, no degree: 501
- Associate degree: 659
- Bachelor's degree: 958
- Master's degree: 376
- Professional school degree: 29
- Doctorate degree: 23


Housing units in structures:
- One, detached: 5,152
- One, attached: 123
- Two: 61
- 3 or 4: 6
- 5 to 9: 25
- 20 to 49: 15
- 50 or more: 11
Housing units lacking complete kitchen facilities in 2022: 0.2%
House/condo owner moved in on average 12 years ago
Renter moved in on average 5 years ago

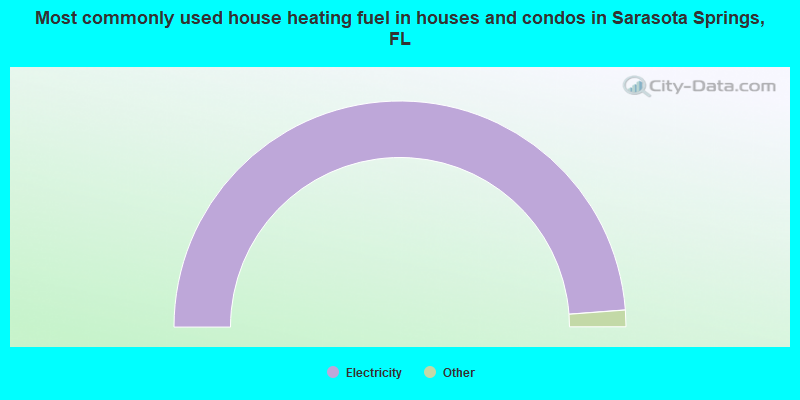
- 97.6%Electricity
- 1.7%Utility gas
- 0.5%No fuel used
- 0.2%Solar energy
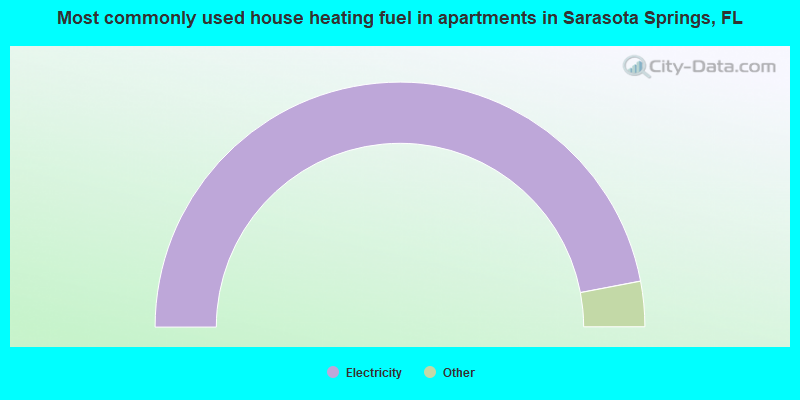
- 94.1%Electricity
- 3.4%No fuel used
- 1.3%Wood
- 1.1%Utility gas
- 0.1%Other fuel
Private vs. public school enrollment:
| Here: | 15.4% |
| Florida: | 15.8% |
| Here: | 7.9% |
| Florida: | 12.9% |
| Here: | 14.0% |
| Florida: | 23.6% |


