Schaumburg, IL (Illinois) Houses and Residents
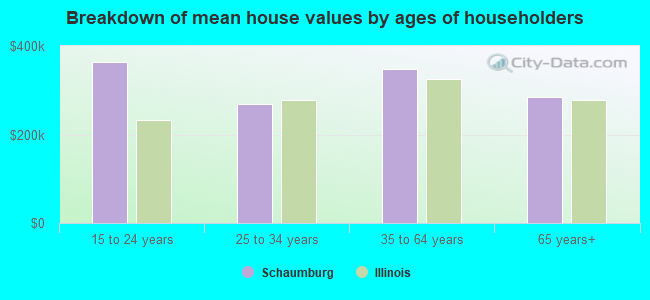
Estimated median house or condo value in 2022: $316,900 (it was $161,500 in 2000 )
Schaumburg:
$316,900Illinois:
$251,600
Lower value quartile - upper value quartile: $218,600 - $412,000Mean price in 2022: Detached houses: $439,092 Here:
$439,092State:
$310,164
Townhouses or other attached units: $251,669 Here:
$251,669State:
$286,230
In 3-to-4-unit structures: $185,481 Here:
$185,481State:
$330,907
In 5-or-more-unit structures: $165,736 Here:
$165,736State:
$318,887
Total population: 74,896 (Urban population: 74,511, Rural population: 0)
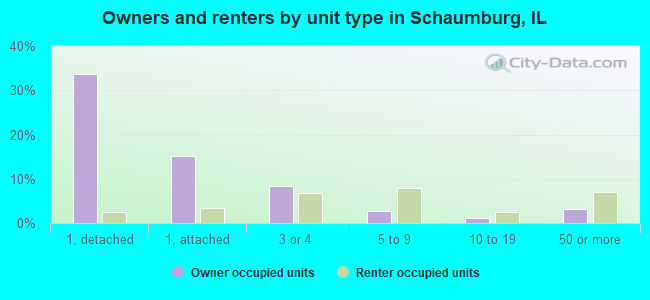
Houses: 33,872 (31,843 occupied: 20,604 owner occupied, 11,239 renter occupied )
% of renters here:
35%State:
33%
Housing density: 1,782 houses/condos per square mile
Median price asked for vacant for-sale houses and condos in 2022: $172,024.
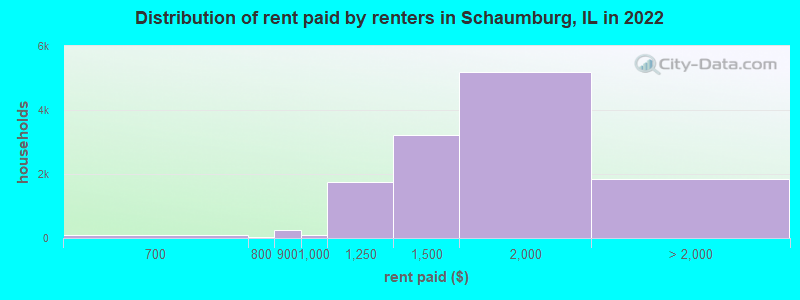
Median contract rent in 2022: $1,504 (lower quartile is $1,264, upper quartile is $1,857)
Median rent asked for vacant for-rent units in 2022: $1,434
Median gross rent in Schaumburg, IL in 2022: $1,635
Housing units in Schaumburg with a mortgage: 14,398 (573 second mortgage, 0 home equity loan, 455 both second mortgage and home equity loan )Houses without a mortgage: 467
Median household income for houses/condos with a mortgage: $103,986
Median household income for apartments without a mortgage: $82,788
Median monthly housing costs: $1,601
Data:
Median house or condo value ($)
Median house or condo value ($ change since 2000)
Median house or condo value ($) - White
Median house or condo value ($) - Black or African American
Median house or condo value ($) - Asian
Median house or condo value ($) - Hispanic or Latino
Median house or condo value ($) - American Indian and Alaska Native
Median house or condo value ($) - Multirace
Median house or condo value ($) - Other Race
Median price asked for mobile homes ($)
Household density (households per square mile)
Mean house or condo value by units in structure - 1, detached ($)
Mean house or condo value by units in structure - 1, attached ($)
Mean house or condo value by units in structure - 2 ($)
Mean house or condo value by units in structure by units in structure - 3 or 4 ($)
Mean house or condo value by units in structure - 5 or more ($)
Mean house or condo value by units in structure - Boat, RV, van, etc. ($)
Mean house or condo value by units in structure - Mobile home ($)
Median contract rent ($)
Median contract rent - Lower quartile ($)
Median contract rent - Upper quartile ($)
Median gross rent ($)
Urban houses (%)
Rural houses (%)
Houses occupied (%)
Houses occupied (% change since 2000)
Houses owner occupied (%)
Houses owner occupied (% change since 2000)
Houses renter occupied (%)
Houses renter occupied (% change since 2000)
Vacant housing units - For rent (%)
Vacant housing units - For rent (% change since 2000)
Vacant housing units - For sale only (%)
Vacant housing units - For sale only (% change since 2000)
Vacant housing units - Rented or sold, not occupied (%)
Vacant housing units - Rented or sold, not occupied (% change since 2000)
Vacant housing units - For seasonal, recreational, or occasional use (%)
Vacant housing units - For seasonal, recreational, or occasional use (% change since 2000)
Vacant housing units - For migrant workers (%)
Vacant housing units - For migrant workers (% change since 2000)
Vacant housing units - Other vacant (%)
Vacant housing units - Other vacant (% change since 2000)
Median monthly housing costs ($)
Median household income for houses/condos with a mortgage ($)
Median household income for houses/condos without a mortgage ($)
Median household income ($)
Median household income ($) - White
Median household income ($) - Black or African American
Median household income ($) - Asian
Median household income ($) - Hispanic or Latino
Median household income ($) - American Indian and Alaska Native
Median household income ($) - Multirace
Median household income ($) - Other Race
Mortgage status - with mortgage (%)
Mortgage status - with second mortgage (%)
Mortgage status - with home equity loan (%)
Mortgage status - with both second mortgage and home equity loan (%)
Mortgage status - without a mortgage (%)
Median year house/condo built
Median year apartment built
Household type by relationship - Male householder living alone (%)
Household type by relationship - Male householder not living alone (%)
Household type by relationship - Female householder living alone (%)
Household type by relationship - Female householder not living alone (%)
Household type by relationship - Opposite-Sex spouse (%)
Household type by relationship - Same-Sex spouse (%)
Household type by relationship - Opposite-Sex unmarried partner (%)
Household type by relationship - Same-Sex unmarried partner (%)
Household type by relationship - In group quarters (%)
Size of family households - 2-person household (%)
Size of family households - 3-person household (%)
Size of family households - 4-person household (%)
Size of family households - 5-person household (%)
Size of family households - 6-person household (%)
Size of family households - 7-or-more-person household (%)
Size of nonfamily households - 1-person household (%)
Size of nonfamily households - 2-person household (%)
Size of nonfamily households - 3-person household (%)
Size of nonfamily households - 4-person household (%)
Size of nonfamily households - 5-person household (%)
Size of nonfamily households - 6-person household (%)
Size of nonfamily households - 7-or-moreperson household (%)
Year house built - Built 2010 or later (%)
Year house built - Built 2000 to 2009 (%)
Year house built - Built 1990 to 1999 (%)
Year house built - Built 1980 to 1989 (%)
Year house built - Built 1970 to 1979 (%)
Year house built - Built 1960 to 1969 (%)
Year house built - Built 1950 to 1959 (%)
Year house built - Built 1940 to 1949 (%)
Year house built - Built 1939 or earlier (%)
Median number of rooms in houses and condos
Median number of rooms in apartments
Median number of bedrooms in owner occupied houses
Mean number of bedrooms in owner occupied houses
Median number of bedrooms in renter occupied houses
Mean number of bedrooms in renter occupied houses
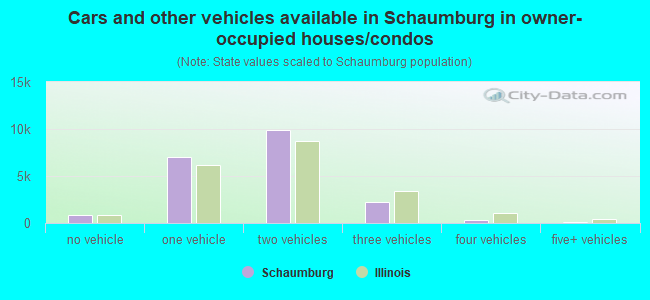
Median number of vehichles in owner occupied houses
Mean number of vehichles in owner occupied houses
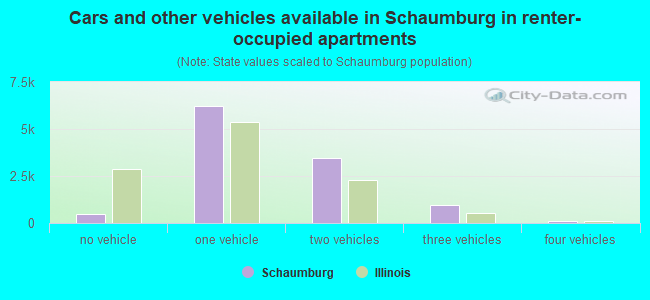
Median number of vehichles in renter occupied houses
Mean number of vehichles in renter occupied houses
Rooms in owner-occupied houses - 1 room (%)
Rooms in owner-occupied houses - 2 rooms (%)
Rooms in owner-occupied houses - 3 rooms (%)
Rooms in owner-occupied houses - 4 rooms (%)
Rooms in owner-occupied houses - 5 rooms (%)
Rooms in owner-occupied houses - 6 rooms (%)
Rooms in owner-occupied houses - 7 rooms (%)
Rooms in owner-occupied houses - 8 rooms (%)
Rooms in owner-occupied houses - 9+ rooms (%)
Rooms in renter-occupied houses - 1 room (%)
Rooms in renter-occupied houses - 2 rooms (%)
Rooms in renter-occupied houses - 3 rooms (%)
Rooms in renter-occupied houses - 4 rooms (%)
Rooms in renter-occupied houses - 5 rooms (%)
Rooms in renter-occupied houses - 6 rooms (%)
Rooms in renter-occupied houses - 7 rooms (%)
Rooms in renter-occupied houses - 8 rooms (%)
Rooms in renter-occupied houses - 9+ rooms (%)
Bedrooms in owner-occupied houses - no bedrooms (%)
Bedrooms in owner-occupied houses - 1 bedroom (%)
Bedrooms in owner-occupied houses - 2 bedrooms (%)
Bedrooms in owner-occupied houses - 3 bedrooms (%)
Bedrooms in owner-occupied houses - 4 bedrooms (%)
Bedrooms in owner-occupied houses - 5+ bedrooms (%)
Bedrooms in renter-occupied houses - no bedrooms (%)
Bedrooms in renter-occupied houses - 1 bedroom (%)
Bedrooms in renter-occupied houses - 2 bedrooms (%)
Bedrooms in renter-occupied houses - 3 bedrooms (%)
Bedrooms in renter-occupied houses - 4 bedrooms (%)
Bedrooms in renter-occupied houses - 5+ bedrooms (%)
Vehicles available in owner-occupied houses - no vehicle available (%)
Vehicles available in owner-occupied houses - 1 vehicle available(%)
Vehicles available in owner-occupied houses - 2 Vehicles available (%)
Vehicles available in owner-occupied houses - 3 Vehicles available (%)
Vehicles available in owner-occupied houses - 4 Vehicles available (%)
Vehicles available in owner-occupied houses - 5+ Vehicles available (%)
Vehicles available in renter-occupied houses - no vehicle available (%)
Vehicles available in renter-occupied houses - 1 vehicle available (%)
Vehicles available in renter-occupied houses - 2 Vehicles available (%)
Vehicles available in renter-occupied houses - 3 Vehicles available (%)
Vehicles available in renter-occupied houses - 4 Vehicles available (%)
Vehicles available in renter-occupied houses - 5+ Vehicles available (%)
Housing units in structures - 1, detached (%)
Housing units in structures - 1, attached (%)
Housing units in structures - 2 (%)
Housing units in structures - 3 or 4 (%)
Housing units in structures - 5 to 9 (%)
Housing units in structures - 10 to 19 (%)
Housing units in structures - 20 to 49 (%)
Housing units in structures - 50 or more (%)
Housing units in structures - Mobile home (%)
Housing units in structures - Boat, RV, van, etc. (%)
Housing units in structures - Owners - 1, detached (%)
Housing units in structures - Owners - 1, attached (%)
Housing units in structures - Owners - 2 (%)
Housing units in structures - Owners - 3 or 4 (%)
Housing units in structures - Owners - 5 to 9 (%)
Housing units in structures - Owners - 10 to 19 (%)
Housing units in structures - Owners - 20 to 49 (%)
Housing units in structures - Owners - 50 or more (%)
Housing units in structures - Owners - Mobile home (%)
Housing units in structures - Owners - Boat, RV, van, etc. (%)
Housing units in structures - Renters - 1, detached (%)
Housing units in structures - Renters - 1, attached (%)
Housing units in structures - Renters - 2 (%)
Housing units in structures - Renters - 3 or 4 (%)
Housing units in structures - Renters - 5 to 9 (%)
Housing units in structures - Renters - 10 to 19 (%)
Housing units in structures - Renters - 20 to 49 (%)
Housing units in structures - Renters - 50 or more (%)
Housing units in structures - Renters - Mobile home (%)
Housing units in structures - Renters - Boat, RV, van, etc. (%)
House/condo owner moved in on average (years ago)
Renter moved in on average (years ago)
Year householder moved into unit - Moved in 1999 to March 2000 (%)
Year householder moved into unit - Moved in 1999 to March 2000 (%) - White
Year householder moved into unit - Moved in 1999 to March 2000 (%) - Black or African American
Year householder moved into unit - Moved in 1999 to March 2000 (%) - Asian
Year householder moved into unit - Moved in 1999 to March 2000 (%) - Hispanic or Latino
Year householder moved into unit - Moved in 1999 to March 2000 (%) - American Indian and Alaska Native
Year householder moved into unit - Moved in 1999 to March 2000 (%) - Multirace
Year householder moved into unit - Moved in 1999 to March 2000 (%) - Other Race
Year householder moved into unit - Moved in 1995 to 1998 (%)
Year householder moved into unit - Moved in 1995 to 1998 (%) - White
Year householder moved into unit - Moved in 1995 to 1998 (%) - Black or African American
Year householder moved into unit - Moved in 1995 to 1998 (%) - Asian
Year householder moved into unit - Moved in 1995 to 1998 (%) - Hispanic or Latino
Year householder moved into unit - Moved in 1995 to 1998 (%) - American Indian and Alaska Native
Year householder moved into unit - Moved in 1995 to 1998 (%) - Multirace
Year householder moved into unit - Moved in 1995 to 1998 (%) - Other Race
Year householder moved into unit - Moved in 1990 to 1994 (%)
Year householder moved into unit - Moved in 1990 to 1994 (%) - White
Year householder moved into unit - Moved in 1990 to 1994 (%) - Black or African American
Year householder moved into unit - Moved in 1990 to 1994 (%) - Asian
Year householder moved into unit - Moved in 1990 to 1994 (%) - Hispanic or Latino
Year householder moved into unit - Moved in 1990 to 1994 (%) - American Indian and Alaska Native
Year householder moved into unit - Moved in 1990 to 1994 (%) - Multirace
Year householder moved into unit - Moved in 1990 to 1994 (%) - Other Race
Year householder moved into unit - Moved in 1980 to 1989 (%)
Year householder moved into unit - Moved in 1980 to 1989 (%) - White
Year householder moved into unit - Moved in 1980 to 1989 (%) - Black or African American
Year householder moved into unit - Moved in 1980 to 1989 (%) - Asian
Year householder moved into unit - Moved in 1980 to 1989 (%) - Hispanic or Latino
Year householder moved into unit - Moved in 1980 to 1989 (%) - American Indian and Alaska Native
Year householder moved into unit - Moved in 1980 to 1989 (%) - Multirace
Year householder moved into unit - Moved in 1980 to 1989 (%) - Other Race
Year householder moved into unit - Moved in 1970 to 1979 (%)
Year householder moved into unit - Moved in 1970 to 1979 (%) - White
Year householder moved into unit - Moved in 1970 to 1979 (%) - Black or African American
Year householder moved into unit - Moved in 1970 to 1979 (%) - Asian
Year householder moved into unit - Moved in 1970 to 1979 (%) - Hispanic or Latino
Year householder moved into unit - Moved in 1970 to 1979 (%) - American Indian and Alaska Native
Year householder moved into unit - Moved in 1970 to 1979 (%) - Multirace
Year householder moved into unit - Moved in 1970 to 1979 (%) - Other Race
Year householder moved into unit - Moved in 1969 or earlier (%)
Year householder moved into unit - Moved in 1969 or earlier (%) - White
Year householder moved into unit - Moved in 1969 or earlier (%) - Black or African American
Year householder moved into unit - Moved in 1969 or earlier (%) - Asian
Year householder moved into unit - Moved in 1969 or earlier (%) - Hispanic or Latino
Year householder moved into unit - Moved in 1969 or earlier (%) - American Indian and Alaska Native
Year householder moved into unit - Moved in 1969 or earlier (%) - Multirace
Year householder moved into unit - Moved in 1969 or earlier (%) - Other Race
Housing units lacking complete plumbing facilities (%)
Housing units lacking complete kitchen facilities (%)
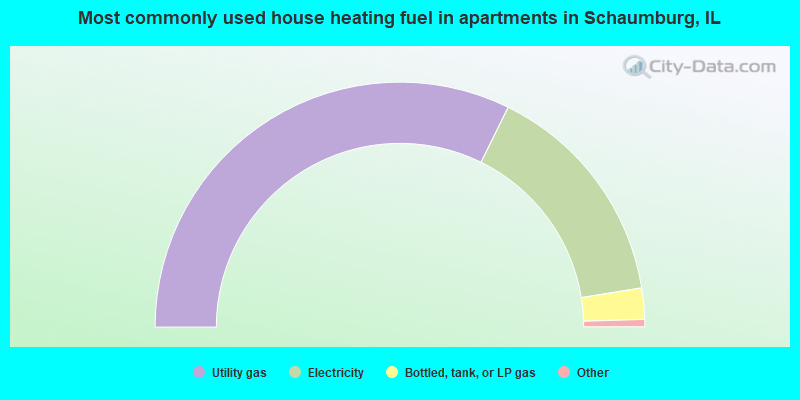
House heating fuel used in houses and condos - Utility gas (%)
House heating fuel used in houses and condos - Bottled, tank, or LP gas (%)
House heating fuel used in houses and condos - Electricity (%)
House heating fuel used in houses and condos - Fuel oil, kerosene, etc. (%)
House heating fuel used in houses and condos - Coal or coke (%)
House heating fuel used in houses and condos - Wood (%)
House heating fuel used in houses and condos - Solar energy (%)
House heating fuel used in houses and condos - Other fuel (%)
House heating fuel used in houses and condos - No fuel used (%)
House heating fuel used in apartments - Utility gas (%)
House heating fuel used in apartments - Bottled, tank, or LP gas (%)
House heating fuel used in apartments - Electricity (%)
House heating fuel used in apartments - Fuel oil, kerosene, etc. (%)
House heating fuel used in apartments - Coal or coke (%)
House heating fuel used in apartments - Wood (%)
House heating fuel used in apartments - Solar energy (%)
House heating fuel used in apartments - Other fuel (%)
House heating fuel used in apartments - No fuel used (%)
Latest news about housing in Schaumburg, IL collected exclusively by city-data.com from local newspapers, TV, and radio stations
Median year house/condo built: 1979Median year apartment built: 1980Household type by relationship:
Households: 78,285
Male householders: 18,132 (4,225 living alone ), Female householders: 13,711 (4,789 living alone )15,800 spouses (15,682 opposite-sex spouses ), 1,440 unmarried partners , (1,369 opposite-sex unmarried partners ), 24,120 children (23,018 natural , 140 adopted , 962 stepchildren ), 936 grandchildren , 428 brothers or sisters , 2,024 parents , 0 foster children , 995 other relatives , 274 non-relatives In group quarters: 425
Size of family households: 9,363 2-persons , 5,518 3-persons , 4,708 4-persons , 1,333 5-persons , 520 6-persons , 478 7-or-more-persons .
Size of nonfamily households: 9,014 1-person , 909 2-persons .
12,941 married couples with children. single-parent households (2,209 men , 2,291 women ).
58.3% of residents of Schaumburg speak English at home. of residents speak Spanish at home (70% speak English very well , 20% speak English well , 7% speak English not well , 3% don't speak English at all ).of residents speak other Indo-European language at home (72% speak English very well , 19% speak English well , 6% speak English not well , 3% don't speak English at all ).of residents speak Asian or Pacific Island language at home (70% speak English very well , 21% speak English well , 7% speak English not well , 2% don't speak English at all ).of residents speak other language at home (78% speak English very well , 18% speak English well , 1% speak English not well , 3% don't speak English at all ).
Foreign born population: 26,884 (34.3%)of them are naturalized citizens )
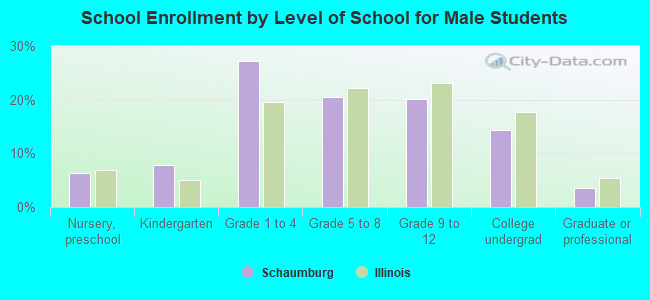
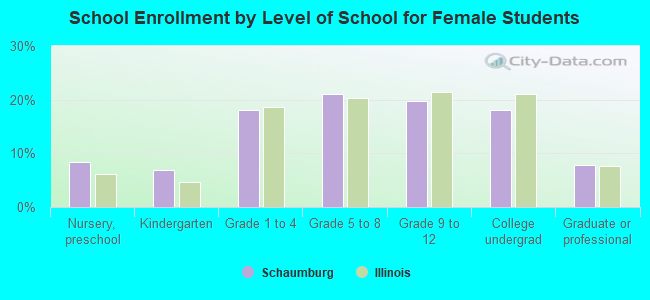
Median number of rooms in houses and condos:
Median number of rooms in apartments
Owner-occupied Renter-occupied
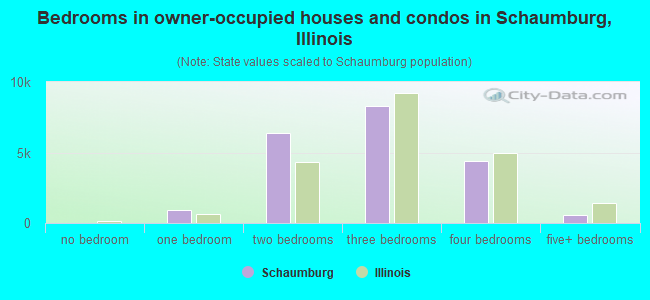
Rooms in owner-occupied houses in Schaumburg, Illinois
0 1 room 351 2 rooms 1,237 3 rooms 4,096 4 rooms 2,848 5 rooms 3,689 6 rooms 3,127 7 rooms 2,372 8 rooms 2,884 9+ rooms
Rooms in renter-occupied apartments in Schaumburg, Illinois
650 1 room 981 2 rooms 2,124 3 rooms 4,997 4 rooms 954 5 rooms 1,020 6 rooms 378 7 rooms 92 8 rooms 43 9+ rooms
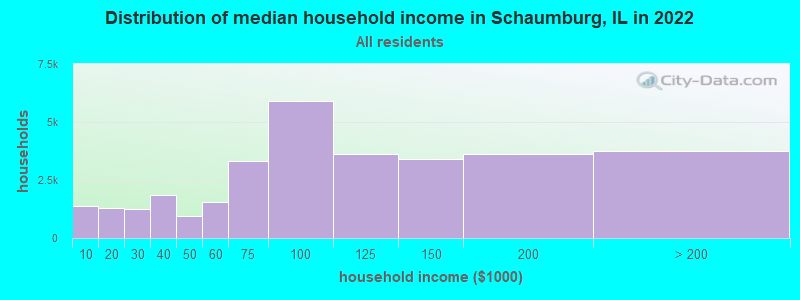
Schaumburg, IL household income distribution 1,359 Less than $10,0001,276 $10,000 to $19,9991,258 $20,000 to $29,9991,849 $30,000 to $39,999948 $40,000 to $49,9991,539 $50,000 to $59,9993,319 $60,000 to $74,9995,904 $75,000 to $99,9993,637 $100,000 to $124,9993,405 $125,000 to $149,9993,604 $150,000 to $199,9993,745 $200,000 or more
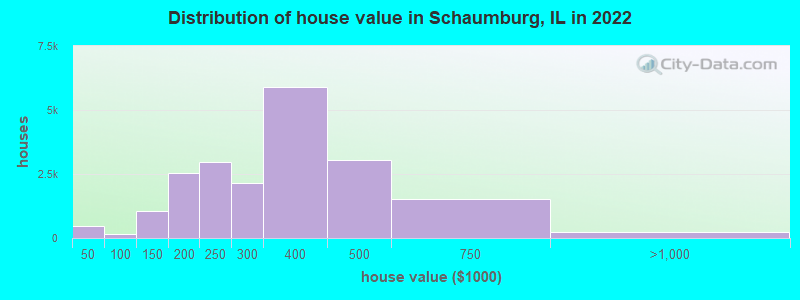
Home value of owner - occupied houses in 2022 in Schaumburg, IL 127 Less than $10,00012 $10,000 to $14,99976 $15,000 to $19,99935 $20,000 to $24,99939 $25,000 to $29,9999 $30,000 to $34,999149 $35,000 to $39,99929 $40,000 to $49,9999 $50,000 to $59,99911 $60,000 to $69,99951 $70,000 to $79,99921 $80,000 to $89,99950 $90,000 to $99,999464 $100,000 to $124,999582 $125,000 to $149,999960 $150,000 to $174,9991,585 $175,000 to $199,9992,982 $200,000 to $249,9992,144 $250,000 to $299,9995,881 $300,000 to $399,9993,033 $400,000 to $499,9991,510 $500,000 to $749,999145 $750,000 to $999,99945 $1,000,000 to $1,499,99938 $2,000,000 or moreRent paid by renters in 2022 in Schaumburg, IL 25 Less than $10037 $200 to $24946 $300 to $34924 $400 to $4497 $450 to $49981 $650 to $69937 $700 to $749254 $800 to $89996 $900 to $9991,758 $1,000 to $1,2493,221 $1,250 to $1,4995,182 $1,500 to $1,999881 $2,000 to $2,499329 $2,500 to $2,999149 $3,000 to $3,49963 $3,500 or more422 No cash rent
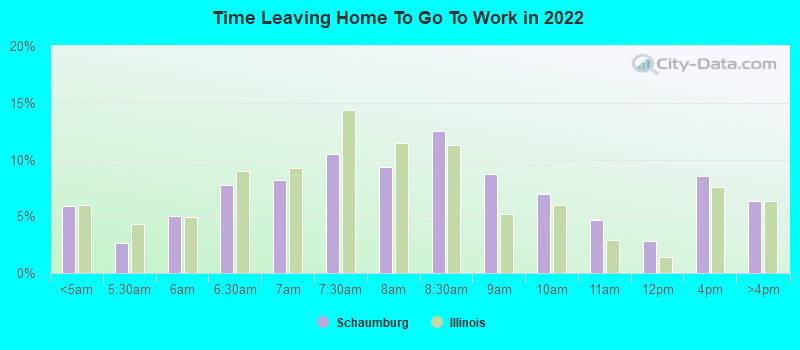
Percentage of workers working in this county: 78.5%Number of people working at home: 8,357 (20.5% of all workers )
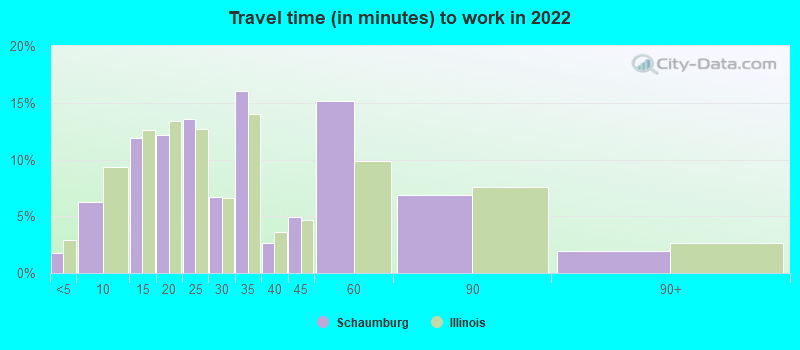
Travel time to work (commute)
Less than 5 minutes: 1,0555 to 9 minutes: 2,15110 to 14 minutes: 4,55315 to 19 minutes: 4,58720 to 24 minutes: 6,25625 to 29 minutes: 2,46830 to 34 minutes: 5,21335 to 39 minutes: 96740 to 44 minutes: 86745 to 59 minutes: 3,73060 to 89 minutes: 99190 or more minutes: 188
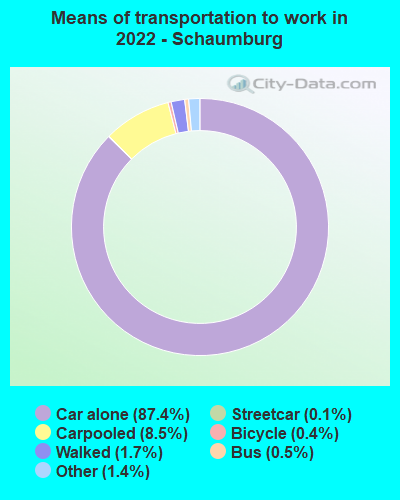
Means of transportation to work:
Drove a car alone: 51,338 (76.8%)Carpooled: 5,356 (8.0%)Bus : 262 (0.4%)Subway or elevated rail : 54 (0.1%)Long-distance train or commuter rail : 25 (0.0%)Taxi: 809 (1.2%)Bicycle: 220 (0.3%)Walked: 1,027 (1.5%)Worked at home: 8,357 (12.5%)
Unemployment by race in 2022
Unemployment rate for White non-Hispanic residents 2.5% Males0.5% FemalesUnemployment rate for Black residents 13.5% Males10.2% FemalesUnemployment rate for American Indian and Alaska Native residents 8.4% MalesUnemployment rate for Asian residents 1.6% FemalesUnemployment rate for other race residents 2.4% Males0.6% FemalesUnemployment rate for two or more race residents 9.3% Males1.3% FemalesUnemployment rate for Hispanic or Latino residents 5.5% Males0.2% Females
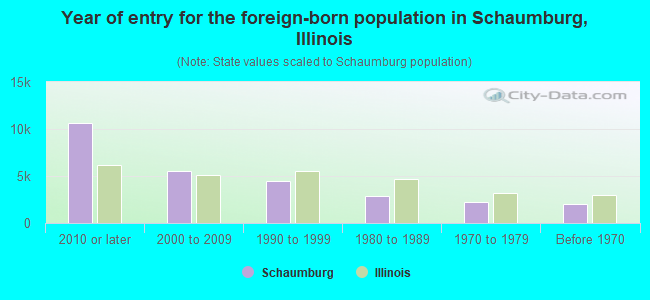
Year of entry for the foreign-born population in Schaumburg, Illinois
10,667 2010 or later 5,502 2000 to 2009 4,495 1990 to 1999 2,822 1980 to 1989 2,191 1970 to 1979 2,045 Before 1970
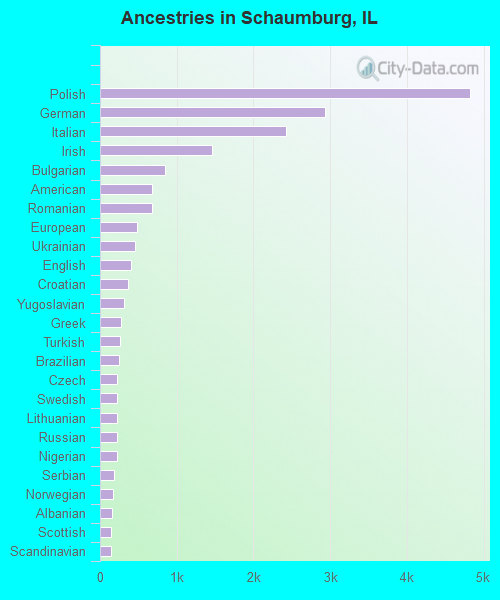
First ancestries reported:
Polish: 4,828 (11.2%)
German: 2,927 (6.8%)
Italian: 2,423 (5.6%)
Irish: 1,456 (3.4%)
Bulgarian: 842 (2.0%)
American: 681 (1.6%)
Romanian: 679 (1.6%)
European: 487 (1.1%)
Ukrainian: 456 (1.1%)
English: 408 (0.9%)
Croatian: 371 (0.9%)
Yugoslavian: 313 (0.7%)
Greek: 273 (0.6%)
Turkish: 255 (0.6%)
Brazilian: 242 (0.6%)
Czech: 224 (0.5%)
Swedish: 223 (0.5%)
Lithuanian: 221 (0.5%)
Russian: 217 (0.5%)
Nigerian: 216 (0.5%)
Serbian: 180 (0.4%)
Norwegian: 175 (0.4%)
Albanian: 162 (0.4%)
Scottish: 146 (0.3%)
Scandinavian: 141 (0.3%)
Jamaican: 122 (0.3%)
Macedonian: 115 (0.3%)
Iranian: 99 (0.2%)
Somali: 99 (0.2%)
British: 77 (0.2%)
Ethiopian: 71 (0.2%)
Assyrian: 71 (0.2%)
Portuguese: 71 (0.2%)
Moroccan: 64 (0.1%)
Dutch: 59 (0.1%)
French: 56 (0.1%)
Afghan: 56 (0.1%)
African: 54 (0.1%)
Armenian: 51 (0.1%)
Austrian: 49 (0.1%)
Eastern European: 44 (0.1%)
Ugandan: 38 (0.09%)
Palestinian: 30 (0.07%)
Czechoslovakian: 28 (0.06%)
Hungarian: 26 (0.06%)
Slovak: 25 (0.06%)
Iraqi: 24 (0.06%)
Northern European: 21 (0.05%)
Canadian: 21 (0.05%)
Danish: 21 (0.05%)
Scotch-Irish: 18 (0.04%)
Welsh: 16 (0.04%)
Jordanian: 12 (0.03%)
Belgian: 10 (0.02%)
Australian: 10 (0.02%)
Arab: 9 (0.02%)
Israeli: 6 (0.01%)
Finnish: 5 (0.01%)
Syrian: 5 (0.01%)
Swiss: 4 (0.01%)
Most common places of birth for foreign-born residents (%): India Schaumburg:
35.3% (8,552)Illinois:
9.2% (166,409)
Poland Schaumburg:
9.7% (2,347)Illinois:
6.9% (124,474)
Mexico Schaumburg:
8.1% (1,965)Illinois:
34.7% (626,958)
Philippines Schaumburg:
5.4% (1,315)Illinois:
5.2% (93,003)
Korea Schaumburg:
5.4% (1,298)Illinois:
2.2% (40,393)
Japan Schaumburg:
3.6% (878)Illinois:
0.6% (10,943)
China, excluding Hong Kong and Taiwan Schaumburg:
2.7% (649)Illinois:
4.1% (74,364)
Bulgaria Schaumburg:
2.4% (584)Illinois:
0.8% (14,165)
Ukraine Schaumburg:
2.2% (530)Illinois:
1.6% (29,316)
Pakistan Schaumburg:
2.1% (512)Illinois:
1.6% (29,519)
Place of birth for U.S.-born residents:
This state: 42,806Other state: 7,023Northeast: 790Midwest: 4,144South: 1,522West: 567 86.9% of Schaumburg residents lived in the same house 1 years ago.
Out of people who lived in different houses, 40.1% lived in this county.
Out of people who lived in different counties, 52.5% lived in Illinois.
Schaumburg:
86.9%State average:
88.3%
Education attainment for males 25 years and older:
No schooling: 125Nursery to 4th grade: 885th and 6th grade: 07th and 8th grade: 09th grade: 6110th grade: 17711th grade: 712th grade, no diploma: 122High school graduate (or equivalency): 6,072Less than 1 year of college: 1,079Some college more than 1 year, no degree: 2,987Associate degree: 1,921Bachelor's degree: 9,229Master's degree: 3,466Professional school degree: 476Doctorate degree: 426
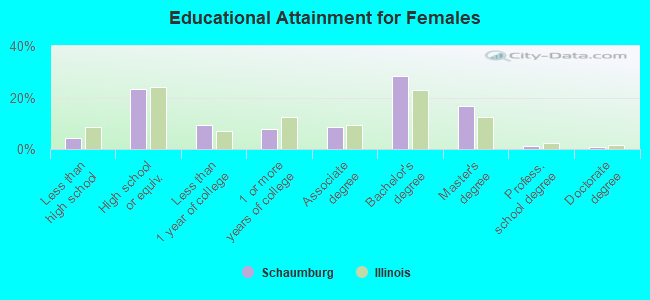
Education attainment for females 25 years and older:
No schooling: 329Nursery to 4th grade: 2955th and 6th grade: 07th and 8th grade: 499th grade: 010th grade: 011th grade: 8912th grade, no diploma: 433High school graduate (or equivalency): 6,506Less than 1 year of college: 2,605Some college more than 1 year, no degree: 2,124Associate degree: 2,437Bachelor's degree: 7,958Master's degree: 4,674Professional school degree: 285Doctorate degree: 167
Housing units in structures:
One, detached: 11,805One, attached: 6,920Two: 1303 or 4: 4,6095 to 9: 2,41410 to 19: 1,88120 to 49: 1,36450 or more: 4,085Mobile homes: 586Boats, RVs, vans, etc.: 78Housing units lacking complete plumbing facilities in 2022: 1.4%Housing units lacking complete kitchen facilities in 2022: 1.4%House/condo owner moved in on average 12 years ago
Renter moved in on average 3 years ago
Private vs. public school enrollment:
Students in private schools in grades 1 to 8 (elementary and middle school): 291 Students in private schools in grades 9 to 12 (high school): 227 Students in private undergraduate colleges: 595