Seattle, WA (Washington) Houses and Residents
Estimated median house or condo value in 2022: $924,200 (it was $252,100 in 2000 )
Seattle:
$924,200Washington:
$569,500
Lower value quartile - upper value quartile: $674,500 - $1,282,300Mean price in 2022: Detached houses: $1,274,185 Here:
$1,274,185State:
$734,307
Townhouses or other attached units: $827,273 Here:
$827,273State:
$657,697
In 2-unit structures: $675,439 Here:
$675,439State:
$534,634
In 3-to-4-unit structures: $1,828,237 Here:
$1,828,237State:
$510,239
In 5-or-more-unit structures: $626,747 Here:
$626,747State:
$503,183
Mobile homes: $218,940 Here:
$218,940State:
$218,362
Occupied boats, RVs, vans, etc.: $467,608 Here:
$467,608State:
$159,523
Total population: 668,342 (Urban population: 563,375, Rural population: 0)
Houses: 397,728 (367,119 occupied: 160,728 owner occupied, 206,391 renter occupied )
% of renters here:
56%State:
36%
Housing density: 4,742 houses/condos per square mile
Median price asked for vacant for-sale houses and condos in 2022: $569,868.
Median contract rent in 2022: $1,762 (lower quartile is $1,317, upper quartile is over $2,000)
Median rent asked for vacant for-rent units in 2022: $2,746
Median gross rent in Seattle, WA in 2022: $1,877
Housing units in Seattle with a mortgage: 113,084 (13,724 second mortgage, 343 home equity loan, 12,178 both second mortgage and home equity loan )Houses without a mortgage: 2,136
Median household income for houses/condos with a mortgage: $210,173
Median household income for apartments without a mortgage: $116,935
Median monthly housing costs: $2,087
Data:
Median house or condo value ($)
Median house or condo value ($ change since 2000)
Median house or condo value ($) - White
Median house or condo value ($) - Black or African American
Median house or condo value ($) - Asian
Median house or condo value ($) - Hispanic or Latino
Median house or condo value ($) - American Indian and Alaska Native
Median house or condo value ($) - Multirace
Median house or condo value ($) - Other Race
Median price asked for mobile homes ($)
Household density (households per square mile)
Mean house or condo value by units in structure - 1, detached ($)
Mean house or condo value by units in structure - 1, attached ($)
Mean house or condo value by units in structure - 2 ($)
Mean house or condo value by units in structure by units in structure - 3 or 4 ($)
Mean house or condo value by units in structure - 5 or more ($)
Mean house or condo value by units in structure - Boat, RV, van, etc. ($)
Mean house or condo value by units in structure - Mobile home ($)
Median contract rent ($)
Median contract rent - Lower quartile ($)
Median contract rent - Upper quartile ($)
Median gross rent ($)
Urban houses (%)
Rural houses (%)
Houses occupied (%)
Houses occupied (% change since 2000)
Houses owner occupied (%)
Houses owner occupied (% change since 2000)
Houses renter occupied (%)
Houses renter occupied (% change since 2000)
Vacant housing units - For rent (%)
Vacant housing units - For rent (% change since 2000)
Vacant housing units - For sale only (%)
Vacant housing units - For sale only (% change since 2000)
Vacant housing units - Rented or sold, not occupied (%)
Vacant housing units - Rented or sold, not occupied (% change since 2000)
Vacant housing units - For seasonal, recreational, or occasional use (%)
Vacant housing units - For seasonal, recreational, or occasional use (% change since 2000)
Vacant housing units - For migrant workers (%)
Vacant housing units - For migrant workers (% change since 2000)
Vacant housing units - Other vacant (%)
Vacant housing units - Other vacant (% change since 2000)
Median monthly housing costs ($)
Median household income for houses/condos with a mortgage ($)
Median household income for houses/condos without a mortgage ($)
Median household income ($)
Median household income ($) - White
Median household income ($) - Black or African American
Median household income ($) - Asian
Median household income ($) - Hispanic or Latino
Median household income ($) - American Indian and Alaska Native
Median household income ($) - Multirace
Median household income ($) - Other Race
Mortgage status - with mortgage (%)
Mortgage status - with second mortgage (%)
Mortgage status - with home equity loan (%)
Mortgage status - with both second mortgage and home equity loan (%)
Mortgage status - without a mortgage (%)
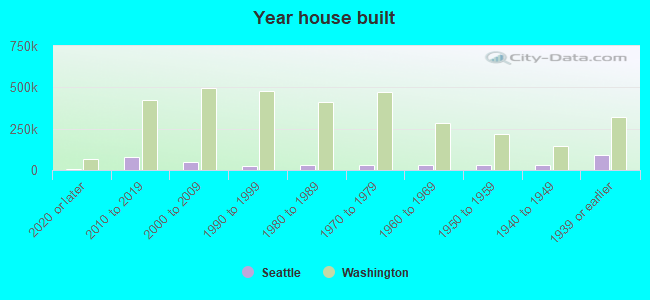
Median year house/condo built
Median year apartment built
Household type by relationship - Male householder living alone (%)
Household type by relationship - Male householder not living alone (%)
Household type by relationship - Female householder living alone (%)
Household type by relationship - Female householder not living alone (%)
Household type by relationship - Opposite-Sex spouse (%)
Household type by relationship - Same-Sex spouse (%)
Household type by relationship - Opposite-Sex unmarried partner (%)
Household type by relationship - Same-Sex unmarried partner (%)
Household type by relationship - In group quarters (%)
Size of family households - 2-person household (%)
Size of family households - 3-person household (%)
Size of family households - 4-person household (%)
Size of family households - 5-person household (%)
Size of family households - 6-person household (%)
Size of family households - 7-or-more-person household (%)
Size of nonfamily households - 1-person household (%)
Size of nonfamily households - 2-person household (%)
Size of nonfamily households - 3-person household (%)
Size of nonfamily households - 4-person household (%)
Size of nonfamily households - 5-person household (%)
Size of nonfamily households - 6-person household (%)
Size of nonfamily households - 7-or-moreperson household (%)
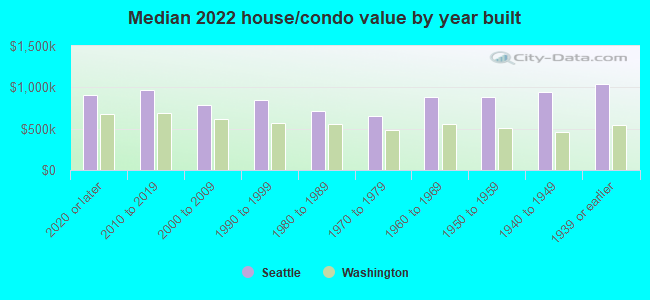
Year house built - Built 2010 or later (%)
Year house built - Built 2000 to 2009 (%)
Year house built - Built 1990 to 1999 (%)
Year house built - Built 1980 to 1989 (%)
Year house built - Built 1970 to 1979 (%)
Year house built - Built 1960 to 1969 (%)
Year house built - Built 1950 to 1959 (%)
Year house built - Built 1940 to 1949 (%)
Year house built - Built 1939 or earlier (%)
Median number of rooms in houses and condos
Median number of rooms in apartments
Median number of bedrooms in owner occupied houses
Mean number of bedrooms in owner occupied houses
Median number of bedrooms in renter occupied houses
Mean number of bedrooms in renter occupied houses
Median number of vehichles in owner occupied houses
Mean number of vehichles in owner occupied houses
Median number of vehichles in renter occupied houses
Mean number of vehichles in renter occupied houses
Rooms in owner-occupied houses - 1 room (%)
Rooms in owner-occupied houses - 2 rooms (%)
Rooms in owner-occupied houses - 3 rooms (%)
Rooms in owner-occupied houses - 4 rooms (%)
Rooms in owner-occupied houses - 5 rooms (%)
Rooms in owner-occupied houses - 6 rooms (%)
Rooms in owner-occupied houses - 7 rooms (%)
Rooms in owner-occupied houses - 8 rooms (%)
Rooms in owner-occupied houses - 9+ rooms (%)
Rooms in renter-occupied houses - 1 room (%)
Rooms in renter-occupied houses - 2 rooms (%)
Rooms in renter-occupied houses - 3 rooms (%)
Rooms in renter-occupied houses - 4 rooms (%)
Rooms in renter-occupied houses - 5 rooms (%)
Rooms in renter-occupied houses - 6 rooms (%)
Rooms in renter-occupied houses - 7 rooms (%)
Rooms in renter-occupied houses - 8 rooms (%)
Rooms in renter-occupied houses - 9+ rooms (%)
Bedrooms in owner-occupied houses - no bedrooms (%)
Bedrooms in owner-occupied houses - 1 bedroom (%)
Bedrooms in owner-occupied houses - 2 bedrooms (%)
Bedrooms in owner-occupied houses - 3 bedrooms (%)
Bedrooms in owner-occupied houses - 4 bedrooms (%)
Bedrooms in owner-occupied houses - 5+ bedrooms (%)
Bedrooms in renter-occupied houses - no bedrooms (%)
Bedrooms in renter-occupied houses - 1 bedroom (%)
Bedrooms in renter-occupied houses - 2 bedrooms (%)
Bedrooms in renter-occupied houses - 3 bedrooms (%)
Bedrooms in renter-occupied houses - 4 bedrooms (%)
Bedrooms in renter-occupied houses - 5+ bedrooms (%)
Vehicles available in owner-occupied houses - no vehicle available (%)
Vehicles available in owner-occupied houses - 1 vehicle available(%)
Vehicles available in owner-occupied houses - 2 Vehicles available (%)
Vehicles available in owner-occupied houses - 3 Vehicles available (%)
Vehicles available in owner-occupied houses - 4 Vehicles available (%)
Vehicles available in owner-occupied houses - 5+ Vehicles available (%)
Vehicles available in renter-occupied houses - no vehicle available (%)
Vehicles available in renter-occupied houses - 1 vehicle available (%)
Vehicles available in renter-occupied houses - 2 Vehicles available (%)
Vehicles available in renter-occupied houses - 3 Vehicles available (%)
Vehicles available in renter-occupied houses - 4 Vehicles available (%)
Vehicles available in renter-occupied houses - 5+ Vehicles available (%)
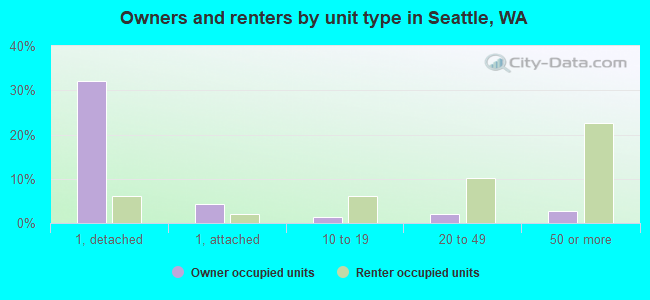
Housing units in structures - 1, detached (%)
Housing units in structures - 1, attached (%)
Housing units in structures - 2 (%)
Housing units in structures - 3 or 4 (%)
Housing units in structures - 5 to 9 (%)
Housing units in structures - 10 to 19 (%)
Housing units in structures - 20 to 49 (%)
Housing units in structures - 50 or more (%)
Housing units in structures - Mobile home (%)
Housing units in structures - Boat, RV, van, etc. (%)
Housing units in structures - Owners - 1, detached (%)
Housing units in structures - Owners - 1, attached (%)
Housing units in structures - Owners - 2 (%)
Housing units in structures - Owners - 3 or 4 (%)
Housing units in structures - Owners - 5 to 9 (%)
Housing units in structures - Owners - 10 to 19 (%)
Housing units in structures - Owners - 20 to 49 (%)
Housing units in structures - Owners - 50 or more (%)
Housing units in structures - Owners - Mobile home (%)
Housing units in structures - Owners - Boat, RV, van, etc. (%)
Housing units in structures - Renters - 1, detached (%)
Housing units in structures - Renters - 1, attached (%)
Housing units in structures - Renters - 2 (%)
Housing units in structures - Renters - 3 or 4 (%)
Housing units in structures - Renters - 5 to 9 (%)
Housing units in structures - Renters - 10 to 19 (%)
Housing units in structures - Renters - 20 to 49 (%)
Housing units in structures - Renters - 50 or more (%)
Housing units in structures - Renters - Mobile home (%)
Housing units in structures - Renters - Boat, RV, van, etc. (%)
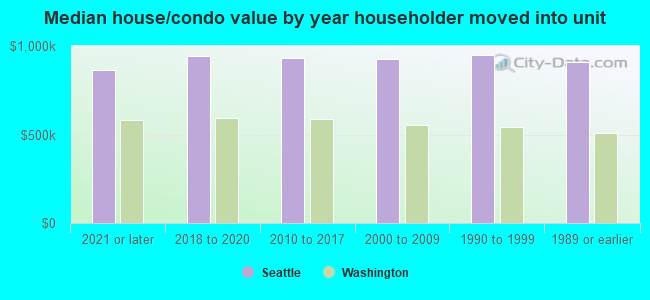
House/condo owner moved in on average (years ago)
Renter moved in on average (years ago)
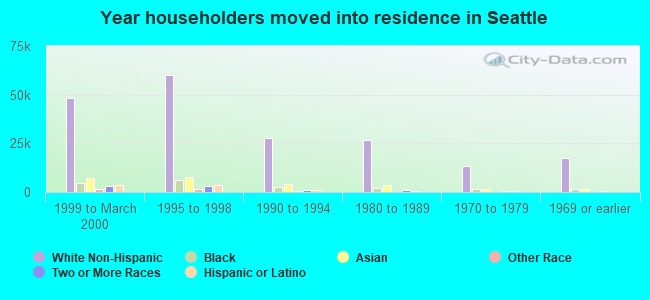
Year householder moved into unit - Moved in 1999 to March 2000 (%)
Year householder moved into unit - Moved in 1999 to March 2000 (%) - White
Year householder moved into unit - Moved in 1999 to March 2000 (%) - Black or African American
Year householder moved into unit - Moved in 1999 to March 2000 (%) - Asian
Year householder moved into unit - Moved in 1999 to March 2000 (%) - Hispanic or Latino
Year householder moved into unit - Moved in 1999 to March 2000 (%) - American Indian and Alaska Native
Year householder moved into unit - Moved in 1999 to March 2000 (%) - Multirace
Year householder moved into unit - Moved in 1999 to March 2000 (%) - Other Race
Year householder moved into unit - Moved in 1995 to 1998 (%)
Year householder moved into unit - Moved in 1995 to 1998 (%) - White
Year householder moved into unit - Moved in 1995 to 1998 (%) - Black or African American
Year householder moved into unit - Moved in 1995 to 1998 (%) - Asian
Year householder moved into unit - Moved in 1995 to 1998 (%) - Hispanic or Latino
Year householder moved into unit - Moved in 1995 to 1998 (%) - American Indian and Alaska Native
Year householder moved into unit - Moved in 1995 to 1998 (%) - Multirace
Year householder moved into unit - Moved in 1995 to 1998 (%) - Other Race
Year householder moved into unit - Moved in 1990 to 1994 (%)
Year householder moved into unit - Moved in 1990 to 1994 (%) - White
Year householder moved into unit - Moved in 1990 to 1994 (%) - Black or African American
Year householder moved into unit - Moved in 1990 to 1994 (%) - Asian
Year householder moved into unit - Moved in 1990 to 1994 (%) - Hispanic or Latino
Year householder moved into unit - Moved in 1990 to 1994 (%) - American Indian and Alaska Native
Year householder moved into unit - Moved in 1990 to 1994 (%) - Multirace
Year householder moved into unit - Moved in 1990 to 1994 (%) - Other Race
Year householder moved into unit - Moved in 1980 to 1989 (%)
Year householder moved into unit - Moved in 1980 to 1989 (%) - White
Year householder moved into unit - Moved in 1980 to 1989 (%) - Black or African American
Year householder moved into unit - Moved in 1980 to 1989 (%) - Asian
Year householder moved into unit - Moved in 1980 to 1989 (%) - Hispanic or Latino
Year householder moved into unit - Moved in 1980 to 1989 (%) - American Indian and Alaska Native
Year householder moved into unit - Moved in 1980 to 1989 (%) - Multirace
Year householder moved into unit - Moved in 1980 to 1989 (%) - Other Race
Year householder moved into unit - Moved in 1970 to 1979 (%)
Year householder moved into unit - Moved in 1970 to 1979 (%) - White
Year householder moved into unit - Moved in 1970 to 1979 (%) - Black or African American
Year householder moved into unit - Moved in 1970 to 1979 (%) - Asian
Year householder moved into unit - Moved in 1970 to 1979 (%) - Hispanic or Latino
Year householder moved into unit - Moved in 1970 to 1979 (%) - American Indian and Alaska Native
Year householder moved into unit - Moved in 1970 to 1979 (%) - Multirace
Year householder moved into unit - Moved in 1970 to 1979 (%) - Other Race
Year householder moved into unit - Moved in 1969 or earlier (%)
Year householder moved into unit - Moved in 1969 or earlier (%) - White
Year householder moved into unit - Moved in 1969 or earlier (%) - Black or African American
Year householder moved into unit - Moved in 1969 or earlier (%) - Asian
Year householder moved into unit - Moved in 1969 or earlier (%) - Hispanic or Latino
Year householder moved into unit - Moved in 1969 or earlier (%) - American Indian and Alaska Native
Year householder moved into unit - Moved in 1969 or earlier (%) - Multirace
Year householder moved into unit - Moved in 1969 or earlier (%) - Other Race
Housing units lacking complete plumbing facilities (%)
Housing units lacking complete kitchen facilities (%)
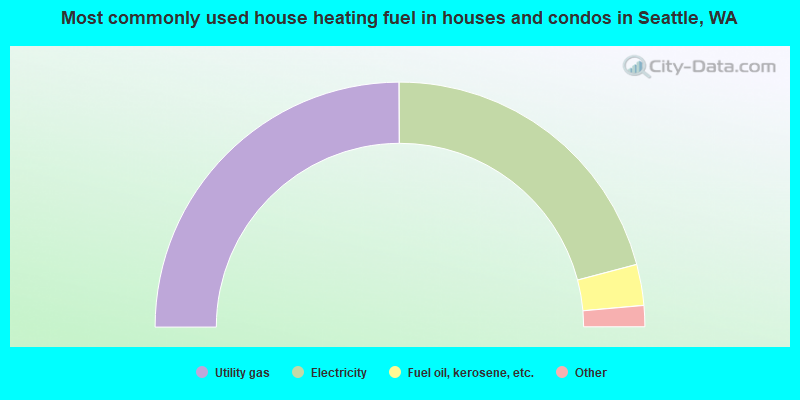
House heating fuel used in houses and condos - Utility gas (%)
House heating fuel used in houses and condos - Bottled, tank, or LP gas (%)
House heating fuel used in houses and condos - Electricity (%)
House heating fuel used in houses and condos - Fuel oil, kerosene, etc. (%)
House heating fuel used in houses and condos - Coal or coke (%)
House heating fuel used in houses and condos - Wood (%)
House heating fuel used in houses and condos - Solar energy (%)
House heating fuel used in houses and condos - Other fuel (%)
House heating fuel used in houses and condos - No fuel used (%)
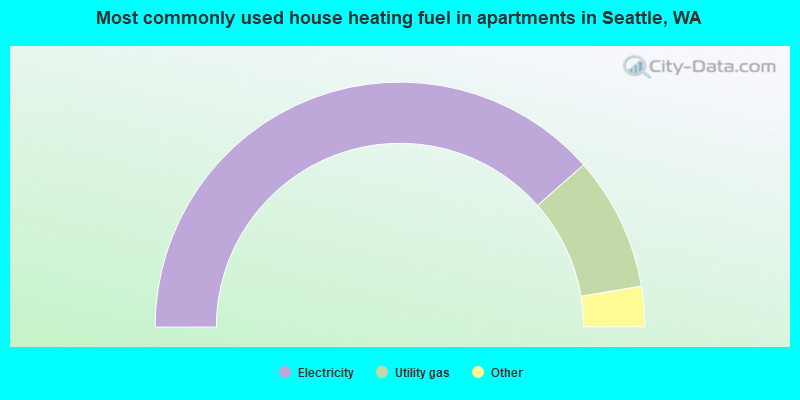
House heating fuel used in apartments - Utility gas (%)
House heating fuel used in apartments - Bottled, tank, or LP gas (%)
House heating fuel used in apartments - Electricity (%)
House heating fuel used in apartments - Fuel oil, kerosene, etc. (%)
House heating fuel used in apartments - Coal or coke (%)
House heating fuel used in apartments - Wood (%)
House heating fuel used in apartments - Solar energy (%)
House heating fuel used in apartments - Other fuel (%)
House heating fuel used in apartments - No fuel used (%)
Latest news about housing in Seattle, WA collected exclusively by city-data.com from local newspapers, TV, and radio stations
Median year house/condo built: 1955Median year apartment built: 1989Household type by relationship:
Households: 749,267
Male householders: 191,606 (80,433 living alone ), Female householders: 175,513 (75,768 living alone )121,839 spouses (116,541 opposite-sex spouses ), 42,028 unmarried partners , (36,552 opposite-sex unmarried partners ), 123,382 children (117,246 natural , 3,186 adopted , 2,950 stepchildren ), 3,482 grandchildren , 6,324 brothers or sisters , 6,725 parents , 50 foster children , 5,738 other relatives , 48,111 non-relatives In group quarters: 24,469
Size of family households: 82,023 2-persons , 31,884 3-persons , 26,835 4-persons , 7,006 5-persons , 2,032 6-persons , 858 7-or-more-persons .
Size of nonfamily households: 156,201 1-person , 50,879 2-persons , 5,231 3-persons , 2,394 4-persons , 770 5-persons , 367 6-persons , 639 7-or-more-persons .
71,258 married couples with children. single-parent households (6,195 men , 18,186 women ).
75.9% of residents of Seattle speak English at home. of residents speak Spanish at home (75% speak English very well , 16% speak English well , 4% speak English not well , 4% don't speak English at all ).of residents speak other Indo-European language at home (89% speak English very well , 8% speak English well , 3% speak English not well , 1% don't speak English at all ).of residents speak Asian or Pacific Island language at home (62% speak English very well , 18% speak English well , 13% speak English not well , 7% don't speak English at all ).of residents speak other language at home (65% speak English very well , 22% speak English well , 11% speak English not well , 2% don't speak English at all ).
Foreign born population: 152,457 (20.3%)of them are naturalized citizens )
Median number of rooms in houses and condos:
Median number of rooms in apartments
Owner-occupied Renter-occupied
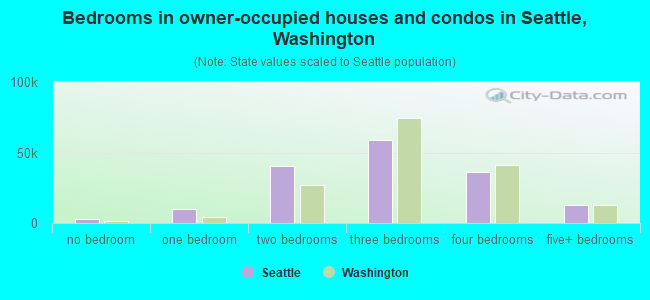
Bedrooms in owner-occupied houses and condos in Seattle, Washington
2,515 no bedroom 10,057 1 bedroom 40,353 2 bedrooms 58,983 3 bedrooms 36,065 4 bedrooms 12,755 5+ bedrooms
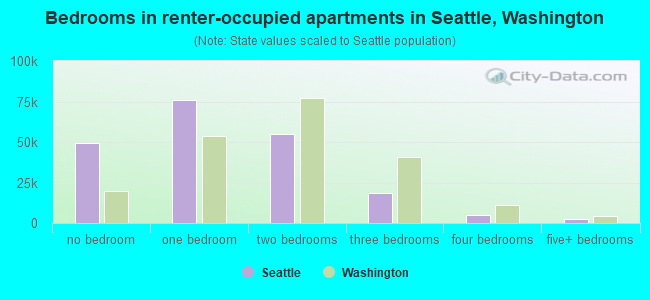
Bedrooms in renter-occupied apartments in Seattle, Washington
49,666 no bedroom 75,711 1 bedroom 55,234 2 bedrooms 18,356 3 bedrooms 4,696 4 bedrooms 2,728 5+ bedrooms
Owner-occupied Renter-occupied
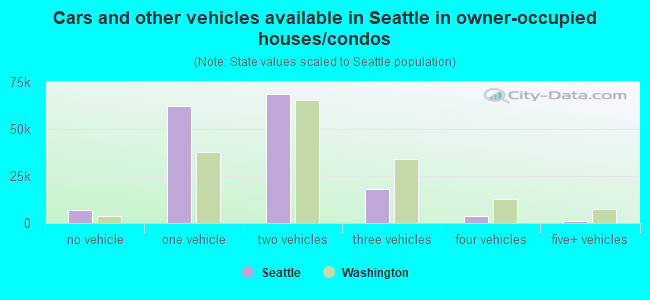
Cars and other vehicles available in Seattle in owner-occupied houses/condos
7,001 no vehicle 62,188 1 vehicle 68,598 2 vehicles 17,928 3 vehicles 3,902 4 vehicles 1,111 5+ vehicles
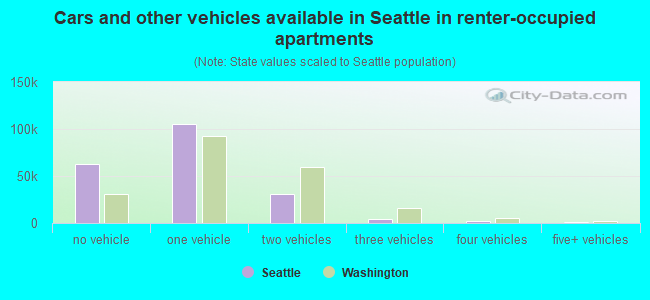
Cars and other vehicles available in Seattle in renter-occupied apartments
63,021 no vehicle 105,194 1 vehicle 30,955 2 vehicles 4,534 3 vehicles 1,698 4 vehicles 989 5+ vehicles
Owner-occupied Renter-occupied
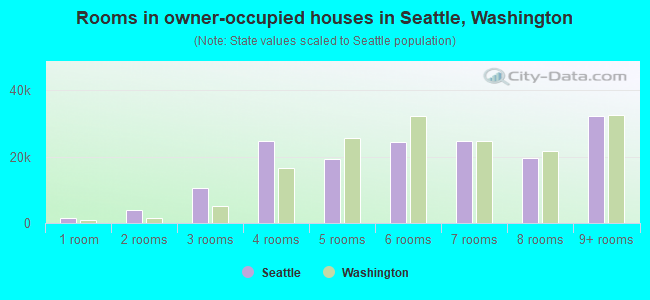
Rooms in owner-occupied houses in Seattle, Washington
1,638 1 room 3,817 2 rooms 10,501 3 rooms 24,681 4 rooms 19,384 5 rooms 24,342 6 rooms 24,559 7 rooms 19,642 8 rooms 32,164 9+ rooms
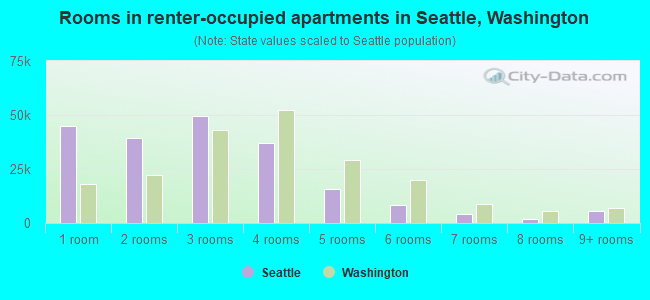
Rooms in renter-occupied apartments in Seattle, Washington
44,900 1 room 39,136 2 rooms 49,511 3 rooms 37,040 4 rooms 15,838 5 rooms 8,257 6 rooms 4,353 7 rooms 1,985 8 rooms 5,371 9+ rooms
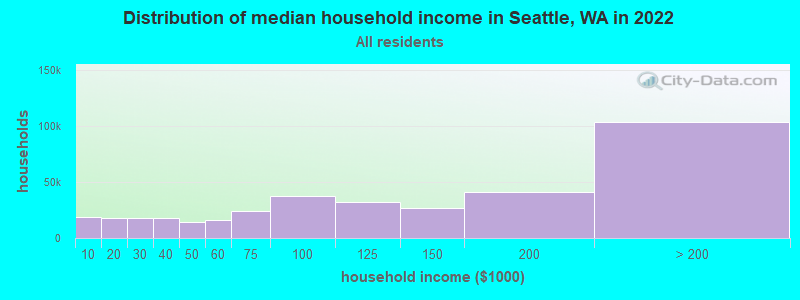
Seattle, WA household income distribution 18,315 Less than $10,00017,977 $10,000 to $19,99917,578 $20,000 to $29,99917,856 $30,000 to $39,99914,582 $40,000 to $49,99916,443 $50,000 to $59,99924,187 $60,000 to $74,99937,059 $75,000 to $99,99931,743 $100,000 to $124,99926,734 $125,000 to $149,99941,203 $150,000 to $199,999103,442 $200,000 or more
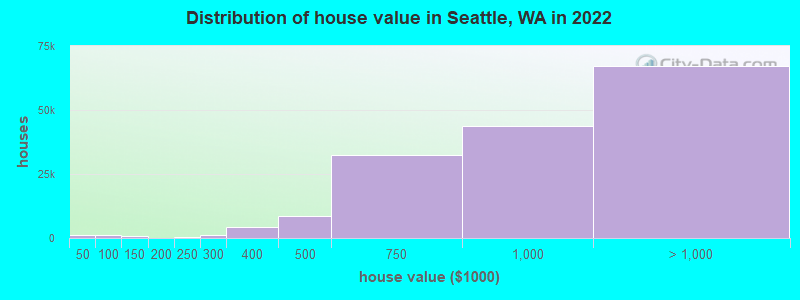
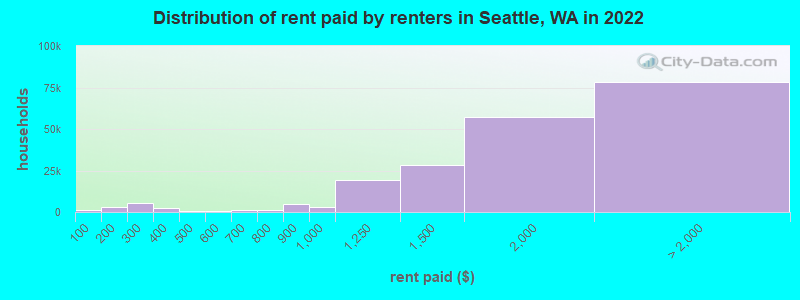
Home value of owner - occupied houses in 2022 in Seattle, WA 449 Less than $10,00089 $10,000 to $14,999317 $15,000 to $19,99955 $20,000 to $24,999231 $30,000 to $34,99949 $35,000 to $39,999269 $50,000 to $59,999286 $60,000 to $69,999215 $70,000 to $79,999328 $80,000 to $89,999552 $100,000 to $124,999233 $125,000 to $149,99992 $150,000 to $174,99950 $175,000 to $199,999445 $200,000 to $249,999983 $250,000 to $299,9994,388 $300,000 to $399,9998,615 $400,000 to $499,99932,288 $500,000 to $749,99943,681 $750,000 to $999,99936,666 $1,000,000 to $1,499,99916,143 $1,500,000 to $1,999,99914,304 $2,000,000 or moreRent paid by renters in 2022 in Seattle, WA 1,257 Less than $1001,212 $100 to $1491,624 $150 to $1994,061 $200 to $2491,515 $250 to $2991,810 $300 to $349559 $350 to $399350 $400 to $449134 $450 to $499708 $500 to $549488 $600 to $649721 $650 to $699233 $700 to $749851 $750 to $7995,072 $800 to $8993,260 $900 to $99919,043 $1,000 to $1,24928,139 $1,250 to $1,49957,120 $1,500 to $1,99933,331 $2,000 to $2,49918,284 $2,500 to $2,99911,008 $3,000 to $3,49911,152 $3,500 or more4,459 No cash rent
Percentage of workers working in this county: 97.2%Number of people working at home: 165,175 (36.0% of all workers )
Travel time to work (commute)
Less than 5 minutes: 4,7545 to 9 minutes: 20,59110 to 14 minutes: 36,28115 to 19 minutes: 42,19620 to 24 minutes: 47,30425 to 29 minutes: 25,69830 to 34 minutes: 49,70135 to 39 minutes: 10,92240 to 44 minutes: 14,17145 to 59 minutes: 24,98860 to 89 minutes: 13,43490 or more minutes: 3,466
Means of transportation to work:
Drove a car alone: 271,002 (45.3%)Carpooled: 39,545 (6.6%)Bus : 49,284 (8.2%)Subway or elevated rail : 4,823 (0.8%)Long-distance train or commuter rail : 3,002 (0.5%)Light rail, streetcar or trolley : 11,119 (1.9%)Ferryboat: 4,073 (0.7%)Taxi: 7,996 (1.3%)Bicycle: 10,376 (1.7%)Walked: 32,486 (5.4%)Worked at home: 165,175 (27.6%)
Unemployment by race in 2022
Unemployment rate for White non-Hispanic residents 3.4% Males3.8% FemalesUnemployment rate for Black residents 2.0% Males2.5% FemalesUnemployment rate for American Indian and Alaska Native residents 2.1% Males12.2% FemalesUnemployment rate for Asian residents 2.4% Males1.7% FemalesUnemployment rate for other race residents 2.8% Males9.2% FemalesUnemployment rate for two or more race residents 3.4% Males2.8% FemalesUnemployment rate for Hispanic or Latino residents 4.1% Males6.2% Females
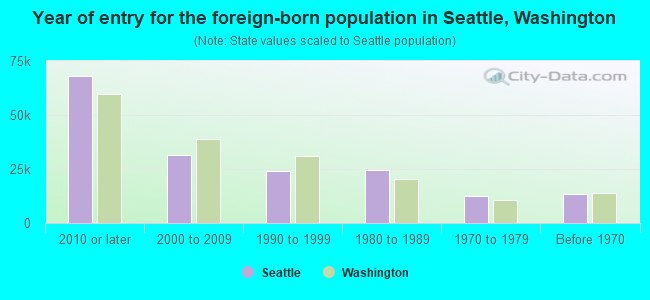
Year of entry for the foreign-born population in Seattle, Washington
68,280 2010 or later 31,318 2000 to 2009 23,929 1990 to 1999 24,703 1980 to 1989 12,456 1970 to 1979 13,648 Before 1970
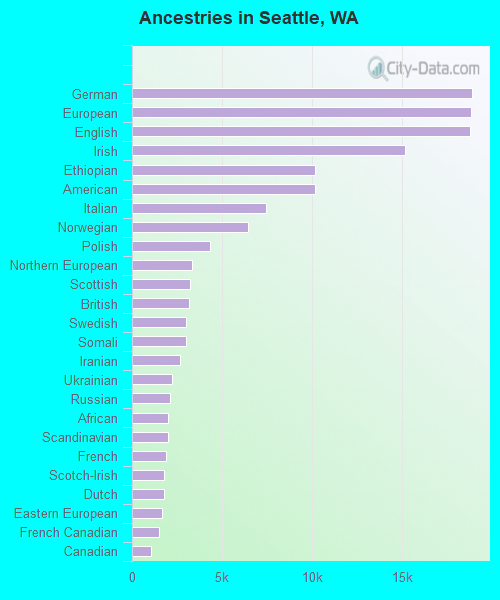
First ancestries reported:
German: 18,904 (5.4%)
European: 18,855 (5.4%)
English: 18,775 (5.4%)
Irish: 15,164 (4.4%)
Ethiopian: 10,196 (2.9%)
American: 10,187 (2.9%)
Italian: 7,467 (2.1%)
Norwegian: 6,448 (1.9%)
Polish: 4,338 (1.2%)
Northern European: 3,332 (1.0%)
Scottish: 3,218 (0.9%)
British: 3,171 (0.9%)
Swedish: 3,027 (0.9%)
Somali: 2,977 (0.9%)
Iranian: 2,675 (0.8%)
Ukrainian: 2,208 (0.6%)
Russian: 2,127 (0.6%)
African: 2,014 (0.6%)
Scandinavian: 1,991 (0.6%)
French: 1,865 (0.5%)
Scotch-Irish: 1,797 (0.5%)
Dutch: 1,760 (0.5%)
Eastern European: 1,653 (0.5%)
French Canadian: 1,481 (0.4%)
Canadian: 1,079 (0.3%)
Danish: 1,029 (0.3%)
Czech: 852 (0.2%)
Brazilian: 840 (0.2%)
Portuguese: 839 (0.2%)
Greek: 821 (0.2%)
Romanian: 813 (0.2%)
Finnish: 726 (0.2%)
Turkish: 718 (0.2%)
Armenian: 655 (0.2%)
Serbian: 634 (0.2%)
Welsh: 611 (0.2%)
Egyptian: 584 (0.2%)
Swiss: 560 (0.2%)
Croatian: 514 (0.1%)
Nigerian: 507 (0.1%)
Kenyan: 459 (0.1%)
Palestinian: 426 (0.1%)
Ghanaian: 421 (0.1%)
Austrian: 406 (0.1%)
Bulgarian: 378 (0.1%)
Iraqi: 377 (0.1%)
Latvian: 356 (0.1%)
Slovak: 330 (0.09%)
Hungarian: 325 (0.09%)
Arab: 256 (0.07%)
Australian: 242 (0.07%)
Jamaican: 231 (0.07%)
Icelander: 224 (0.06%)
Cajun: 224 (0.06%)
Haitian: 224 (0.06%)
Israeli: 219 (0.06%)
Lithuanian: 208 (0.06%)
Lebanese: 192 (0.06%)
Jordanian: 190 (0.05%)
Czechoslovakian: 189 (0.05%)
South African: 162 (0.05%)
Yugoslavian: 136 (0.04%)
West Indian: 131 (0.04%)
Basque: 130 (0.04%)
Syrian: 126 (0.04%)
Belgian: 124 (0.04%)
Macedonian: 123 (0.04%)
Ugandan: 123 (0.04%)
Slovene: 121 (0.03%)
Moroccan: 118 (0.03%)
Afghan: 118 (0.03%)
Trinidadian and Tobagonian: 105 (0.03%)
New Zealander: 92 (0.03%)
Slavic: 91 (0.03%)
Sudanese: 83 (0.02%)
Guyanese: 57 (0.02%)
Albanian: 57 (0.02%)
Celtic: 55 (0.02%)
Estonian: 53 (0.02%)
Belizean: 47 (0.01%)
Pennsylvania German: 46 (0.01%)
German Russian: 23 (0.01%)
Assyrian: 23 (0.01%)
British West Indian: 23 (0.01%)
Bahamian: 18 (0.01%)
Most common places of birth for foreign-born residents (%): China, excluding Hong Kong and Taiwan Seattle:
16.5% (25,232)Washington:
7.4% (84,470)
India Seattle:
10.7% (16,396)Washington:
8.9% (101,353)
Vietnam Seattle:
6.6% (10,137)Washington:
5.4% (62,003)
Mexico Seattle:
6.4% (9,775)Washington:
21.1% (241,655)
Philippines Seattle:
5.9% (9,045)Washington:
6.3% (71,661)
Canada Seattle:
5.2% (7,951)Washington:
4.1% (47,238)
Korea Seattle:
4.3% (6,505)Washington:
4.3% (48,886)
Ethiopia Seattle:
4.1% (6,310)Washington:
1.6% (17,938)
Taiwan Seattle:
2.8% (4,323)Washington:
1.5% (16,607)
Germany Seattle:
1.6% (2,499)Washington:
1.6% (17,761)
Japan Seattle:
1.6% (2,431)Washington:
1.5% (17,453)
Eritrea Seattle:
1.5% (2,317)Washington:
0.4% (4,688)
Place of birth for U.S.-born residents:
This state: 259,019Other state: 321,099Northeast: 56,499Midwest: 79,984South: 59,238West: 125,378 77.6% of Seattle residents lived in the same house 1 years ago.
Out of people who lived in different houses, 37.8% lived in this county.
Out of people who lived in different counties, 27.1% lived in Washington.
Seattle:
77.6%State average:
85.2%
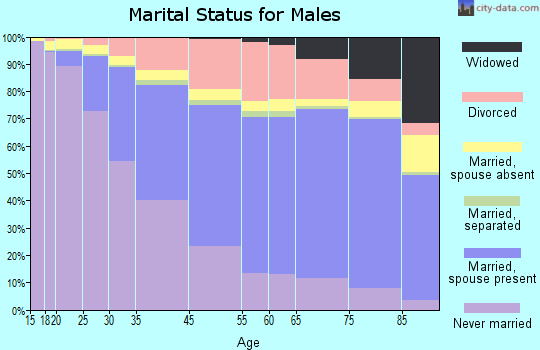
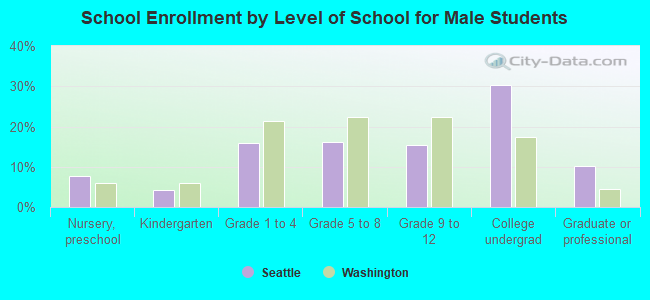
Education attainment for males 25 years and older:
No schooling: 3,819Nursery to 4th grade: 6875th and 6th grade: 9677th and 8th grade: 1,2629th grade: 2,06810th grade: 42611th grade: 1,38212th grade, no diploma: 2,347High school graduate (or equivalency): 28,613Less than 1 year of college: 14,053Some college more than 1 year, no degree: 26,460Associate degree: 16,457Bachelor's degree: 111,122Master's degree: 53,010Professional school degree: 14,689Doctorate degree: 15,328
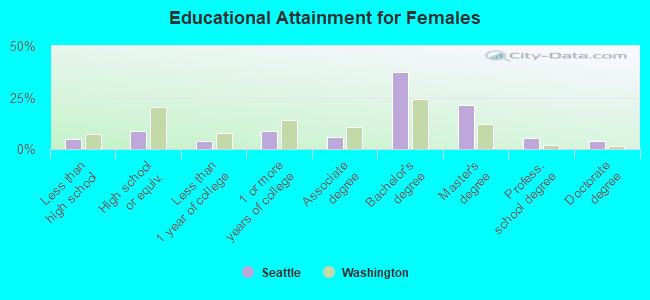
Education attainment for females 25 years and older:
No schooling: 4,733Nursery to 4th grade: 6075th and 6th grade: 1,6537th and 8th grade: 8879th grade: 1,08410th grade: 86911th grade: 90112th grade, no diploma: 2,309High school graduate (or equivalency): 24,385Less than 1 year of college: 10,643Some college more than 1 year, no degree: 23,950Associate degree: 16,419Bachelor's degree: 104,689Master's degree: 60,120Professional school degree: 14,399Doctorate degree: 11,478
Housing units in structures:
One, detached: 146,247One, attached: 24,268Two: 9,0023 or 4: 12,4685 to 9: 20,93410 to 19: 29,16120 to 49: 48,66350 or more: 105,463Mobile homes: 919Boats, RVs, vans, etc.: 603Median worth of mobile homes: $228,073
Housing units lacking complete plumbing facilities in 2022: 0.6%Housing units lacking complete kitchen facilities in 2022: 2.4%House/condo owner moved in on average 9 years ago
Renter moved in on average 1 years ago
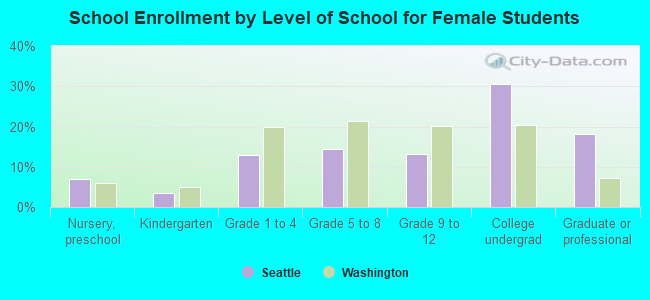
Private vs. public school enrollment:
Students in private schools in grades 1 to 8 (elementary and middle school): 7,770 Here:
17.3%Washington:
12.4%
Students in private schools in grades 9 to 12 (high school): 3,146 Here:
14.7%Washington:
9.2%
Students in private undergraduate colleges: 7,711 Here:
16.8%Washington:
16.5%