Soledad, CA (California) Houses and Residents
Estimated median house or condo value in 2022: $565,044 (it was $152,600 in 2000 )
Soledad:
$565,044California:
$715,900
Lower value quartile - upper value quartile: $468,190 - $683,935Mean price in 2022: Detached houses: $616,927 Here:
$616,927State:
$988,808
Townhouses or other attached units: $354,723 Here:
$354,723State:
$838,546
Mobile homes: $80,007 Here:
$80,007State:
$184,506
Total population: 25,336 (Urban population: 11,282 (all inside urban clusters), Rural population: 1 (all nonfarm) )
Houses: 4,638 (4,358 occupied: 2,613 owner occupied, 1,747 renter occupied )
% of renters here:
40%State:
44%
Housing density: 1,104 houses/condos per square mile
Median price asked for vacant for-sale houses and condos in 2022 in this county: $440,221.
Median contract rent in 2022: $1,304 (lower quartile is $971, upper quartile is $1,717)
Median rent asked for vacant for-rent units in 2022: $17,472
Median gross rent in Soledad, CA in 2022: $1,541
Housing units in Soledad with a mortgage: 1,578 (116 second mortgage, 0 home equity loan, 109 both second mortgage and home equity loan )Houses without a mortgage: 19
Median household income for houses/condos with a mortgage: $101,376
Median household income for apartments without a mortgage: $91,396
Median monthly housing costs: $1,545
Data:
Median house or condo value ($)
Median house or condo value ($ change since 2000)
Median house or condo value ($) - White
Median house or condo value ($) - Black or African American
Median house or condo value ($) - Asian
Median house or condo value ($) - Hispanic or Latino
Median house or condo value ($) - American Indian and Alaska Native
Median house or condo value ($) - Multirace
Median house or condo value ($) - Other Race
Median price asked for mobile homes ($)
Household density (households per square mile)
Mean house or condo value by units in structure - 1, detached ($)
Mean house or condo value by units in structure - 1, attached ($)
Mean house or condo value by units in structure - 2 ($)
Mean house or condo value by units in structure by units in structure - 3 or 4 ($)
Mean house or condo value by units in structure - 5 or more ($)
Mean house or condo value by units in structure - Boat, RV, van, etc. ($)
Mean house or condo value by units in structure - Mobile home ($)
Median contract rent ($)
Median contract rent - Lower quartile ($)
Median contract rent - Upper quartile ($)
Median gross rent ($)
Urban houses (%)
Rural houses (%)
Houses occupied (%)
Houses occupied (% change since 2000)
Houses owner occupied (%)
Houses owner occupied (% change since 2000)
Houses renter occupied (%)
Houses renter occupied (% change since 2000)
Vacant housing units - For rent (%)
Vacant housing units - For rent (% change since 2000)
Vacant housing units - For sale only (%)
Vacant housing units - For sale only (% change since 2000)
Vacant housing units - Rented or sold, not occupied (%)
Vacant housing units - Rented or sold, not occupied (% change since 2000)
Vacant housing units - For seasonal, recreational, or occasional use (%)
Vacant housing units - For seasonal, recreational, or occasional use (% change since 2000)
Vacant housing units - For migrant workers (%)
Vacant housing units - For migrant workers (% change since 2000)
Vacant housing units - Other vacant (%)
Vacant housing units - Other vacant (% change since 2000)
Median monthly housing costs ($)
Median household income for houses/condos with a mortgage ($)
Median household income for houses/condos without a mortgage ($)
Median household income ($)
Median household income ($) - White
Median household income ($) - Black or African American
Median household income ($) - Asian
Median household income ($) - Hispanic or Latino
Median household income ($) - American Indian and Alaska Native
Median household income ($) - Multirace
Median household income ($) - Other Race
Mortgage status - with mortgage (%)
Mortgage status - with second mortgage (%)
Mortgage status - with home equity loan (%)
Mortgage status - with both second mortgage and home equity loan (%)
Mortgage status - without a mortgage (%)
Median year house/condo built
Median year apartment built
Household type by relationship - Male householder living alone (%)
Household type by relationship - Male householder not living alone (%)
Household type by relationship - Female householder living alone (%)
Household type by relationship - Female householder not living alone (%)
Household type by relationship - Opposite-Sex spouse (%)
Household type by relationship - Same-Sex spouse (%)
Household type by relationship - Opposite-Sex unmarried partner (%)
Household type by relationship - Same-Sex unmarried partner (%)
Household type by relationship - In group quarters (%)
Size of family households - 2-person household (%)
Size of family households - 3-person household (%)
Size of family households - 4-person household (%)
Size of family households - 5-person household (%)
Size of family households - 6-person household (%)
Size of family households - 7-or-more-person household (%)
Size of nonfamily households - 1-person household (%)
Size of nonfamily households - 2-person household (%)
Size of nonfamily households - 3-person household (%)
Size of nonfamily households - 4-person household (%)
Size of nonfamily households - 5-person household (%)
Size of nonfamily households - 6-person household (%)
Size of nonfamily households - 7-or-moreperson household (%)
Year house built - Built 2010 or later (%)
Year house built - Built 2000 to 2009 (%)
Year house built - Built 1990 to 1999 (%)
Year house built - Built 1980 to 1989 (%)
Year house built - Built 1970 to 1979 (%)
Year house built - Built 1960 to 1969 (%)
Year house built - Built 1950 to 1959 (%)
Year house built - Built 1940 to 1949 (%)
Year house built - Built 1939 or earlier (%)
Median number of rooms in houses and condos
Median number of rooms in apartments
Median number of bedrooms in owner occupied houses
Mean number of bedrooms in owner occupied houses
Median number of bedrooms in renter occupied houses
Mean number of bedrooms in renter occupied houses
Median number of vehichles in owner occupied houses
Mean number of vehichles in owner occupied houses
Median number of vehichles in renter occupied houses
Mean number of vehichles in renter occupied houses
Rooms in owner-occupied houses - 1 room (%)
Rooms in owner-occupied houses - 2 rooms (%)
Rooms in owner-occupied houses - 3 rooms (%)
Rooms in owner-occupied houses - 4 rooms (%)
Rooms in owner-occupied houses - 5 rooms (%)
Rooms in owner-occupied houses - 6 rooms (%)
Rooms in owner-occupied houses - 7 rooms (%)
Rooms in owner-occupied houses - 8 rooms (%)
Rooms in owner-occupied houses - 9+ rooms (%)
Rooms in renter-occupied houses - 1 room (%)
Rooms in renter-occupied houses - 2 rooms (%)
Rooms in renter-occupied houses - 3 rooms (%)
Rooms in renter-occupied houses - 4 rooms (%)
Rooms in renter-occupied houses - 5 rooms (%)
Rooms in renter-occupied houses - 6 rooms (%)
Rooms in renter-occupied houses - 7 rooms (%)
Rooms in renter-occupied houses - 8 rooms (%)
Rooms in renter-occupied houses - 9+ rooms (%)
Bedrooms in owner-occupied houses - no bedrooms (%)
Bedrooms in owner-occupied houses - 1 bedroom (%)
Bedrooms in owner-occupied houses - 2 bedrooms (%)
Bedrooms in owner-occupied houses - 3 bedrooms (%)
Bedrooms in owner-occupied houses - 4 bedrooms (%)
Bedrooms in owner-occupied houses - 5+ bedrooms (%)
Bedrooms in renter-occupied houses - no bedrooms (%)
Bedrooms in renter-occupied houses - 1 bedroom (%)
Bedrooms in renter-occupied houses - 2 bedrooms (%)
Bedrooms in renter-occupied houses - 3 bedrooms (%)
Bedrooms in renter-occupied houses - 4 bedrooms (%)
Bedrooms in renter-occupied houses - 5+ bedrooms (%)
Vehicles available in owner-occupied houses - no vehicle available (%)
Vehicles available in owner-occupied houses - 1 vehicle available(%)
Vehicles available in owner-occupied houses - 2 Vehicles available (%)
Vehicles available in owner-occupied houses - 3 Vehicles available (%)
Vehicles available in owner-occupied houses - 4 Vehicles available (%)
Vehicles available in owner-occupied houses - 5+ Vehicles available (%)
Vehicles available in renter-occupied houses - no vehicle available (%)
Vehicles available in renter-occupied houses - 1 vehicle available (%)
Vehicles available in renter-occupied houses - 2 Vehicles available (%)
Vehicles available in renter-occupied houses - 3 Vehicles available (%)
Vehicles available in renter-occupied houses - 4 Vehicles available (%)
Vehicles available in renter-occupied houses - 5+ Vehicles available (%)
Housing units in structures - 1, detached (%)
Housing units in structures - 1, attached (%)
Housing units in structures - 2 (%)
Housing units in structures - 3 or 4 (%)
Housing units in structures - 5 to 9 (%)
Housing units in structures - 10 to 19 (%)
Housing units in structures - 20 to 49 (%)
Housing units in structures - 50 or more (%)
Housing units in structures - Mobile home (%)
Housing units in structures - Boat, RV, van, etc. (%)
Housing units in structures - Owners - 1, detached (%)
Housing units in structures - Owners - 1, attached (%)
Housing units in structures - Owners - 2 (%)
Housing units in structures - Owners - 3 or 4 (%)
Housing units in structures - Owners - 5 to 9 (%)
Housing units in structures - Owners - 10 to 19 (%)
Housing units in structures - Owners - 20 to 49 (%)
Housing units in structures - Owners - 50 or more (%)
Housing units in structures - Owners - Mobile home (%)
Housing units in structures - Owners - Boat, RV, van, etc. (%)
Housing units in structures - Renters - 1, detached (%)
Housing units in structures - Renters - 1, attached (%)
Housing units in structures - Renters - 2 (%)
Housing units in structures - Renters - 3 or 4 (%)
Housing units in structures - Renters - 5 to 9 (%)
Housing units in structures - Renters - 10 to 19 (%)
Housing units in structures - Renters - 20 to 49 (%)
Housing units in structures - Renters - 50 or more (%)
Housing units in structures - Renters - Mobile home (%)
Housing units in structures - Renters - Boat, RV, van, etc. (%)
House/condo owner moved in on average (years ago)
Renter moved in on average (years ago)
Year householder moved into unit - Moved in 1999 to March 2000 (%)
Year householder moved into unit - Moved in 1999 to March 2000 (%) - White
Year householder moved into unit - Moved in 1999 to March 2000 (%) - Black or African American
Year householder moved into unit - Moved in 1999 to March 2000 (%) - Asian
Year householder moved into unit - Moved in 1999 to March 2000 (%) - Hispanic or Latino
Year householder moved into unit - Moved in 1999 to March 2000 (%) - American Indian and Alaska Native
Year householder moved into unit - Moved in 1999 to March 2000 (%) - Multirace
Year householder moved into unit - Moved in 1999 to March 2000 (%) - Other Race
Year householder moved into unit - Moved in 1995 to 1998 (%)
Year householder moved into unit - Moved in 1995 to 1998 (%) - White
Year householder moved into unit - Moved in 1995 to 1998 (%) - Black or African American
Year householder moved into unit - Moved in 1995 to 1998 (%) - Asian
Year householder moved into unit - Moved in 1995 to 1998 (%) - Hispanic or Latino
Year householder moved into unit - Moved in 1995 to 1998 (%) - American Indian and Alaska Native
Year householder moved into unit - Moved in 1995 to 1998 (%) - Multirace
Year householder moved into unit - Moved in 1995 to 1998 (%) - Other Race
Year householder moved into unit - Moved in 1990 to 1994 (%)
Year householder moved into unit - Moved in 1990 to 1994 (%) - White
Year householder moved into unit - Moved in 1990 to 1994 (%) - Black or African American
Year householder moved into unit - Moved in 1990 to 1994 (%) - Asian
Year householder moved into unit - Moved in 1990 to 1994 (%) - Hispanic or Latino
Year householder moved into unit - Moved in 1990 to 1994 (%) - American Indian and Alaska Native
Year householder moved into unit - Moved in 1990 to 1994 (%) - Multirace
Year householder moved into unit - Moved in 1990 to 1994 (%) - Other Race
Year householder moved into unit - Moved in 1980 to 1989 (%)
Year householder moved into unit - Moved in 1980 to 1989 (%) - White
Year householder moved into unit - Moved in 1980 to 1989 (%) - Black or African American
Year householder moved into unit - Moved in 1980 to 1989 (%) - Asian
Year householder moved into unit - Moved in 1980 to 1989 (%) - Hispanic or Latino
Year householder moved into unit - Moved in 1980 to 1989 (%) - American Indian and Alaska Native
Year householder moved into unit - Moved in 1980 to 1989 (%) - Multirace
Year householder moved into unit - Moved in 1980 to 1989 (%) - Other Race
Year householder moved into unit - Moved in 1970 to 1979 (%)
Year householder moved into unit - Moved in 1970 to 1979 (%) - White
Year householder moved into unit - Moved in 1970 to 1979 (%) - Black or African American
Year householder moved into unit - Moved in 1970 to 1979 (%) - Asian
Year householder moved into unit - Moved in 1970 to 1979 (%) - Hispanic or Latino
Year householder moved into unit - Moved in 1970 to 1979 (%) - American Indian and Alaska Native
Year householder moved into unit - Moved in 1970 to 1979 (%) - Multirace
Year householder moved into unit - Moved in 1970 to 1979 (%) - Other Race
Year householder moved into unit - Moved in 1969 or earlier (%)
Year householder moved into unit - Moved in 1969 or earlier (%) - White
Year householder moved into unit - Moved in 1969 or earlier (%) - Black or African American
Year householder moved into unit - Moved in 1969 or earlier (%) - Asian
Year householder moved into unit - Moved in 1969 or earlier (%) - Hispanic or Latino
Year householder moved into unit - Moved in 1969 or earlier (%) - American Indian and Alaska Native
Year householder moved into unit - Moved in 1969 or earlier (%) - Multirace
Year householder moved into unit - Moved in 1969 or earlier (%) - Other Race
Housing units lacking complete plumbing facilities (%)
Housing units lacking complete kitchen facilities (%)
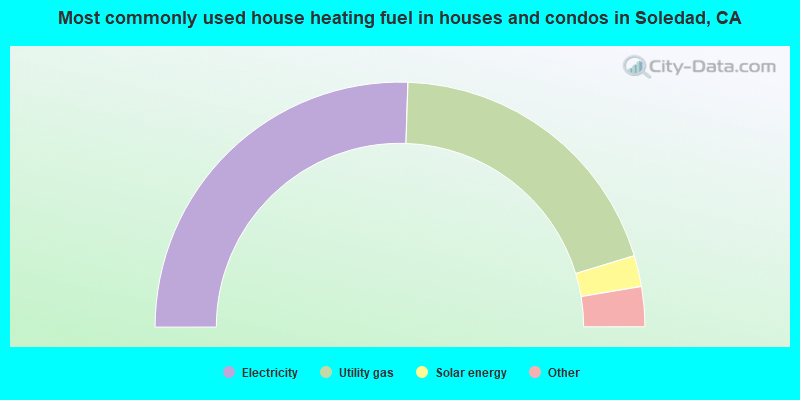
House heating fuel used in houses and condos - Utility gas (%)
House heating fuel used in houses and condos - Bottled, tank, or LP gas (%)
House heating fuel used in houses and condos - Electricity (%)
House heating fuel used in houses and condos - Fuel oil, kerosene, etc. (%)
House heating fuel used in houses and condos - Coal or coke (%)
House heating fuel used in houses and condos - Wood (%)
House heating fuel used in houses and condos - Solar energy (%)
House heating fuel used in houses and condos - Other fuel (%)
House heating fuel used in houses and condos - No fuel used (%)
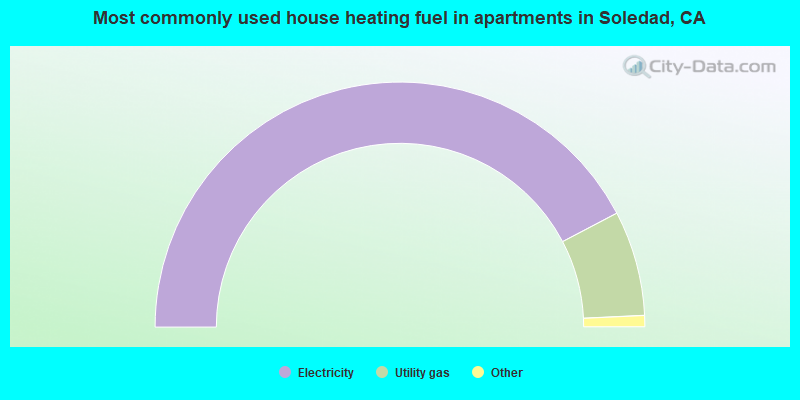
House heating fuel used in apartments - Utility gas (%)
House heating fuel used in apartments - Bottled, tank, or LP gas (%)
House heating fuel used in apartments - Electricity (%)
House heating fuel used in apartments - Fuel oil, kerosene, etc. (%)
House heating fuel used in apartments - Coal or coke (%)
House heating fuel used in apartments - Wood (%)
House heating fuel used in apartments - Solar energy (%)
House heating fuel used in apartments - Other fuel (%)
House heating fuel used in apartments - No fuel used (%)
Latest news about housing in Soledad, CA collected exclusively by city-data.com from local newspapers, TV, and radio stations
Median year house/condo built: 1998Median year apartment built: 1992Household type by relationship:
Households: 24,511
Male householders: 2,007 (194 living alone ), Female householders: 2,259 (253 living alone )2,779 spouses (2,766 opposite-sex spouses ), 279 unmarried partners , (279 opposite-sex unmarried partners ), 7,688 children (7,235 natural , 172 adopted , 280 stepchildren ), 716 grandchildren , 287 brothers or sisters , 332 parents , 31 foster children , 933 other relatives , 467 non-relatives In group quarters: 6,727
Size of family households: 420 2-persons , 794 3-persons , 652 4-persons , 1,199 5-persons , 415 6-persons , 363 7-or-more-persons .
Size of nonfamily households: 449 1-person , 41 2-persons , 13 3-persons , 29 5-persons .
2,986 married couples with children. single-parent households (553 men , 1,220 women ).
31.2% of residents of Soledad speak English at home. of residents speak Spanish at home (53% speak English very well , 14% speak English well , 17% speak English not well , 16% don't speak English at all ).of residents speak other Indo-European language at home (90% speak English very well , 10% speak English well ).of residents speak Asian or Pacific Island language at home (61% speak English very well , 17% speak English well , 11% speak English not well , 11% don't speak English at all ).of residents speak other language at home (100% speak English very well ).
Foreign born population: 7,646 (31.2%)of them are naturalized citizens )
Median number of rooms in houses and condos:
Median number of rooms in apartments
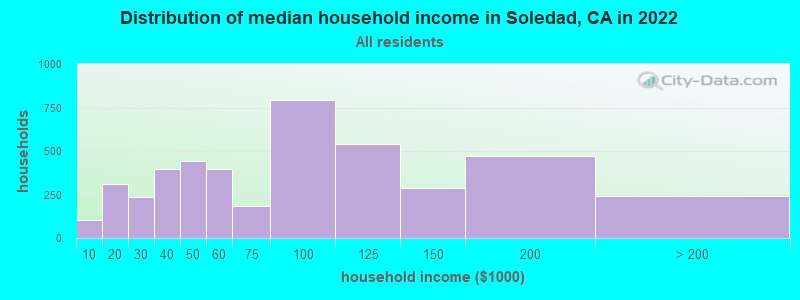
Soledad, CA household income distribution 105 Less than $10,000309 $10,000 to $19,999236 $20,000 to $29,999394 $30,000 to $39,999445 $40,000 to $49,999394 $50,000 to $59,999185 $60,000 to $74,999793 $75,000 to $99,999539 $100,000 to $124,999288 $125,000 to $149,999469 $150,000 to $199,999241 $200,000 or more
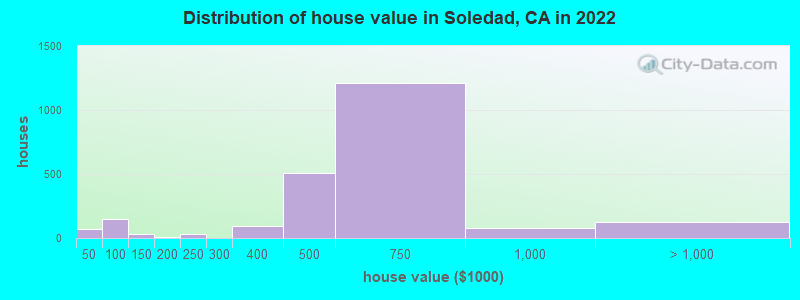
Home value of owner - occupied houses in 2022 in Soledad, CA 47 Less than $10,00021 $30,000 to $34,99934 $70,000 to $79,999117 $80,000 to $89,99931 $100,000 to $124,9997 $175,000 to $199,99929 $200,000 to $249,9992 $250,000 to $299,99996 $300,000 to $399,999504 $400,000 to $499,9991,210 $500,000 to $749,99977 $750,000 to $999,99985 $1,000,000 to $1,499,99910 $1,500,000 to $1,999,99931 $2,000,000 or moreRent paid by renters in 2022 in Soledad, CA 19 $100 to $14938 $200 to $24952 $250 to $29928 $350 to $39938 $400 to $44939 $500 to $54931 $750 to $799116 $800 to $89930 $900 to $999302 $1,000 to $1,249262 $1,250 to $1,499509 $1,500 to $1,999106 $2,000 to $2,49953 $2,500 to $2,999
Percentage of workers working in this county: 94.6%Number of people working at home: 153 (2.2% of all workers )
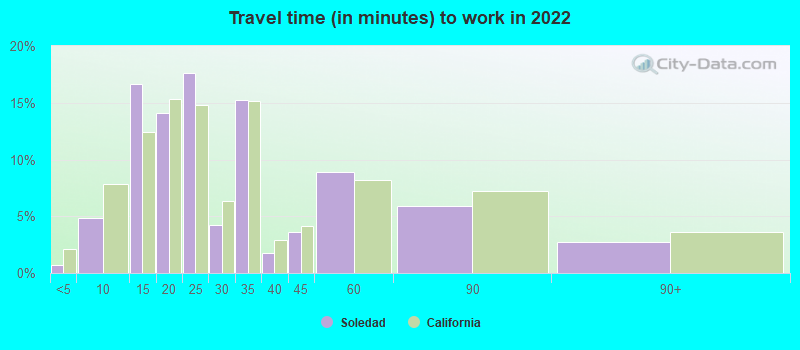
Travel time to work (commute)
Less than 5 minutes: 445 to 9 minutes: 24110 to 14 minutes: 81915 to 19 minutes: 1,06320 to 24 minutes: 1,81825 to 29 minutes: 14630 to 34 minutes: 1,08835 to 39 minutes: 27240 to 44 minutes: 35445 to 59 minutes: 20160 to 89 minutes: 37490 or more minutes: 216
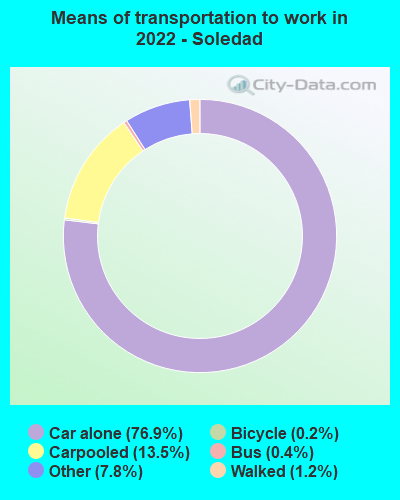
Means of transportation to work:
Drove a car alone: 3,940 (72.9%)Carpooled: 625 (11.6%)Bus : 39 (0.7%)Taxi: 311 (5.8%)Bicycle: 16 (0.3%)Walked: 75 (1.4%)Worked at home: 153 (2.8%)
Unemployment by race in 2022
Unemployment rate for White non-Hispanic residents 7.4% FemalesUnemployment rate for Black residents 100.0% MalesUnemployment rate for other race residents 3.0% Males2.3% FemalesUnemployment rate for two or more race residents 5.4% Males2.7% FemalesUnemployment rate for Hispanic or Latino residents 3.3% Males1.6% Females
Year of entry for the foreign-born population in Soledad, California
1,162 2010 or later 1,493 2000 to 2009 1,987 1990 to 1999 1,056 1980 to 1989 945 1970 to 1979 721 Before 1970
First ancestries reported:
African: 689 (3.4%)
English: 299 (1.5%)
German: 102 (0.5%)
Ukrainian: 96 (0.5%)
American: 85 (0.4%)
Irish: 69 (0.3%)
French: 57 (0.3%)
Polish: 49 (0.2%)
Italian: 43 (0.2%)
Eastern European: 40 (0.2%)
Nigerian: 36 (0.2%)
European: 32 (0.2%)
Palestinian: 26 (0.1%)
Scottish: 24 (0.1%)
Portuguese: 21 (0.1%)
Scotch-Irish: 13 (0.06%)
Belizean: 10 (0.05%)
Armenian: 7 (0.03%)
Swedish: 7 (0.03%)
Sudanese: 6 (0.03%)
British: 5 (0.02%)
Somali: 5 (0.02%)
Northern European: 4 (0.02%)
Haitian: 3 (0.01%)
Norwegian: 2 (0.01%)
Russian: 2 (0.01%) Most common places of birth for foreign-born residents (%): Mexico Soledad:
83.1% (6,250)California:
37.2% (3,881,193)
El Salvador Soledad:
3.4% (255)California:
4.2% (440,287)
Philippines Soledad:
1.9% (142)California:
7.8% (818,297)
Colombia Soledad:
1.7% (125)California:
0.5% (55,249)
Guatemala Soledad:
1.6% (123)California:
2.8% (290,436)
Place of birth for U.S.-born residents:
This state: 15,306Other state: 1,485Northeast: 164Midwest: 172South: 688West: 486 89.5% of Soledad residents lived in the same house 1 years ago.
Out of people who lived in different houses, 17.5% lived in this county.
Out of people who lived in different counties, 94.5% lived in California.
Soledad:
89.5%State average:
88.9%
Education attainment for males 25 years and older:
No schooling: 468Nursery to 4th grade: 4205th and 6th grade: 1,0597th and 8th grade: 3149th grade: 78410th grade: 52411th grade: 1,13412th grade, no diploma: 426High school graduate (or equivalency): 3,206Less than 1 year of college: 720Some college more than 1 year, no degree: 1,258Associate degree: 584Bachelor's degree: 359Master's degree: 182Professional school degree: 0Doctorate degree: 0
Education attainment for females 25 years and older:
No schooling: 306Nursery to 4th grade: 2875th and 6th grade: 7457th and 8th grade: 1729th grade: 24310th grade: 9911th grade: 3912th grade, no diploma: 65High school graduate (or equivalency): 1,368Less than 1 year of college: 240Some college more than 1 year, no degree: 211Associate degree: 495Bachelor's degree: 358Master's degree: 54Professional school degree: 0Doctorate degree: 21
Housing units in structures:
One, detached: 3,251One, attached: 230Two: 1703 or 4: 2645 to 9: 15610 to 19: 13620 to 49: 3750 or more: 101Mobile homes: 289Median worth of mobile homes: $108,524
House/condo owner moved in on average 10 years ago
Renter moved in on average 7 years ago
Private vs. public school enrollment:
Students in private schools in grades 1 to 8 (elementary and middle school): 0 Here:
0.0%California:
10.5%
Students in private schools in grades 9 to 12 (high school): 337 Here:
12.2%California:
8.5%
Students in private undergraduate colleges: 161 Here:
11.3%California:
15.9%