South Chicago Heights, IL (Illinois) Houses and Residents
| South Chicago Heights: | $124,685 |
| Illinois: | $251,600 |
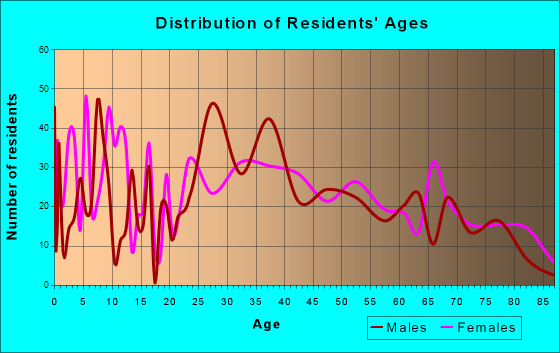
Total population: 4,157 (Urban population: 3,975, Rural population: 0)
Houses: 1,705 (1,596 occupied: 1,125 owner occupied, 498 renter occupied)
| % of renters here: | 31% |
| State: | 33% |
Housing density: 1,111 houses/condos per square mile
Median price asked for vacant for-sale houses and condos in 2022 in this county: $235,866.
Median contract rent in 2022: $879 (lower quartile is $751, upper quartile is $1,117)
Median rent asked for vacant for-rent units in 2022: $1,027
Median gross rent in South Chicago Heights, IL in 2022: $986
Housing units in South Chicago Heights with a mortgage: 424 (25 second mortgage, 0 home equity loan, 15 both second mortgage and home equity loan)
Houses without a mortgage: 17
Median household income for houses/condos with a mortgage: $85,422
Median household income for apartments without a mortgage: $57,464
Median monthly housing costs: $920
Compare current foreclosures near South Chicago Heights, IL:
| Photo | Address | Area | Beds / Baths | Price | Details |
|---|---|---|---|---|---|

|
#1
Idlewild Dr
Country Club Hills, IL 60478
|
1,300 sq. feet
|
1 baths 3 beds |
$279,900
|
show details |

|
#2
S Perry Ave
Chicago, IL 60628
|
1,248 sq. feet
|
1 baths 3 beds |
$104,000
|
show details |

|
#3
Hellenic Dr
Olympia Fields, IL 60461
|
4,000 sq. feet
|
3 baths 4 beds |
$495,000
|
show details |

|
#4
Marquette Ave
Calumet City, IL 60409
|
1,316 sq. feet
|
1 baths 3 beds |
$144,000
|
show details |

|
#5
Finch Ave
Harvey, IL 60426
|
1,108 sq. feet
|
2 baths 3 beds |
$225,000
|
show details |

|
#6
John St
Whiting, IN 46394
|
1,320 sq. feet
|
2 baths 3 beds |
$169,900
|
show details |

|
#7
Lincoln Ave
Dolton, IL 60419
|
1,966 sq. feet
|
2 baths 3 beds |
$69,900
|
show details |

|
#8
W 53rd Ln
Merrillville, IN 46410
|
1,194 sq. feet
|
1 baths 3 beds |
$235,000
|
show details |

|
#9
176th Pl
Lansing, IL 60438
|
1,511 sq. feet
|
1 baths 2 beds |
$187,200
|
show details |

|
#10
N Bruce Ln Apt 311
Glenwood, IL 60425
|
1,000 sq. feet
|
2 baths 2 beds |
$185,000
|
show details |
| Photo | Address | Area | Beds / Baths | Price | Details |
|---|---|---|---|---|---|

|
#11
Prairie Ave
Calumet City, IL 60409
|
2,841 sq. feet
|
2 baths 6 beds |
$159,500
|
show details |

|
#12
Tarpon Ct
Homewood, IL 60430
|
1,800 sq. feet
|
3 baths 4 beds |
$355,000
|
show details |

|
#13
Ellsworth Pl
Gary, IN 46408
|
1,248 sq. feet
|
1 baths 2 beds |
$79,900
|
show details |

|
#14
W 100th Pl
Chicago, IL 60628
|
971 sq. feet
|
1 baths 2 beds |
$233,000
|
show details |

|
#15
W Margaret St
Monee, IL 60449
|
1,680 sq. feet
|
2 baths 4 beds |
$287,000
|
show details |

|
#16
145th St
Midlothian, IL 60445
|
2,000 sq. feet
|
1 baths 3 beds |
$199,900
|
show details |

|
#17
Dorchester Ave
Dolton, IL 60419
|
925 sq. feet
|
1 baths 3 beds |
$86,100
|
show details |

|
#18
Peoria St
Steger, IL 60475
|
616 sq. feet
|
1 baths 2 beds |
$78,500
|
show details |

|
#19
Richton Rd
Steger, IL 60475
|
1,400 sq. feet
|
1 baths 3 beds |
$209,900
|
show details |

|
#20
S Normal Ave
Chicago, IL 60628
|
989 sq. feet
|
1 baths 3 beds |
$154,375
|
show details |
| Photo | Address | Area | Beds / Baths | Price | Details |
|---|---|---|---|---|---|

|
#21
S Calumet Ave
Chicago, IL 60628
|
3,690 sq. feet
|
3 baths 6 beds |
$275,000
|
show details |

|
#22
W 108th St Apt D
Chicago, IL 60643
|
1,300 sq. feet
|
2 baths 3 beds |
$150,000
|
show details |

|
#23
S Ingleside Ave
Chicago, IL 60628
|
1,584 sq. feet
|
2 baths 3 beds |
$131,750
|
show details |

|
#24
S Yale Ave
Chicago, IL 60628
|
1,608 sq. feet
|
2 baths 3 beds |
$270,000
|
show details |

|
#25
W Arquilla Dr
Palos Heights, IL 60463
|
1,780 sq. feet
|
2 baths 2 beds |
$309,000
|
show details |

|
#26
Greenwood Rd Apt B210
Dolton, IL 60419
|
900 sq. feet
|
1 baths 2 beds |
$85,000
|
show details |

|
#27
W 106th St
Chicago, IL 60643
|
1,212 sq. feet
|
3 baths 5 beds |
$244,900
|
show details |

|
#28
E 93rd St
Chicago, IL 60619
|
- sq. feet
|
3 baths 3 beds |
$215,500
|
show details |

|
#29
S Charles St
Chicago, IL 60643
|
- sq. feet
|
4 baths 6 beds |
$369,900
|
show details |

|
#30
S Iris Ct
Monee, IL 60449
|
- sq. feet
|
2 baths 4 beds |
$309,900
|
show details |
| Photo | Address | Area | Beds / Baths | Price | Details |
|---|---|---|---|---|---|

|
#31
Jefferson St
Dolton, IL 60419
|
1,209 sq. feet
|
1 baths - beds |
$116,900
|
show details |

|
#32
S La Salle St
Chicago, IL 60628
|
1,919 sq. feet
|
2 baths 6 beds |
show details | |

|
#33
S Cicero Ave Apt 2c
Oak Lawn, IL 60453
|
1,200 sq. feet
|
1 baths 2 beds |
show details | |

|
#34
Laramie Ave Apt 214
Midlothian, IL 60445
|
1,200 sq. feet
|
2 baths 2 beds |
show details | |

|
#35
Kasten Dr
Dolton, IL 60419
|
1,121 sq. feet
|
1 baths - beds |
$69,900
|
show details |

|
#36
S California Ave
Posen, IL 60469
|
1,326 sq. feet
|
2 baths 2 beds |
show details | |

|
#37
W 114th St
Chicago, IL 60628
|
1,248 sq. feet
|
1 baths 3 beds |
show details | |

|
#38
Gentry St
Park Forest, IL 60466
|
1,224 sq. feet
|
1 baths 3 beds |
show details | |

|
#39
S Calumet Ave
Chicago, IL 60628
|
840 sq. feet
|
1 baths 2 beds |
show details | |

|
#40
Binford Dr
Orland Park, IL 60462
|
3,374 sq. feet
|
2 baths 4 beds |
show details |
| Photo | Address | Area | Beds / Baths | Price | Details |
|---|---|---|---|---|---|

|
#41
Irving Ave
Dolton, IL 60419
|
1,250 sq. feet
|
1 baths 3 beds |
show details | |

|
#42
Hirsch Ave
Calumet City, IL 60409
|
1,166 sq. feet
|
1 baths 3 beds |
show details | |

|
#43
S Maryland Ave
Chicago, IL 60628
|
772 sq. feet
|
1 baths 2 beds |
show details | |

|
#44
S Perry Ave
Chicago, IL 60628
|
1,517 sq. feet
|
2 baths 4 beds |
show details | |

|
#45
Linden Rd
Homewood, IL 60430
|
1,750 sq. feet
|
2 baths 4 beds |
show details | |

|
#46
S Wentworth Ave
Chicago, IL 60628
|
1,027 sq. feet
|
1 baths 3 beds |
show details | |

|
#47
Dorchester Ave
Dolton, IL 60419
|
1,089 sq. feet
|
1 baths 3 beds |
show details | |

|
#48
S Wentworth Ave
Riverdale, IL 60827
|
1,078 sq. feet
|
1 baths 2 beds |
show details | |

|
#49
187th St
Country Club Hills, IL 60478
|
2,296 sq. feet
|
2 baths 4 beds |
show details | |

|
Check over 1 million property listings on Foreclosure.com!
|
browse all offers | |||


 | Stuck in Harvey (14 replies) |
| Home break ins and car break in the suburbs (20 replies) |
| Moving to park forest need help (8 replies) |
| Chicago Burbs Relocation Advice Needed (23 replies) |
| Considering move to Chicago Heights area (18 replies) |
| Chicago Heights ??? (11 replies) |
Median year apartment built: 1968
Household type by relationship:
Households: 3,897- Male householders: 821 (263 living alone), Female householders: 733 (264 living alone)
602 spouses (602 opposite-sex spouses), 72 unmarried partners, (72 opposite-sex unmarried partners), 1,404 children (1,347 natural, 0 adopted, 56 stepchildren), 12 grandchildren, 16 brothers or sisters, 96 parents, 0 foster children, 4 other relatives, 60 non-relatives
- In group quarters: 72
Size of family households: 416 2-persons, 244 3-persons, 145 4-persons, 183 5-persons.
Size of nonfamily households: 566 1-person, 58 2-persons.
407 married couples with children.
596 single-parent households (165 men, 431 women).
66.4% of residents of South Chicago Heights speak English at home.
32.4% of residents speak Spanish at home (58% speak English very well, 22% speak English well, 19% speak English not well).
0.6% of residents speak Asian or Pacific Island language at home (61% speak English very well, 39% speak English well).
0.1% of residents speak other language at home (100% speak English very well).
Foreign born population: 639 (16.4%)
(28.8% of them are naturalized citizens)
| Here: | 5.9 |
| State: | 6.4 |
| Here: | 4.0 |
| State: | 4.1 |

- Bedrooms in owner-occupied houses and condos in South Chicago Heights, Illinois
- 79no bedroom
- 91 bedroom
- 2042 bedrooms
- 5703 bedrooms
- 2634 bedrooms
- 15+ bedrooms

- Bedrooms in renter-occupied apartments in South Chicago Heights, Illinois
- 21no bedroom
- 1691 bedroom
- 1862 bedrooms
- 1123 bedrooms
- 104 bedrooms
- 05+ bedrooms

- Cars and other vehicles available in South Chicago Heights in owner-occupied houses/condos
- 50no vehicle
- 1991 vehicle
- 4562 vehicles
- 2943 vehicles
- 1144 vehicles
- 125+ vehicles

- Cars and other vehicles available in South Chicago Heights in renter-occupied apartments
- 252no vehicle
- 2201 vehicle
- 272 vehicles
- 03 vehicles
- 04 vehicles
- 05+ vehicles

- Rooms in owner-occupied houses in South Chicago Heights, Illinois
- 791 room
- 02 rooms
- 03 rooms
- 784 rooms
- 3025 rooms
- 2346 rooms
- 2697 rooms
- 1148 rooms
- 509+ rooms

- Rooms in renter-occupied apartments in South Chicago Heights, Illinois
- 211 room
- 812 rooms
- 1103 rooms
- 634 rooms
- 1155 rooms
- 776 rooms
- 207 rooms
- 08 rooms
- 109+ rooms


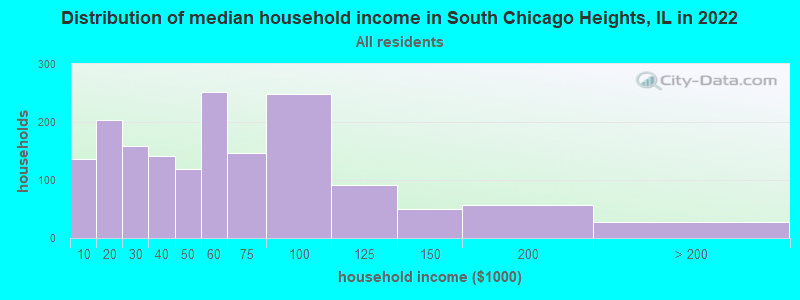
South Chicago Heights, IL household income distribution

- 136Less than $10,000
- 204$10,000 to $19,999
- 159$20,000 to $29,999
- 142$30,000 to $39,999
- 119$40,000 to $49,999
- 251$50,000 to $59,999
- 147$60,000 to $74,999
- 249$75,000 to $99,999
- 92$100,000 to $124,999
- 50$125,000 to $149,999
- 57$150,000 to $199,999
- 28$200,000 or more
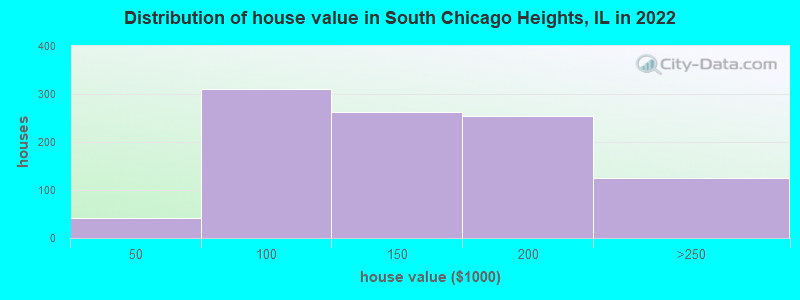
Home value of owner - occupied houses in 2022 in South Chicago Heights, IL
-
- 15$10,000 to $14,999
- 26$40,000 to $49,999
- 105$50,000 to $59,999
- 21$60,000 to $69,999
- 7$70,000 to $79,999
- 101$80,000 to $89,999
- 47$90,000 to $99,999
- 150$100,000 to $124,999
- 112$125,000 to $149,999
- 173$150,000 to $174,999
- 80$175,000 to $199,999
- 124$200,000 to $249,999
Rent paid by renters in 2022 in South Chicago Heights, IL
-
- 72$300 to $349
- 20$600 to $649
- 24$700 to $749
- 54$750 to $799
- 100$800 to $899
- 35$900 to $999
- 159$1,000 to $1,249
- 9$1,250 to $1,499
- 32$1,500 to $1,999
- 12No cash rent


Percentage of workers working in this county: 66.6%
Number of people working at home: 53 (3.1% of all workers)
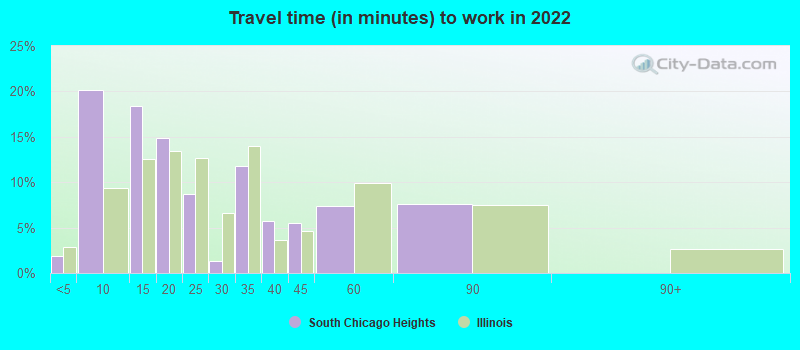
Travel time to work (commute)
- Less than 5 minutes: 6
- 5 to 9 minutes: 392
- 10 to 14 minutes: 207
- 15 to 19 minutes: 270
- 20 to 24 minutes: 163
- 25 to 29 minutes: 1
- 30 to 34 minutes: 232
- 35 to 39 minutes: 4
- 40 to 44 minutes: 10
- 45 to 59 minutes: 134
- 60 to 89 minutes: 172
- 90 or more minutes: 0
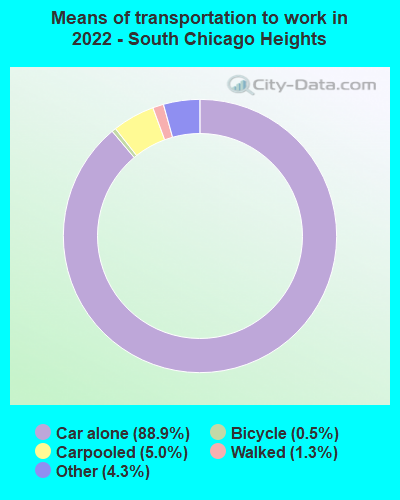
Means of transportation to work:
- Drove a car alone: 1,506 (84.1%)
- Carpooled: 91 (5.1%)
- Taxi: 73 (4.1%)
- Bicycle: 8 (0.4%)
- Walked: 22 (1.2%)
- Worked at home: 53 (3.0%)

- Unemployment by race in 2022
- Unemployment rate for White non-Hispanic residents
- 2.8%Males
- Unemployment rate for two or more race residents
- 79.4%Males
- Unemployment rate for Hispanic or Latino residents
- 7.8%Males
- 14.0%Females

- Year of entry for the foreign-born population in South Chicago Heights, Illinois
- 142010 or later
- 3452000 to 2009
- 961990 to 1999
- 621980 to 1989
- 411970 to 1979
- 143Before 1970

First ancestries reported:
- Italian: 220 (8.5%)
- American: 201 (7.8%)
- Irish: 159 (6.2%)
- German: 72 (2.8%)
- African: 33 (1.3%)
- Polish: 12 (0.5%)
- Scottish: 9 (0.3%)
- Czechoslovakian: 7 (0.3%)
- English: 7 (0.3%)
- Swedish: 4 (0.2%)
Most common places of birth for foreign-born residents (%):
| South Chicago Heights: | 90.3% (577) |
| Illinois: | 34.7% (626,958) |
| South Chicago Heights: | 7.2% (46) |
| Illinois: | 5.2% (93,003) |
Place of birth for U.S.-born residents:
- This state: 2,903
- Other state: 339
- Northeast: 5
- Midwest: 131
- South: 172
- West: 26
92.2% of South Chicago Heights residents lived in the same house 1 years ago.
Out of people who lived in different houses, 47.3% lived in this county.
Out of people who lived in different counties, 41.9% lived in Illinois.
| South Chicago Heights: | 92.2% |
| State average: | 88.3% |
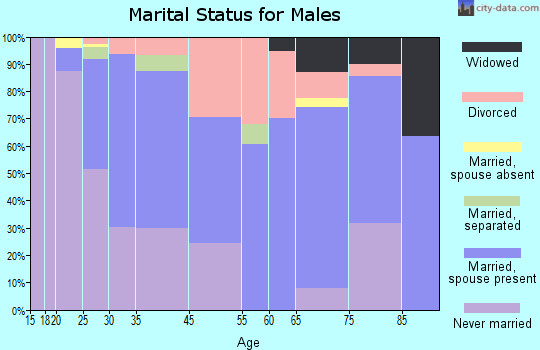
Education attainment for males 25 years and older:
- No schooling: 0
- Nursery to 4th grade: 0
- 5th and 6th grade: 0
- 7th and 8th grade: 82
- 9th grade: 117
- 10th grade: 2
- 11th grade: 66
- 12th grade, no diploma: 26
- High school graduate (or equivalency): 372
- Less than 1 year of college: 89
- Some college more than 1 year, no degree: 242
- Associate degree: 111
- Bachelor's degree: 44
- Master's degree: 11
- Professional school degree: 0
- Doctorate degree: 3

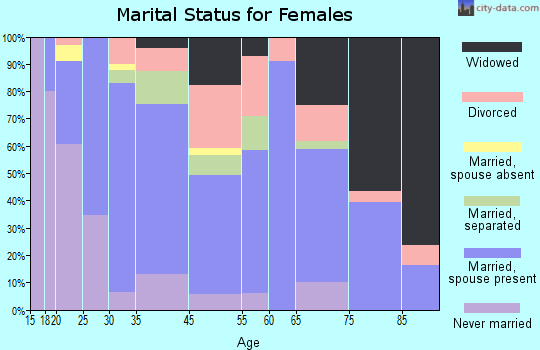
Education attainment for females 25 years and older:
- No schooling: 9
- Nursery to 4th grade: 0
- 5th and 6th grade: 0
- 7th and 8th grade: 45
- 9th grade: 69
- 10th grade: 6
- 11th grade: 65
- 12th grade, no diploma: 8
- High school graduate (or equivalency): 394
- Less than 1 year of college: 113
- Some college more than 1 year, no degree: 190
- Associate degree: 132
- Bachelor's degree: 160
- Master's degree: 38
- Professional school degree: 0
- Doctorate degree: 4

Housing units in structures:
- One, detached: 1,344
- One, attached: 16
- Two: 47
- 3 or 4: 17
- 5 to 9: 98
- 10 to 19: 17
- 20 to 49: 128
- Mobile homes: 36
Housing units lacking complete kitchen facilities in 2022: 1.6%
House/condo owner moved in on average 12 years ago
Renter moved in on average 2 years ago

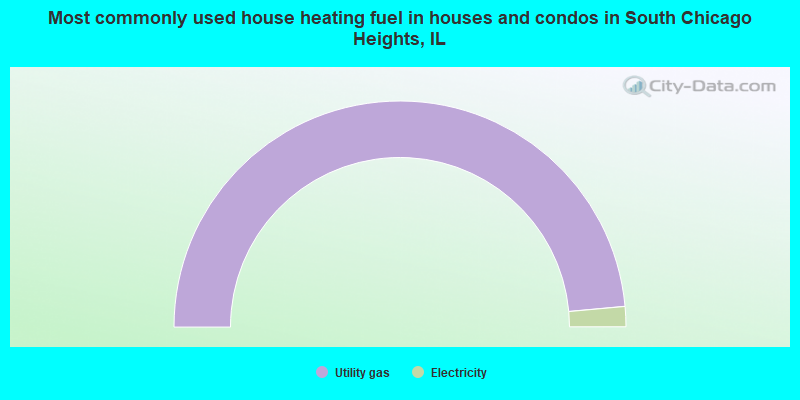
- 97.1%Utility gas
- 2.9%Electricity
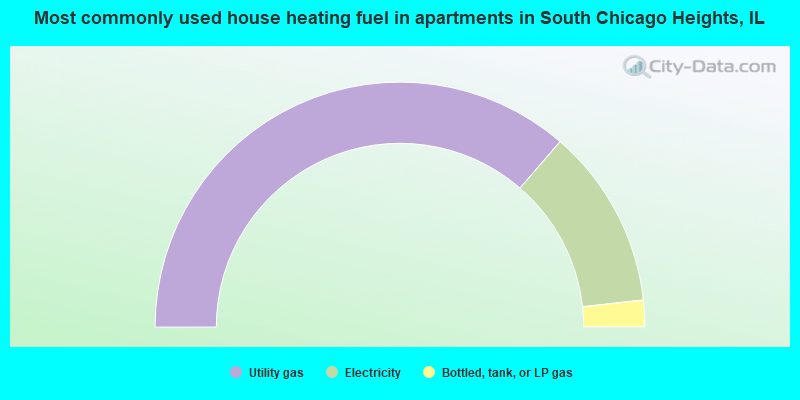
- 72.7%Utility gas
- 23.8%Electricity
- 3.5%Bottled, tank, or LP gas
Private vs. public school enrollment:
| Here: | 0.0% |
| Illinois: | 13.3% |
| Here: | 0.0% |
| Illinois: | 9.9% |
| Here: | 10.8% |
| Illinois: | 27.4% |


