St. Helena, CA (California) Houses and Residents
| St. Helena: | $1,779,159 |
| California: | $715,900 |
Mean price in 2022:
Detached houses: $1,602,170
Here: $1,602,170 State: $988,808 Townhouses or other attached units: $710,503
Here: $710,503 State: $838,546 Mobile homes: $329,223
Here: $329,223 State: $184,506
Total population: 5,987 (Urban population: 5,951 (all inside urban clusters), Rural population: 0)
Houses: 3,011 (2,506 occupied: 1,735 owner occupied, 821 renter occupied)
| % of renters here: | 32% |
| State: | 44% |
Housing density: 639 houses/condos per square mile
Median price asked for vacant for-sale houses and condos in 2022: $4,137,195.
Median contract rent in 2022: $1,652 (lower quartile is $1,220, upper quartile is over $2,000)
Median rent asked for vacant for-rent units in 2022: $3,058
Median gross rent in St. Helena, CA in 2022: $1,875
Housing units in St. Helena with a mortgage: 992 (167 second mortgage, 0 home equity loan, 145 both second mortgage and home equity loan)
Houses without a mortgage: 12
Median household income for houses/condos with a mortgage: $241,386
Median household income for apartments without a mortgage: $115,820
Median monthly housing costs: $2,394
Compare current foreclosures near St. Helena, CA:
| Photo | Address | Area | Beds / Baths | Price | Details |
|---|---|---|---|---|---|

|
#1
Mcconnell Ave
Santa Rosa, CA 95404
|
1,216 sq. feet
|
2 baths 4 beds |
show details | |

|
#2
Sugar Loaf Dr
Napa, CA 94558
|
- sq. feet
|
2 baths 3 beds |
$36,400
|
show details |

|
#3
Montecito Ave
Santa Rosa, CA 95404
|
1,537 sq. feet
|
2 baths 2 beds |
show details | |

|
#4
Foothill Blvd
Calistoga, CA 94515
|
3,158 sq. feet
|
3 baths 4 beds |
show details | |

|
#5
Harvest Ln
Santa Rosa, CA 95401
|
1,062 sq. feet
|
2 baths 2 beds |
show details | |

|
#6
Highway 12
Sonoma, CA 95476
|
1,170 sq. feet
|
2 baths 3 beds |
show details | |

|
#7
Carson St
Santa Rosa, CA 95403
|
1,408 sq. feet
|
2 baths 3 beds |
show details | |

|
#8
Melvin Ave
Sonoma, CA 95476
|
1,417 sq. feet
|
2 baths 3 beds |
show details | |

|
#9
Corby Ave
Santa Rosa, CA 95407
|
836 sq. feet
|
1 baths 2 beds |
show details | |

|
#10
Enterprise Rd
Glen Ellen, CA 95442
|
1,220 sq. feet
|
3 baths 3 beds |
show details |
| Photo | Address | Area | Beds / Baths | Price | Details |
|---|---|---|---|---|---|

|
#11
Ridgway Ave
Santa Rosa, CA 95401
|
1,603 sq. feet
|
2 baths 3 beds |
show details | |

|
#12
Harness Dr
Pope Valley, CA 94567
|
2,195 sq. feet
|
2 baths 4 beds |
show details | |

|
#13
Raccoon Ln
Santa Rosa, CA 95401
|
1,163 sq. feet
|
3 baths 2 beds |
show details | |

|
#14
Hollingsworth Cir
Rohnert Park, CA 94928
|
1,800 sq. feet
|
2 baths 3 beds |
show details | |

|
#15
Hermitage Way
Rohnert Park, CA 94928
|
2,195 sq. feet
|
2 baths 4 beds |
show details | |

|
#16
Leo Dr
Santa Rosa, CA 95407
|
1,873 sq. feet
|
2 baths 3 beds |
show details | |

|
#17
Hermitage Way
Rohnert Park, CA 94928
|
2,059 sq. feet
|
2 baths 3 beds |
show details | |

|
#18
Harbor Ln
Rohnert Park, CA 94928
|
1,385 sq. feet
|
3 baths 3 beds |
show details | |

|
#19
Grange Rd
Santa Rosa, CA 95404
|
3,732 sq. feet
|
3 baths 3 beds |
show details | |

|
#20
Crystal Dr
Santa Rosa, CA 95404
|
1,245 sq. feet
|
2 baths 3 beds |
show details |
| Photo | Address | Area | Beds / Baths | Price | Details |
|---|---|---|---|---|---|

|
#21
Parkside Dr
Santa Rosa, CA 95404
|
1,198 sq. feet
|
2 baths 3 beds |
show details | |

|
#22
W Macarthur St
Sonoma, CA 95476
|
1,968 sq. feet
|
3 baths 3 beds |
show details | |

|
#23
El Dorado Dr
Sonoma, CA 95476
|
1,216 sq. feet
|
2 baths 3 beds |
show details | |

|
#24
Comstock Ave
Sonoma, CA 95476
|
1,398 sq. feet
|
2 baths 3 beds |
show details | |

|
#25
Ridgway Ave
Santa Rosa, CA 95401
|
1,603 sq. feet
|
2 baths 3 beds |
show details | |

|
#26
Aston Cir
Santa Rosa, CA 95404
|
1,012 sq. feet
|
3 baths 3 beds |
show details | |

|
#27
Barcelona Dr
Sonoma, CA 95476
|
2,355 sq. feet
|
3 baths 4 beds |
show details | |

|
#28
Serpilio Dr
Sonoma, CA 95476
|
1,322 sq. feet
|
2 baths 3 beds |
show details | |

|
#29
Debbie Dr
Santa Rosa, CA 95407
|
1,077 sq. feet
|
2 baths 3 beds |
show details | |

|
#30
Wright St
Santa Rosa, CA 95404
|
1,208 sq. feet
|
1 baths 2 beds |
show details |
| Photo | Address | Area | Beds / Baths | Price | Details |
|---|---|---|---|---|---|

|
#31
Autumn Walk Dr
Santa Rosa, CA 95403
|
- sq. feet
|
2 baths 3 beds |
show details | |

|
#32
Ashwood Dr
Santa Rosa, CA 95407
|
1,287 sq. feet
|
1 baths 4 beds |
show details | |

|
#33
Tokay St
Santa Rosa, CA 95404
|
1,569 sq. feet
|
3 baths 4 beds |
show details | |

|
#34
Melvin Ave
Sonoma, CA 95476
|
1,417 sq. feet
|
2 baths 3 beds |
show details | |

|
#35
Santa Barbara Dr
Santa Rosa, CA 95404
|
877 sq. feet
|
1 baths 2 beds |
show details | |

|
#36
Hewett St
Santa Rosa, CA 95401
|
2,432 sq. feet
|
2 baths 4 beds |
show details | |

|
#37
Ernest Dr
Sonoma, CA 95476
|
1,466 sq. feet
|
2 baths 3 beds |
show details | |

|
#38
Ernest Dr
Sonoma, CA 95476
|
1,466 sq. feet
|
2 baths 3 beds |
show details | |

|
#39
Lariat St
Pope Valley, CA 94567
|
- sq. feet
|
2 baths 3 beds |
show details | |

|
#40
Claremont Dr
Santa Rosa, CA 95405
|
1,268 sq. feet
|
1 baths 3 beds |
show details |
| Photo | Address | Area | Beds / Baths | Price | Details |
|---|---|---|---|---|---|

|
#41
Colgan Ave
Santa Rosa, CA 95404
|
1,340 sq. feet
|
1 baths 2 beds |
show details | |

|
#42
Tarton Dr
Santa Rosa, CA 95405
|
2,145 sq. feet
|
3 baths 4 beds |
show details | |

|
#43
Big Oak Dr
Santa Rosa, CA 95401
|
1,775 sq. feet
|
3 baths 3 beds |
show details | |

|
#44
Match Point Ave
Santa Rosa, CA 95407
|
2,942 sq. feet
|
3 baths 3 beds |
show details | |

|
#45
Anson Ct
Rohnert Park, CA 94928
|
1,200 sq. feet
|
2 baths 3 beds |
show details | |

|
#46
Golden Gate Ave
Santa Rosa, CA 95407
|
500 sq. feet
|
1 baths 2 beds |
show details | |

|
#47
Bernice Ave
Rohnert Park, CA 94928
|
1,400 sq. feet
|
2 baths 4 beds |
show details | |

|
#48
Saint Helena Rd
Santa Rosa, CA 95404
|
1,809 sq. feet
|
2 baths 3 beds |
show details | |

|
#49
Saint Helena Rd
Santa Rosa, CA 95404
|
1,809 sq. feet
|
2 baths 3 beds |
show details | |

|
Check over 1 million property listings on Foreclosure.com!
|
browse all offers | |||


 | Library book returned 96 years overdue was checked out by descendant of St. Helena pioneers (4 replies) |
| Why do people still want to live in California? (1139 replies) |
| US News: SF-Oakland Metro Area ranks 7th Best Place to Live (403 replies) |
| How different is SoCal from NorCal? (166 replies) |
| Guerneville/Russian River - Living Year Round? (12 replies) |
| Bay Arean's Do you like living in Sacramento? (158 replies) |

Median year apartment built: 1971
Household type by relationship:
Households: 5,304- Male householders: 1,137 (164 living alone), Female householders: 1,272 (527 living alone)
1,130 spouses (1,122 opposite-sex spouses), 119 unmarried partners, (101 opposite-sex unmarried partners), 1,131 children (1,064 natural, 52 adopted, 13 stepchildren), 34 grandchildren, 111 brothers or sisters, 49 parents, 0 foster children, 57 other relatives, 199 non-relatives
- In group quarters: 60
Size of family households: 922 2-persons, 344 3-persons, 162 4-persons, 59 5-persons, 23 6-persons, 40 7-or-more-persons.
Size of nonfamily households: 812 1-person, 162 2-persons, 3 5-persons.
620 married couples with children.
162 single-parent households (24 men, 138 women).
73.3% of residents of St. Helena speak English at home.
20.2% of residents speak Spanish at home (56% speak English very well, 16% speak English well, 12% speak English not well, 17% don't speak English at all).
6.4% of residents speak other Indo-European language at home (67% speak English very well, 24% speak English well, 6% speak English not well, 3% don't speak English at all).
0.9% of residents speak Asian or Pacific Island language at home (100% speak English very well).
0.1% of residents speak other language at home (100% speak English very well).
Foreign born population: 1,474 (27.8%)
(43.3% of them are naturalized citizens)
| Here: | 6.0 |
| State: | 6.0 |
| Here: | 3.9 |
| State: | 3.9 |

- Bedrooms in owner-occupied houses and condos in St. Helena, California
- 40no bedroom
- 561 bedroom
- 4492 bedrooms
- 8433 bedrooms
- 2394 bedrooms
- 1085+ bedrooms

- Bedrooms in renter-occupied apartments in St. Helena, California
- 135no bedroom
- 2311 bedroom
- 2542 bedrooms
- 1523 bedrooms
- 434 bedrooms
- 65+ bedrooms

- Cars and other vehicles available in St. Helena in owner-occupied houses/condos
- 55no vehicle
- 4181 vehicle
- 7542 vehicles
- 4393 vehicles
- 604 vehicles
- 105+ vehicles

- Cars and other vehicles available in St. Helena in renter-occupied apartments
- 172no vehicle
- 2791 vehicle
- 2822 vehicles
- 883 vehicles
- 04 vehicles
- 05+ vehicles

- Rooms in owner-occupied houses in St. Helena, California
- 341 room
- 62 rooms
- 513 rooms
- 2304 rooms
- 3365 rooms
- 5356 rooms
- 1827 rooms
- 1888 rooms
- 1739+ rooms

- Rooms in renter-occupied apartments in St. Helena, California
- 1351 room
- 1202 rooms
- 883 rooms
- 1734 rooms
- 605 rooms
- 1426 rooms
- 707 rooms
- 58 rooms
- 279+ rooms


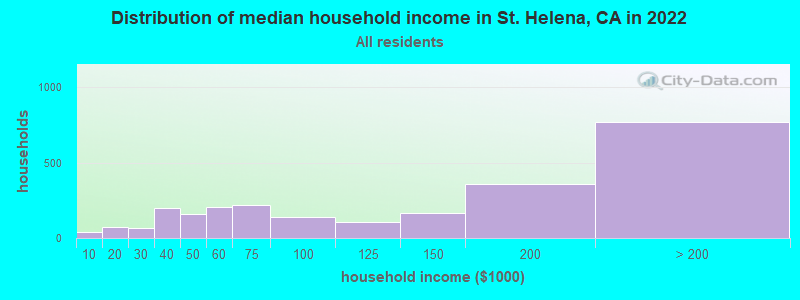
St. Helena, CA household income distribution

- 42Less than $10,000
- 71$10,000 to $19,999
- 66$20,000 to $29,999
- 202$30,000 to $39,999
- 162$40,000 to $49,999
- 208$50,000 to $59,999
- 217$60,000 to $74,999
- 139$75,000 to $99,999
- 108$100,000 to $124,999
- 169$125,000 to $149,999
- 356$150,000 to $199,999
- 769$200,000 or more
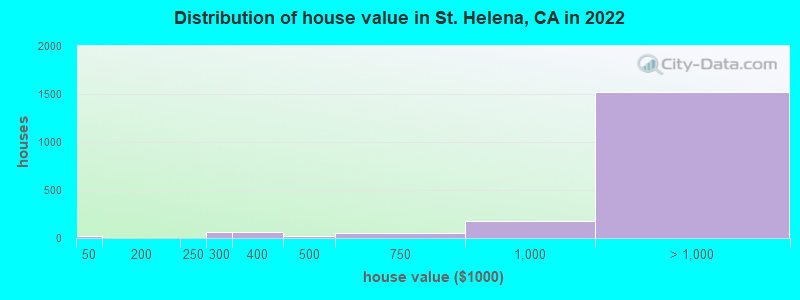
Home value of owner - occupied houses in 2022 in St. Helena, CA
-
- 11Less than $10,000
- 4$35,000 to $39,999
- 4$200,000 to $249,999
- 63$250,000 to $299,999
- 66$300,000 to $399,999
- 15$400,000 to $499,999
- 52$500,000 to $749,999
- 171$750,000 to $999,999
- 400$1,000,000 to $1,499,999
- 280$1,500,000 to $1,999,999
- 841$2,000,000 or more
Rent paid by renters in 2022 in St. Helena, CA
-
- 12$200 to $249
- 14$300 to $349
- 13$400 to $449
- 10$550 to $599
- 5$800 to $899
- 46$900 to $999
- 100$1,000 to $1,249
- 100$1,250 to $1,499
- 183$1,500 to $1,999
- 133$2,000 to $2,499
- 134$2,500 to $2,999
- 28$3,000 to $3,499
- 16$3,500 or more
- 37No cash rent


Percentage of workers working in this county: 90.9%
Number of people working at home: 335 (13.9% of all workers)
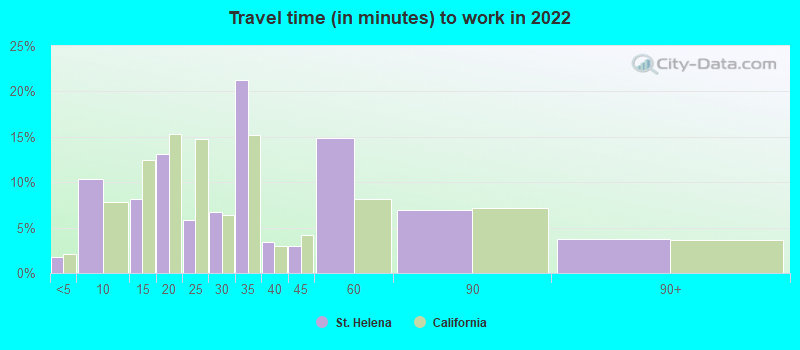
Travel time to work (commute)
- Less than 5 minutes: 95
- 5 to 9 minutes: 624
- 10 to 14 minutes: 321
- 15 to 19 minutes: 509
- 20 to 24 minutes: 130
- 25 to 29 minutes: 50
- 30 to 34 minutes: 125
- 35 to 39 minutes: 16
- 40 to 44 minutes: 63
- 45 to 59 minutes: 100
- 60 to 89 minutes: 56
- 90 or more minutes: 25
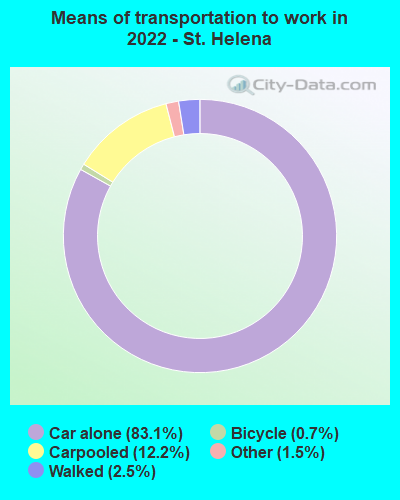
Means of transportation to work:
- Drove a car alone: 4,213 (75.7%)
- Carpooled: 739 (13.3%)
- Taxi: 99 (1.8%)
- Bicycle: 47 (0.8%)
- Walked: 126 (2.3%)
- Worked at home: 335 (6.0%)

- Unemployment by race in 2022
- Unemployment rate for White non-Hispanic residents
- 4.6%Females
- Unemployment rate for other race residents
- 5.1%Males
- Unemployment rate for two or more race residents
- 32.6%Males
- 5.9%Females
- Unemployment rate for Hispanic or Latino residents
- 7.1%Males
- 4.0%Females

- Year of entry for the foreign-born population in St. Helena, California
- 3642010 or later
- 4992000 to 2009
- 2581990 to 1999
- 2871980 to 1989
- 1551970 to 1979
- 248Before 1970

First ancestries reported:
- Irish: 235 (9.4%)
- Italian: 228 (9.1%)
- European: 203 (8.1%)
- English: 196 (7.8%)
- German: 168 (6.7%)
- French Canadian: 101 (4.0%)
- American: 79 (3.2%)
- Iranian: 75 (3.0%)
- Dutch: 48 (1.9%)
- Eastern European: 44 (1.8%)
- Polish: 39 (1.6%)
- French: 37 (1.5%)
- Norwegian: 25 (1.0%)
- Scotch-Irish: 16 (0.6%)
- Swiss: 16 (0.6%)
- Australian: 15 (0.6%)
- Russian: 15 (0.6%)
- Hungarian: 14 (0.6%)
- Macedonian: 12 (0.5%)
- Scottish: 11 (0.4%)
- Danish: 10 (0.4%)
- Belgian: 9 (0.4%)
- Croatian: 9 (0.4%)
- Yugoslavian: 9 (0.4%)
- Armenian: 8 (0.3%)
- British: 7 (0.3%)
- Greek: 7 (0.3%)
- Portuguese: 7 (0.3%)
- Slovene: 5 (0.2%)
- Swedish: 3 (0.1%)
- Northern European: 2 (0.08%)
Most common places of birth for foreign-born residents (%):
| St. Helena: | 30.8% (448) |
| California: | 37.2% (3,881,193) |
| St. Helena: | 16.2% (236) |
| California: | 1.2% (127,477) |
| St. Helena: | 10.9% (158) |
| California: | 4.2% (440,287) |
| St. Helena: | 8.5% (124) |
| California: | 2.8% (290,436) |
| St. Helena: | 7.2% (105) |
| California: | 2.0% (206,004) |
| St. Helena: | 3.2% (47) |
| California: | 0.7% (73,304) |
| St. Helena: | 2.5% (36) |
| California: | 0.3% (33,960) |
| St. Helena: | 2.3% (34) |
| California: | 0.6% (57,953) |
| St. Helena: | 2.3% (34) |
| California: | 0.2% (23,338) |
| St. Helena: | 2.0% (29) |
| California: | 0.2% (20,997) |
| St. Helena: | 1.9% (28) |
| California: | 0.1% (10,538) |
Place of birth for U.S.-born residents:
- This state: 2,291
- Other state: 1,402
- Northeast: 438
- Midwest: 455
- South: 317
- West: 211
93.4% of St. Helena residents lived in the same house 1 years ago.
Out of people who lived in different houses, 14.4% lived in this county.
Out of people who lived in different counties, 77.5% lived in California.
| St. Helena: | 93.4% |
| State average: | 88.9% |
Education attainment for males 25 years and older:
- No schooling: 0
- Nursery to 4th grade: 26
- 5th and 6th grade: 35
- 7th and 8th grade: 0
- 9th grade: 8
- 10th grade: 0
- 11th grade: 0
- 12th grade, no diploma: 108
- High school graduate (or equivalency): 293
- Less than 1 year of college: 11
- Some college more than 1 year, no degree: 209
- Associate degree: 111
- Bachelor's degree: 619
- Master's degree: 424
- Professional school degree: 124
- Doctorate degree: 63

Education attainment for females 25 years and older:
- No schooling: 77
- Nursery to 4th grade: 8
- 5th and 6th grade: 48
- 7th and 8th grade: 0
- 9th grade: 0
- 10th grade: 0
- 11th grade: 0
- 12th grade, no diploma: 156
- High school graduate (or equivalency): 145
- Less than 1 year of college: 105
- Some college more than 1 year, no degree: 226
- Associate degree: 161
- Bachelor's degree: 864
- Master's degree: 358
- Professional school degree: 46
- Doctorate degree: 64


Housing units in structures:
- One, detached: 2,064
- One, attached: 115
- Two: 77
- 3 or 4: 153
- 5 to 9: 79
- 10 to 19: 81
- 20 to 49: 72
- 50 or more: 149
- Mobile homes: 218
Median worth of mobile homes: $407,987
Housing units lacking complete kitchen facilities in 2022: 5.0%
House/condo owner moved in on average 15 years ago
Renter moved in on average 4 years ago

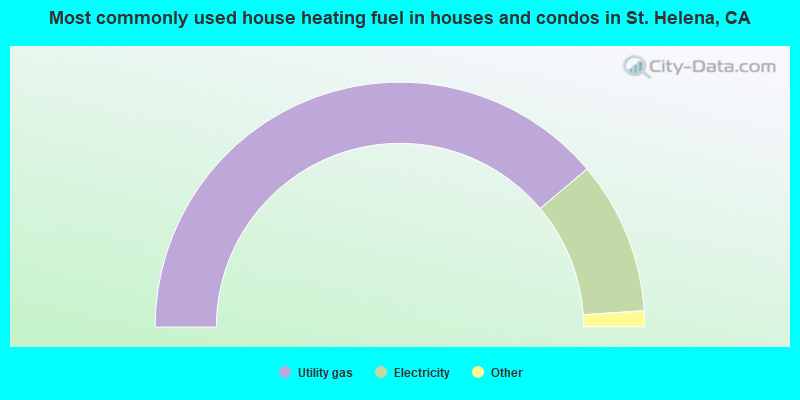
- 77.7%Utility gas
- 20.2%Electricity
- 1.0%Bottled, tank, or LP gas
- 0.6%Solar energy
- 0.5%Wood
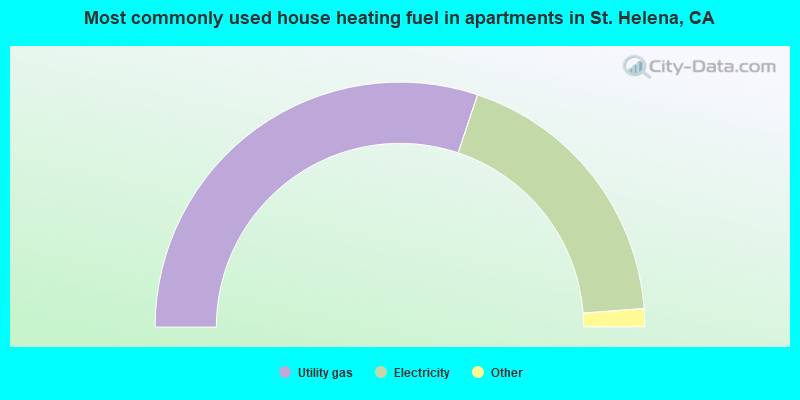
- 60.4%Utility gas
- 37.4%Electricity
- 1.6%Bottled, tank, or LP gas
- 0.6%Wood
Private vs. public school enrollment:
| Here: | 22.8% |
| California: | 10.5% |
| Here: | 31.1% |
| California: | 8.5% |
| Here: | 45.9% |
| California: | 15.9% |


