St. Pete Beach, FL (Florida) Houses and Residents
| St. Pete Beach: | $777,836 |
| Florida: | $354,100 |
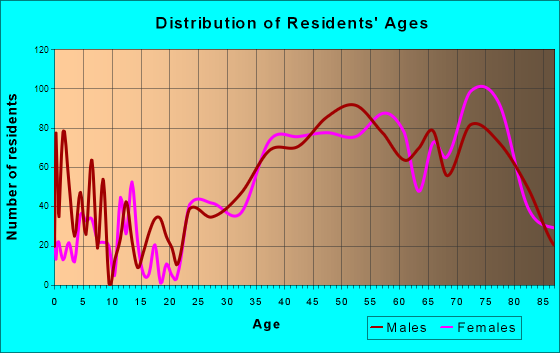
Total population: 9,496 (All urban)
Houses: 8,110 (4,583 occupied: 3,434 owner occupied, 1,188 renter occupied)
| % of renters here: | 26% |
| State: | 33% |
Housing density: 3,608 houses/condos per square mile
Median price asked for vacant for-sale houses and condos in 2022: $773,903.
Median contract rent in 2022: $1,665 (lower quartile is $1,027, upper quartile is over $2,000)
Median rent asked for vacant for-rent units in 2022: $2,154
Median gross rent in St. Pete Beach, FL in 2022: $1,717
Housing units in St. Pete Beach with a mortgage: 1,322 (216 second mortgage, 0 home equity loan, 198 both second mortgage and home equity loan)
Houses without a mortgage: 294
Median household income for houses/condos with a mortgage: $183,215
Median household income for apartments without a mortgage: $101,883
Median monthly housing costs: $1,588
Compare current foreclosures near St. Pete Beach, FL:
| Photo | Address | Area | Beds / Baths | Price | Details |
|---|---|---|---|---|---|

|
#1
83rd Ave N Apt 120
Saint Petersburg, FL 33702
|
1,000 sq. feet
|
2 baths 2 beds |
$139,900
|
show details |

|
#2
34th Ave N
Saint Petersburg, FL 33710
|
1,517 sq. feet
|
2 baths 3 beds |
show details | |

|
#3
Spring St
Largo, FL 33774
|
6,672 sq. feet
|
5 baths 6 beds |
show details | |

|
#4
Seminole Trl
Seminole, FL 33776
|
2,174 sq. feet
|
4 baths 3 beds |
show details | |

|
#5
Starkey Rd Apt 2405
Largo, FL 33771
|
1,562 sq. feet
|
3 baths 3 beds |
show details | |

|
#6
94th St
Seminole, FL 33777
|
1,380 sq. feet
|
2 baths 3 beds |
show details | |

|
#7
Catalonia Way S
Saint Petersburg, FL 33712
|
1,556 sq. feet
|
2 baths 3 beds |
show details | |

|
#8
18th Ave S
Saint Petersburg, FL 33711
|
1,580 sq. feet
|
2 baths 4 beds |
show details | |

|
#9
62nd Ter S
Saint Petersburg, FL 33705
|
1,662 sq. feet
|
2 baths 3 beds |
show details | |

|
#10
Sand Key Estates Ct
Clearwater Beach, FL 33767
|
2,114 sq. feet
|
3 baths 3 beds |
show details |
| Photo | Address | Area | Beds / Baths | Price | Details |
|---|---|---|---|---|---|

|
#11
57th Ave N
Saint Petersburg, FL 33714
|
984 sq. feet
|
2 baths 3 beds |
show details | |

|
#12
Ellenton-Gillette Rd 149,
Palmetto, FL 34221
|
1,248 sq. feet
|
1 baths 2 beds |
show details | |

|
#13
70th St E
Palmetto, FL 34221
|
2,987 sq. feet
|
2 baths 3 beds |
show details | |

|
#14
5th Ave W
Palmetto, FL 34221
|
1,280 sq. feet
|
1 baths 2 beds |
show details | |

|
#15
127th Ave
Largo, FL 33778
|
1,035 sq. feet
|
2 baths - beds |
show details | |

|
#16
16th St W
Palmetto, FL 34221
|
1,958 sq. feet
|
2 baths 3 beds |
show details | |

|
#17
10th St W
Palmetto, FL 34221
|
1,935 sq. feet
|
1 baths 2 beds |
show details | |

|
#18
18th Ave S
Saint Petersburg, FL 33711
|
1,080 sq. feet
|
1 baths - beds |
show details | |

|
#19
34th St S, # 115
Saint Petersburg, FL 33711
|
336 sq. feet
|
2 baths - beds |
show details | |

|
#20
42nd St S
Saint Petersburg, FL 33711
|
1,482 sq. feet
|
2 baths - beds |
show details |
| Photo | Address | Area | Beds / Baths | Price | Details |
|---|---|---|---|---|---|

|
#21
17th St W
Palmetto, FL 34221
|
4,272 sq. feet
|
3 baths 5 beds |
show details | |

|
#22
79th St NW
Bradenton, FL 34209
|
3,676 sq. feet
|
3 baths 5 beds |
show details | |

|
#23
49th St W
Palmetto, FL 34221
|
1,561 sq. feet
|
2 baths 3 beds |
show details | |

|
#24
W Idaho St
Tampa, FL 33616
|
1,142 sq. feet
|
2 baths 3 beds |
show details | |

|
#25
31st St E
Palmetto, FL 34221
|
1,056 sq. feet
|
1 baths 3 beds |
show details | |

|
#26
75th St NW
Bradenton, FL 34209
|
1,361 sq. feet
|
2 baths 3 beds |
show details | |

|
#27
Boca Ciega Dr
Saint Petersburg, FL 33708
|
1,680 sq. feet
|
2 baths - beds |
show details | |

|
#28
63rd St E
Palmetto, FL 34221
|
1,767 sq. feet
|
2 baths 3 beds |
show details | |

|
#29
Sandpiper Cir
Bradenton, FL 34209
|
829 sq. feet
|
2 baths 2 beds |
show details | |

|
#30
70th Gln E
Palmetto, FL 34221
|
1,686 sq. feet
|
2 baths 3 beds |
show details |
| Photo | Address | Area | Beds / Baths | Price | Details |
|---|---|---|---|---|---|

|
#31
5th Ave W
Palmetto, FL 34221
|
1,866 sq. feet
|
2 baths 3 beds |
show details | |

|
#32
Sanderling Cir
Bradenton, FL 34209
|
1,272 sq. feet
|
2 baths 2 beds |
show details | |

|
#33
10th Ave NW
Bradenton, FL 34209
|
2,223 sq. feet
|
2 baths 3 beds |
show details | |

|
#34
22nd Ave W
Palmetto, FL 34221
|
1,832 sq. feet
|
2 baths 3 beds |
show details | |

|
#35
106th Ave N
Pinellas Park, FL 33782
|
1,728 sq. feet
|
2 baths - beds |
show details | |

|
#36
93rd St
Seminole, FL 33777
|
894 sq. feet
|
2 baths - beds |
show details | |

|
#37
1st St E
Saint Petersburg, FL 33708
|
1,690 sq. feet
|
1 baths - beds |
show details | |

|
#38
34th Ave NE
Saint Petersburg, FL 33704
|
1,286 sq. feet
|
2 baths - beds |
show details | |

|
#39
84th Ave N
Pinellas Park, FL 33781
|
1,574 sq. feet
|
1 baths - beds |
show details | |

|
#40
27th St N
Saint Petersburg, FL 33702
|
1,482 sq. feet
|
2 baths - beds |
show details |
| Photo | Address | Area | Beds / Baths | Price | Details |
|---|---|---|---|---|---|

|
#41
52nd Ave N
Saint Petersburg, FL 33703
|
1,048 sq. feet
|
1 baths - beds |
show details | |

|
#42
59th St N
Pinellas Park, FL 33781
|
1,520 sq. feet
|
2 baths - beds |
show details | |

|
#43
83rd Ave
Seminole, FL 33776
|
1,889 sq. feet
|
2 baths - beds |
show details | |

|
#44
68th Ave N
Saint Petersburg, FL 33702
|
1,130 sq. feet
|
2 baths - beds |
show details | |

|
#45
21st St N
Saint Petersburg, FL 33702
|
1,834 sq. feet
|
2 baths - beds |
show details | |

|
#46
55th Way N
Pinellas Park, FL 33781
|
1,618 sq. feet
|
2 baths - beds |
show details | |

|
#47
81st Way
Seminole, FL 33777
|
1,316 sq. feet
|
2 baths - beds |
show details | |

|
#48
57th Ave N
Saint Petersburg, FL 33714
|
984 sq. feet
|
2 baths - beds |
show details | |

|
#49
4th Ave N
Pinellas Park, FL 33781
|
1,315 sq. feet
|
2 baths - beds |
show details | |

|
Check over 1 million property listings on Foreclosure.com!
|
browse all offers | |||


 | Narrowed down Apartments-Question is, are they in a good/safe area? (26 replies) |
| St Pete weird vibe (123 replies) |
| Any advice on 2nd/vacation home? Any vrbo owners? St. Pete Beach (3 replies) |
| The Official Tampa Bay Developments/Urban Enthusiast Thread (162 replies) |
| Tampa Bay culture (24 replies) |
| Affordable water front living in St Petersburg/Tampa Bay Area (52 replies) |
Median year apartment built: 1964
Household type by relationship:
Households: 8,921- Male householders: 2,589 (726 living alone), Female householders: 1,970 (697 living alone)
2,461 spouses (2,340 opposite-sex spouses), 272 unmarried partners, (221 opposite-sex unmarried partners), 1,152 children (1,077 natural, 52 adopted, 23 stepchildren), 150 grandchildren, 26 brothers or sisters, 164 parents, 0 foster children, 13 other relatives, 107 non-relatives
- In group quarters: 14
Size of family households: 2,196 2-persons, 277 3-persons, 195 4-persons, 58 5-persons.
Size of nonfamily households: 1,542 1-person, 374 2-persons.
404 married couples with children.
18 single-parent households (0 men, 18 women).
89.8% of residents of St. Pete Beach speak English at home.
3.1% of residents speak Spanish at home (75% speak English very well, 25% speak English not well).
5.5% of residents speak other Indo-European language at home (80% speak English very well, 20% speak English well).
0.7% of residents speak Asian or Pacific Island language at home (74% speak English very well, 11% speak English well, 15% speak English not well).
1.0% of residents speak other language at home (83% speak English very well, 17% speak English not well).
Foreign born population: 1,397 (15.7%)
(60.1% of them are naturalized citizens)
| Here: | 5.6 |
| State: | 5.9 |
| Here: | 3.9 |
| State: | 4.2 |

- Bedrooms in owner-occupied houses and condos in St. Pete Beach, Florida
- 19no bedroom
- 2741 bedroom
- 1,2462 bedrooms
- 1,4273 bedrooms
- 3634 bedrooms
- 1065+ bedrooms

- Bedrooms in renter-occupied apartments in St. Pete Beach, Florida
- 73no bedroom
- 4171 bedroom
- 5472 bedrooms
- 1503 bedrooms
- 04 bedrooms
- 05+ bedrooms

- Cars and other vehicles available in St. Pete Beach in owner-occupied houses/condos
- 115no vehicle
- 1,4861 vehicle
- 1,4122 vehicles
- 3213 vehicles
- 804 vehicles
- 215+ vehicles

- Cars and other vehicles available in St. Pete Beach in renter-occupied apartments
- 130no vehicle
- 7191 vehicle
- 2972 vehicles
- 263 vehicles
- 164 vehicles
- 05+ vehicles

- Rooms in owner-occupied houses in St. Pete Beach, Florida
- 191 room
- 172 rooms
- 2883 rooms
- 5184 rooms
- 8265 rooms
- 5456 rooms
- 4557 rooms
- 3338 rooms
- 4339+ rooms

- Rooms in renter-occupied apartments in St. Pete Beach, Florida
- 731 room
- 722 rooms
- 3373 rooms
- 2164 rooms
- 3005 rooms
- 1016 rooms
- 697 rooms
- 208 rooms
- 09+ rooms


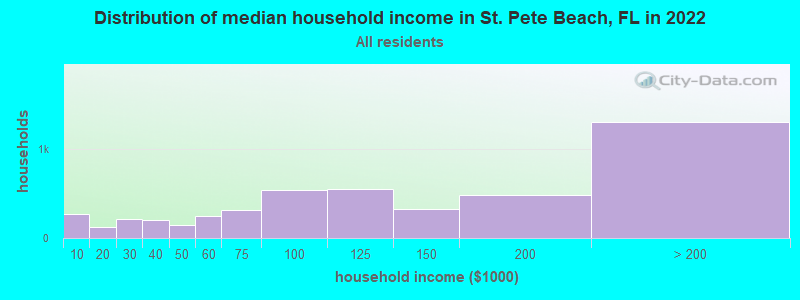
St. Pete Beach, FL household income distribution

- 268Less than $10,000
- 129$10,000 to $19,999
- 214$20,000 to $29,999
- 204$30,000 to $39,999
- 148$40,000 to $49,999
- 248$50,000 to $59,999
- 319$60,000 to $74,999
- 538$75,000 to $99,999
- 550$100,000 to $124,999
- 325$125,000 to $149,999
- 487$150,000 to $199,999
- 1,305$200,000 or more
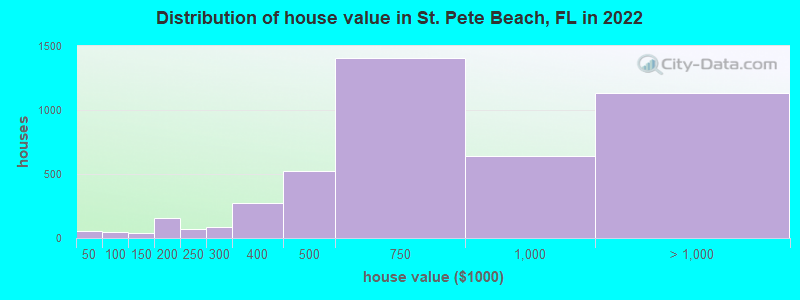
Home value of owner - occupied houses in 2022 in St. Pete Beach, FL
-
- 9Less than $10,000
- 22$25,000 to $29,999
- 20$40,000 to $49,999
- 17$50,000 to $59,999
- 4$90,000 to $99,999
- 12$100,000 to $124,999
- 24$125,000 to $149,999
- 11$150,000 to $174,999
- 147$175,000 to $199,999
- 68$200,000 to $249,999
- 84$250,000 to $299,999
- 270$300,000 to $399,999
- 522$400,000 to $499,999
- 1,408$500,000 to $749,999
- 639$750,000 to $999,999
- 524$1,000,000 to $1,499,999
- 325$1,500,000 to $1,999,999
- 283$2,000,000 or more
Rent paid by renters in 2022 in St. Pete Beach, FL
-
- 19$500 to $549
- 32$700 to $749
- 85$800 to $899
- 92$900 to $999
- 129$1,000 to $1,249
- 101$1,250 to $1,499
- 351$1,500 to $1,999
- 263$2,000 to $2,499
- 13$2,500 to $2,999
- 36$3,000 to $3,499
- 54$3,500 or more
- 106No cash rent


Percentage of workers working in this county: 81.9%
Number of people working at home: 1,148 (29.6% of all workers)
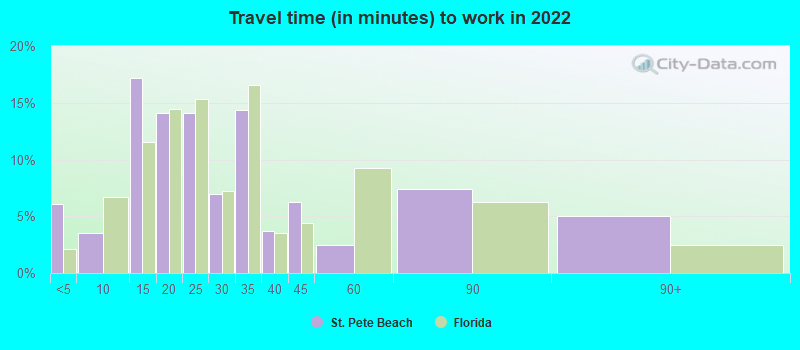
Travel time to work (commute)
- Less than 5 minutes: 278
- 5 to 9 minutes: 275
- 10 to 14 minutes: 264
- 15 to 19 minutes: 279
- 20 to 24 minutes: 380
- 25 to 29 minutes: 63
- 30 to 34 minutes: 567
- 35 to 39 minutes: 119
- 40 to 44 minutes: 119
- 45 to 59 minutes: 170
- 60 to 89 minutes: 257
- 90 or more minutes: 87
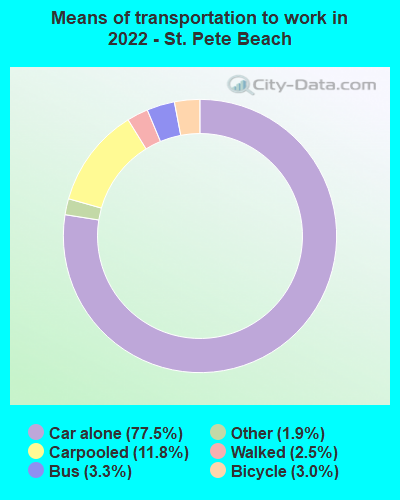
Means of transportation to work:
- Drove a car alone: 3,596 (60.9%)
- Carpooled: 634 (10.7%)
- Bus: 165 (2.8%)
- Taxi: 108 (1.8%)
- Bicycle: 169 (2.9%)
- Walked: 127 (2.1%)
- Worked at home: 1,148 (19.4%)

- Unemployment by race in 2022
- Unemployment rate for White non-Hispanic residents
- 4.4%Males
- 5.0%Females
- Unemployment rate for other race residents
- 33.3%Females
- Unemployment rate for two or more race residents
- 10.7%Females
- Unemployment rate for Hispanic or Latino residents
- 29.0%Females

- Year of entry for the foreign-born population in St. Pete Beach, Florida
- 5732010 or later
- 1792000 to 2009
- 2491990 to 1999
- 1581980 to 1989
- 1381970 to 1979
- 684Before 1970

First ancestries reported:
- American: 748 (15.9%)
- English: 595 (12.7%)
- German: 419 (8.9%)
- Italian: 375 (8.0%)
- Irish: 362 (7.7%)
- Lithuanian: 235 (5.0%)
- European: 202 (4.3%)
- Eastern European: 183 (3.9%)
- Scottish: 140 (3.0%)
- British: 99 (2.1%)
- Scotch-Irish: 98 (2.1%)
- Canadian: 86 (1.8%)
- Czech: 73 (1.6%)
- Greek: 65 (1.4%)
- Russian: 64 (1.4%)
- Polish: 43 (0.9%)
- Northern European: 32 (0.7%)
- Lebanese: 31 (0.7%)
- Ethiopian: 24 (0.5%)
- Dutch: 23 (0.5%)
- Romanian: 23 (0.5%)
- French Canadian: 21 (0.4%)
- Israeli: 21 (0.4%)
- Slovene: 21 (0.4%)
- Hungarian: 20 (0.4%)
- Norwegian: 19 (0.4%)
- Zimbabwean: 17 (0.4%)
- Portuguese: 16 (0.3%)
- Swiss: 14 (0.3%)
- Finnish: 11 (0.2%)
- Scandinavian: 11 (0.2%)
- Swedish: 9 (0.2%)
- Ukrainian: 9 (0.2%)
- Yugoslavian: 7 (0.1%)
- Pennsylvania German: 6 (0.1%)
- French: 4 (0.09%)
Most common places of birth for foreign-born residents (%):
| St. Pete Beach: | 17.6% (249) |
| Florida: | 22.0% (1,006,576) |
| St. Pete Beach: | 17.4% (245) |
| Florida: | 2.4% (109,132) |
| St. Pete Beach: | 9.0% (127) |
| Florida: | 0.7% (34,227) |
| St. Pete Beach: | 8.9% (126) |
| Florida: | 0.8% (37,723) |
| St. Pete Beach: | 6.8% (96) |
| Florida: | 0.2% (11,243) |
| St. Pete Beach: | 5.3% (75) |
| Florida: | 0.1% (3,330) |
| St. Pete Beach: | 3.8% (54) |
| Florida: | 0.2% (8,038) |
| St. Pete Beach: | 2.5% (35) |
| Florida: | 0.1% (3,129) |
| St. Pete Beach: | 2.1% (30) |
| Florida: | 1.8% (84,403) |
| St. Pete Beach: | 2.1% (29) |
| Florida: | 0.4% (19,445) |
| St. Pete Beach: | 1.7% (24) |
| Florida: | 0.3% (14,943) |
| St. Pete Beach: | 1.7% (24) |
| Florida: | 0.2% (8,352) |
| St. Pete Beach: | 1.6% (23) |
| Florida: | 1.2% (54,272) |
| St. Pete Beach: | 1.6% (23) |
| Florida: | 0.6% (25,219) |
| St. Pete Beach: | 1.6% (22) |
| Florida: | 0.4% (20,008) |
Place of birth for U.S.-born residents:
- This state: 1,494
- Other state: 6,001
- Northeast: 2,425
- Midwest: 2,054
- South: 1,222
- West: 296
85.4% of St. Pete Beach residents lived in the same house 1 years ago.
Out of people who lived in different houses, 23.7% lived in this county.
Out of people who lived in different counties, 23.1% lived in Florida.
| St. Pete Beach: | 85.4% |
| State average: | 86.3% |
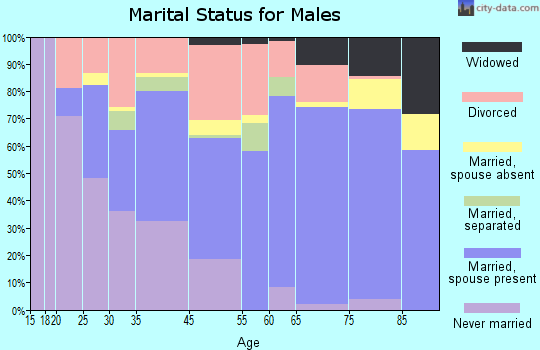
Education attainment for males 25 years and older:
- No schooling: 31
- Nursery to 4th grade: 0
- 5th and 6th grade: 0
- 7th and 8th grade: 27
- 9th grade: 0
- 10th grade: 1
- 11th grade: 11
- 12th grade, no diploma: 61
- High school graduate (or equivalency): 684
- Less than 1 year of college: 101
- Some college more than 1 year, no degree: 440
- Associate degree: 410
- Bachelor's degree: 1,478
- Master's degree: 484
- Professional school degree: 230
- Doctorate degree: 303

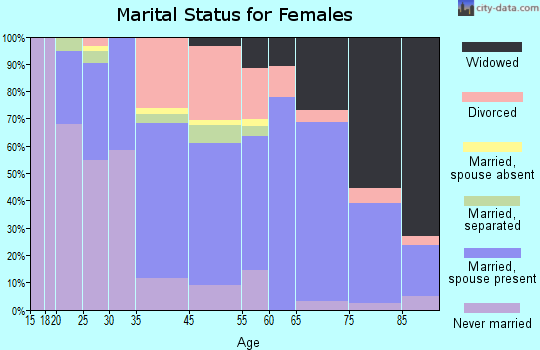
Education attainment for females 25 years and older:
- No schooling: 152
- Nursery to 4th grade: 0
- 5th and 6th grade: 0
- 7th and 8th grade: 0
- 9th grade: 6
- 10th grade: 10
- 11th grade: 0
- 12th grade, no diploma: 26
- High school graduate (or equivalency): 698
- Less than 1 year of college: 200
- Some college more than 1 year, no degree: 512
- Associate degree: 235
- Bachelor's degree: 1,078
- Master's degree: 707
- Professional school degree: 351
- Doctorate degree: 18

Housing units in structures:
- One, detached: 3,124
- One, attached: 177
- Two: 235
- 3 or 4: 460
- 5 to 9: 374
- 10 to 19: 673
- 20 to 49: 1,049
- 50 or more: 1,986
- Mobile homes: 28
Housing units lacking complete kitchen facilities in 2022: 2.5%
House/condo owner moved in on average 9 years ago
Renter moved in on average 2 years ago

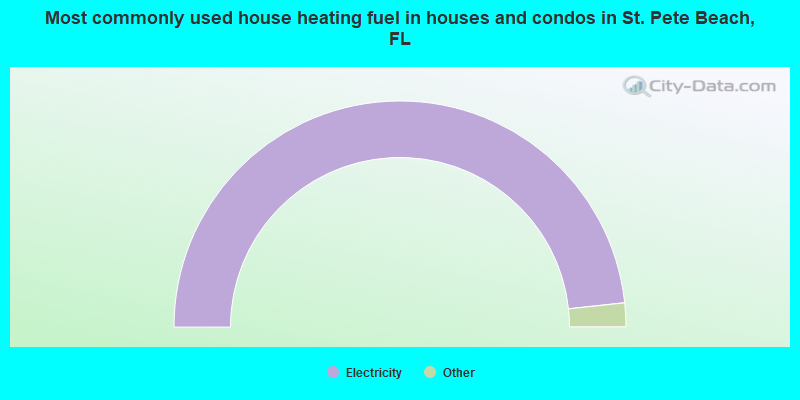
- 96.6%Electricity
- 1.5%Utility gas
- 1.0%Solar energy
- 0.6%No fuel used
- 0.3%Bottled, tank, or LP gas
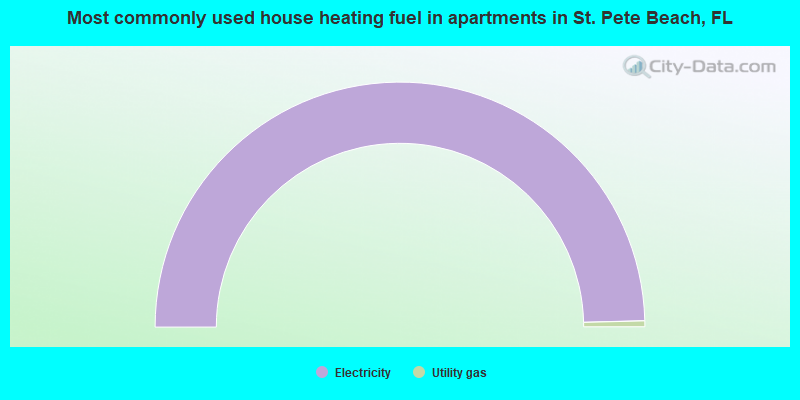
- 99.2%Electricity
- 0.8%Utility gas
Private vs. public school enrollment:
| Here: | 57.9% |
| Florida: | 15.8% |
| Here: | 71.7% |
| Florida: | 12.9% |
| Here: | 28.9% |
| Florida: | 23.6% |


