Star City, AR (Arkansas) Houses and Residents
| Star City: | $130,311 |
| Arkansas: | $179,800 |
Total population: 2,220 (Urban population: 0, Rural population: 2,476 (all nonfarm))
Houses: 1,060 (775 occupied: 610 owner occupied, 180 renter occupied)
| % of renters here: | 23% |
| State: | 34% |
Housing density: 252 houses/condos per square mile
Median price asked for vacant for-sale houses and condos in 2022: $125,337.
Median contract rent in 2022: $526
Median rent asked for vacant for-rent units in 2022: $568
Median gross rent in Star City, AR in 2022: $755
Housing units in Star City with a mortgage: 328 (9 second mortgage, 0 home equity loan, 0 both second mortgage and home equity loan)
Houses without a mortgage: 0
Median household income for houses/condos with a mortgage: $97,187
Median household income for apartments without a mortgage: $59,949
Median monthly housing costs: $761
Compare current foreclosures near Star City, AR:
| Photo | Address | Area | Beds / Baths | Price | Details |
|---|---|---|---|---|---|

|
#1
W Arkansas Ave
Star City, AR 71667
|
1,212 sq. feet
|
1 baths - beds |
show details | |

|
#2
Maddox St
Star City, AR 71667
|
672 sq. feet
|
1 baths - beds |
show details | |

|
#3
S Lincoln Ave
Star City, AR 71667
|
1,520 sq. feet
|
1 baths - beds |
show details | |

|
#4
S Jefferson St
Star City, AR 71667
|
2,339 sq. feet
|
1 baths - beds |
show details | |

|
#5
Journey Rd
Star City, AR 71667
|
1,680 sq. feet
|
2 baths - beds |
show details | |

|
#6
Deerfield Dr
Star City, AR 71667
|
2,754 sq. feet
|
2 baths - beds |
show details | |

|
#7
E Bradley St
Star City, AR 71667
|
1,938 sq. feet
|
2 baths - beds |
show details | |

|
#8
Birch Rd
Star City, AR 71667
|
840 sq. feet
|
1 baths - beds |
show details | |

|
#9
Autumn Hills Rd
Star City, AR 71667
|
1,020 sq. feet
|
1 baths - beds |
show details | |

|
#10
Braydn Ln
Star City, AR 71667
|
1,472 sq. feet
|
1 baths - beds |
show details |
| Photo | Address | Area | Beds / Baths | Price | Details |
|---|---|---|---|---|---|

|
#11
Us Highway 425 S
Star City, AR 71667
|
2,820 sq. feet
|
2 baths - beds |
show details | |

|
#12
Boston Rd
Star City, AR 71667
|
1,568 sq. feet
|
1 baths - beds |
show details | |

|
#13
S Drew St
Star City, AR 71667
|
1,388 sq. feet
|
2 baths - beds |
show details | |

|
#14
Lee Dr
Star City, AR 71667
|
- sq. feet
|
- baths - beds |
show details | |

|
#15
Georgia Ln
Star City, AR 71667
|
- sq. feet
|
- baths - beds |
show details | |

|
#16
Us Highway 425 S
Star City, AR 71667
|
- sq. feet
|
- baths - beds |
show details | |

|
#17
Us Highway 425 S
Star City, AR 71667
|
- sq. feet
|
- baths - beds |
show details | |

|
#18
State Highway 11 S
Star City, AR 71667
|
- sq. feet
|
- baths - beds |
show details | |

|
#19
Cane Creek Rd
Star City, AR 71667
|
- sq. feet
|
- baths - beds |
show details | |

|
#20
Auburn Ln
Star City, AR 71667
|
- sq. feet
|
- baths - beds |
show details |
| Photo | Address | Area | Beds / Baths | Price | Details |
|---|---|---|---|---|---|

|
#21
State Highway 11 S
Star City, AR 71667
|
- sq. feet
|
- baths - beds |
show details | |

|
#22
Autumn Hills Rd
Star City, AR 71667
|
- sq. feet
|
- baths - beds |
show details | |

|
#23
E Bobbies Cir
Star City, AR 71667
|
- sq. feet
|
- baths - beds |
show details | |

|
#24
Goodfellow Rd
Star City, AR 71667
|
- sq. feet
|
- baths - beds |
show details | |

|
#25
Eden Rd
Star City, AR 71667
|
- sq. feet
|
- baths - beds |
show details | |

|
#26
W Pleasant Dr
Pine Bluff, AR 71603
|
3,079 sq. feet
|
4 baths 5 beds |
$223,600
|
show details |

|
#27
W Mount Zion Rd
Monticello, AR 71655
|
1,950 sq. feet
|
2 baths - beds |
show details | |

|
#28
Red Oak Rd
Rison, AR 71665
|
1,576 sq. feet
|
2 baths - beds |
show details | |

|
#29
Dixon Ln
Pine Bluff, AR 71603
|
1,560 sq. feet
|
1 baths - beds |
show details | |

|
#30
Highway 63
Pine Bluff, AR 71603
|
1,696 sq. feet
|
1 baths - beds |
show details |
| Photo | Address | Area | Beds / Baths | Price | Details |
|---|---|---|---|---|---|

|
#31
Bill Henry Rd
Monticello, AR 71655
|
1,216 sq. feet
|
2 baths - beds |
show details | |

|
#32
Bear Trl
Rison, AR 71665
|
1,568 sq. feet
|
2 baths - beds |
show details | |

|
#33
Highway 63
Rison, AR 71665
|
1,830 sq. feet
|
2 baths - beds |
show details | |

|
#34
Regalia Dr
Pine Bluff, AR 71603
|
2,337 sq. feet
|
3 baths - beds |
show details | |

|
#35
Saint Raphael Rd
Pine Bluff, AR 71603
|
1,080 sq. feet
|
3 baths - beds |
show details | |

|
#36
Cole Rd
Rison, AR 71665
|
1,615 sq. feet
|
2 baths - beds |
show details | |

|
#37
Lincoln Rd
Wilmar, AR 71675
|
528 sq. feet
|
5 baths - beds |
show details | |

|
#38
Grider Field Ladd Rd
Pine Bluff, AR 71601
|
- sq. feet
|
- baths - beds |
show details | |

|
#39
Gun Club Rd W
Rison, AR 71665
|
1,288 sq. feet
|
- baths - beds |
show details | |

|
#40
Tooke Rd
Warren, AR 71671
|
- sq. feet
|
- baths - beds |
show details |
| Photo | Address | Area | Beds / Baths | Price | Details |
|---|---|---|---|---|---|

|
#41
Pleasant Dr
Pine Bluff, AR 71603
|
2,280 sq. feet
|
- baths - beds |
show details | |

|
#42
Toler Rd
Pine Bluff, AR 71603
|
- sq. feet
|
- baths - beds |
show details | |

|
#43
May Dr
Gould, AR 71643
|
- sq. feet
|
- baths - beds |
show details | |

|
#44
Highway 35 N
Rison, AR 71665
|
1,216 sq. feet
|
- baths - beds |
show details | |

|
#45
Highway 54
Pine Bluff, AR 71603
|
- sq. feet
|
- baths - beds |
show details | |

|
#46
Cheyenne Rd
Gould, AR 71643
|
- sq. feet
|
- baths - beds |
show details | |

|
#47
Us Highway 65
Gould, AR 71643
|
- sq. feet
|
- baths - beds |
show details | |

|
#48
Maple Dr
Rison, AR 71665
|
- sq. feet
|
- baths - beds |
show details | |

|
#49
Casey Rd
Rison, AR 71665
|
- sq. feet
|
- baths - beds |
show details | |

|
Check over 1 million property listings on Foreclosure.com!
|
browse all offers | |||


 | Pictures of Arkansas (623 replies) |
| Move to Monticello, Star City, or Stuttgart? (26 replies) |
| Thinking of moving to Pine Bluff Arkansas (11 replies) |
| Star City, Rison and Redfield (9 replies) |
| Pine Bluff info needed (84 replies) |
| Arkansas Spring Festivals (20 replies) |

Median year apartment built: 1974
Household type by relationship:
Households: 2,319- Male householders: 299 (47 living alone), Female householders: 469 (136 living alone)
378 spouses (378 opposite-sex spouses), 38 unmarried partners, (38 opposite-sex unmarried partners), 751 children (746 natural, 0 adopted, 5 stepchildren), 52 grandchildren, 81 brothers or sisters, 35 parents, 0 foster children, 85 other relatives, 6 non-relatives
- In group quarters: 121
Size of family households: 213 2-persons, 142 3-persons, 125 4-persons, 40 5-persons, 36 7-or-more-persons.
Size of nonfamily households: 199 1-person, 26 2-persons.
347 married couples with children.
183 single-parent households (0 men, 183 women).
97.3% of residents of Star City speak English at home.
1.2% of residents speak Spanish at home (100% speak English very well).
1.5% of residents speak other Indo-European language at home (94% speak English very well, 6% speak English well).
Foreign born population: 11 (0.5%)
(45.5% of them are naturalized citizens)
| Here: | 6.4 |
| State: | 6.1 |
| Here: | 4.8 |
| State: | 4.3 |

- Bedrooms in owner-occupied houses and condos in Star City, Arkansas
- 0no bedroom
- 71 bedroom
- 522 bedrooms
- 4983 bedrooms
- 404 bedrooms
- 125+ bedrooms

- Bedrooms in renter-occupied apartments in Star City, Arkansas
- 18no bedroom
- 241 bedroom
- 362 bedrooms
- 1033 bedrooms
- 04 bedrooms
- 05+ bedrooms

- Cars and other vehicles available in Star City in owner-occupied houses/condos
- 6no vehicle
- 1841 vehicle
- 2502 vehicles
- 903 vehicles
- 324 vehicles
- 485+ vehicles

- Cars and other vehicles available in Star City in renter-occupied apartments
- 1no vehicle
- 941 vehicle
- 572 vehicles
- 283 vehicles
- 04 vehicles
- 05+ vehicles

- Rooms in owner-occupied houses in Star City, Arkansas
- 01 room
- 02 rooms
- 63 rooms
- 354 rooms
- 1415 rooms
- 1366 rooms
- 377 rooms
- 818 rooms
- 1739+ rooms

- Rooms in renter-occupied apartments in Star City, Arkansas
- 181 room
- 02 rooms
- 73 rooms
- 224 rooms
- 1025 rooms
- 156 rooms
- 57 rooms
- 128 rooms
- 09+ rooms


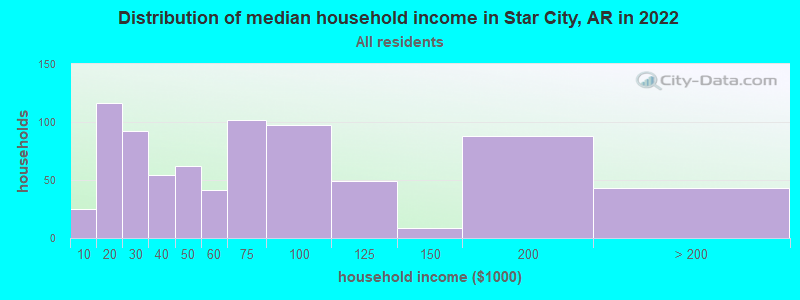
Star City, AR household income distribution

- 25Less than $10,000
- 116$10,000 to $19,999
- 92$20,000 to $29,999
- 54$30,000 to $39,999
- 62$40,000 to $49,999
- 41$50,000 to $59,999
- 102$60,000 to $74,999
- 97$75,000 to $99,999
- 49$100,000 to $124,999
- 9$125,000 to $149,999
- 88$150,000 to $199,999
- 43$200,000 or more
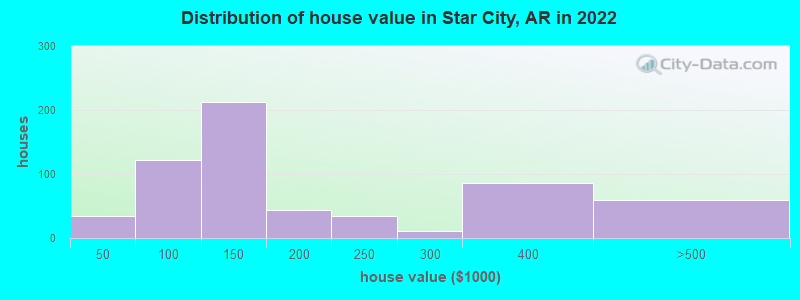
Home value of owner - occupied houses in 2022 in Star City, AR
-
- 2$10,000 to $14,999
- 6$15,000 to $19,999
- 12$25,000 to $29,999
- 12$40,000 to $49,999
- 10$50,000 to $59,999
- 6$60,000 to $69,999
- 15$70,000 to $79,999
- 41$80,000 to $89,999
- 36$90,000 to $99,999
- 180$100,000 to $124,999
- 31$125,000 to $149,999
- 18$150,000 to $174,999
- 25$175,000 to $199,999
- 34$200,000 to $249,999
- 11$250,000 to $299,999
- 86$300,000 to $399,999
- 59$400,000 to $499,999
Rent paid by renters in 2022 in Star City, AR
-
- 30Less than $100
- 5$150 to $199
- 7$300 to $349
- 13$350 to $399
- 49$500 to $549
- 33$550 to $599
- 17$600 to $649
- 11$650 to $699
- 13No cash rent


Percentage of workers working in this county: 74.8%
Number of people working at home: 36 (3.5% of all workers)
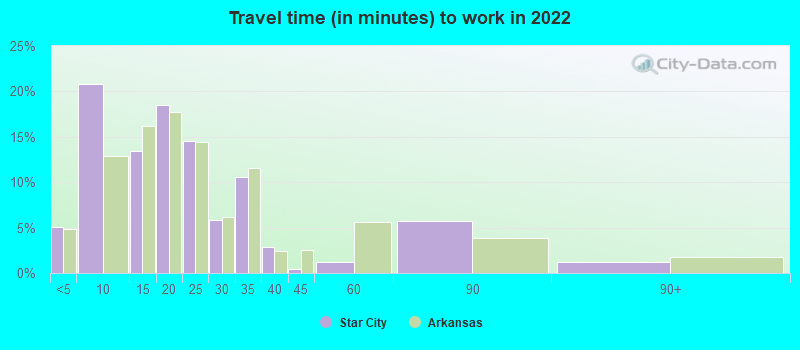
Travel time to work (commute)
- Less than 5 minutes: 62
- 5 to 9 minutes: 280
- 10 to 14 minutes: 69
- 15 to 19 minutes: 35
- 20 to 24 minutes: 137
- 25 to 29 minutes: 29
- 30 to 34 minutes: 242
- 35 to 39 minutes: 31
- 40 to 44 minutes: 12
- 45 to 59 minutes: 13
- 60 to 89 minutes: 20
- 90 or more minutes: 28
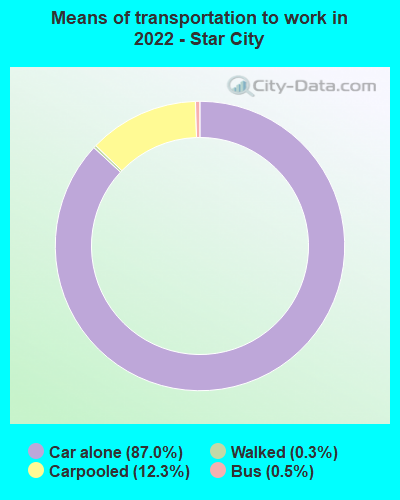
Means of transportation to work:
- Drove a car alone: 1,534 (84.8%)
- Carpooled: 189 (10.4%)
- Bus: 8 (0.4%)
- Walked: 5 (0.3%)
- Worked at home: 36 (2.0%)

- Unemployment by race in 2022
- Unemployment rate for White non-Hispanic residents
- 3.7%Males
- Unemployment rate for Black residents
- 12.4%Males

- Year of entry for the foreign-born population in Star City, Arkansas
- 52010 or later
- 52000 to 2009
- 21990 to 1999
- 01980 to 1989
- 51970 to 1979
- 11Before 1970

First ancestries reported:
- American: 285 (26.3%)
- English: 162 (14.9%)
- African: 108 (9.9%)
- Irish: 38 (3.5%)
- German: 10 (0.9%)
- Scottish: 10 (0.9%)
- Italian: 9 (0.8%)
- Scotch-Irish: 8 (0.7%)
- British: 5 (0.5%)
Most common places of birth for foreign-born residents (%):
| Star City: | 72.7% (8) |
| Arkansas: | 1.8% (2,721) |
| Star City: | 9.1% (1) |
| Arkansas: | 40.2% (61,075) |
Place of birth for U.S.-born residents:
- This state: 1,958
- Other state: 325
- Northeast: 10
- Midwest: 22
- South: 267
- West: 24
87.5% of Star City residents lived in the same house 1 years ago.
Out of people who lived in different houses, 39.6% lived in this county.
Out of people who lived in different counties, 98.7% lived in Arkansas.
| Star City: | 87.5% |
| State average: | 87.0% |
Education attainment for males 25 years and older:
- No schooling: 26
- Nursery to 4th grade: 0
- 5th and 6th grade: 0
- 7th and 8th grade: 7
- 9th grade: 21
- 10th grade: 0
- 11th grade: 0
- 12th grade, no diploma: 14
- High school graduate (or equivalency): 174
- Less than 1 year of college: 58
- Some college more than 1 year, no degree: 86
- Associate degree: 52
- Bachelor's degree: 67
- Master's degree: 41
- Professional school degree: 0
- Doctorate degree: 0

Education attainment for females 25 years and older:
- No schooling: 5
- Nursery to 4th grade: 0
- 5th and 6th grade: 4
- 7th and 8th grade: 24
- 9th grade: 0
- 10th grade: 4
- 11th grade: 12
- 12th grade, no diploma: 6
- High school graduate (or equivalency): 416
- Less than 1 year of college: 73
- Some college more than 1 year, no degree: 170
- Associate degree: 60
- Bachelor's degree: 91
- Master's degree: 54
- Professional school degree: 0
- Doctorate degree: 0


Housing units in structures:
- One, detached: 877
- Two: 23
- 3 or 4: 17
- 20 to 49: 2
- Mobile homes: 140
Housing units lacking complete kitchen facilities in 2022: 7.2%
House/condo owner moved in on average 14 years ago
Renter moved in on average 1 years ago

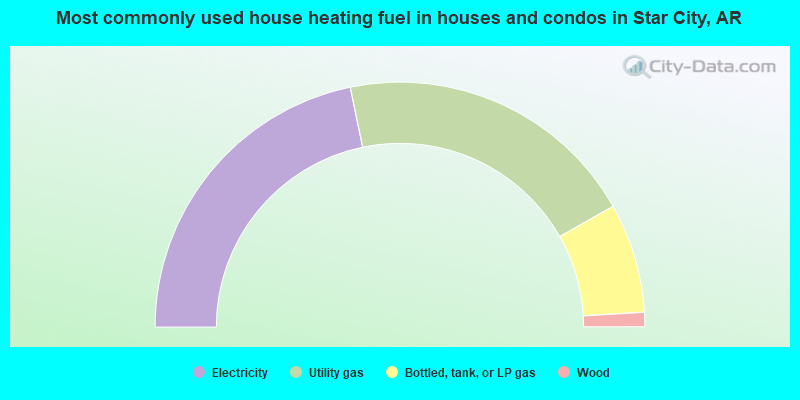
- 43.5%Electricity
- 40.1%Utility gas
- 14.5%Bottled, tank, or LP gas
- 1.9%Wood
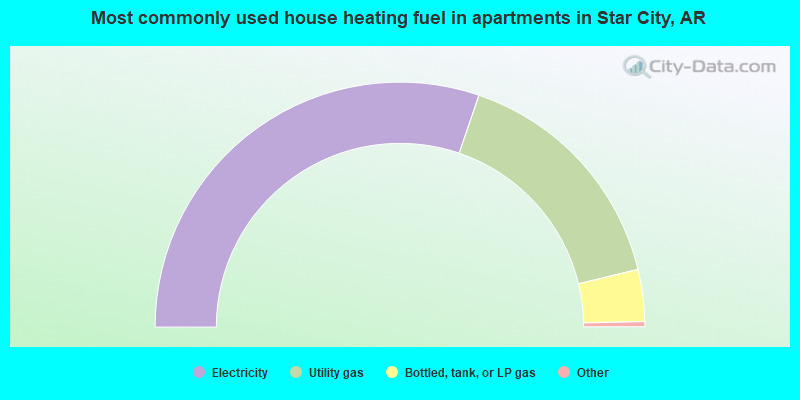
- 60.9%Electricity
- 32.2%Utility gas
- 6.9%Bottled, tank, or LP gas
Private vs. public school enrollment:
| Here: | 12.3% |
| Arkansas: | 10.5% |
| Here: | 0.0% |
| Arkansas: | 8.7% |
| Here: | 83.7% |
| Arkansas: | 19.4% |


