Sugar Hill, GA (Georgia) Houses and Residents
| Sugar Hill: | $410,020 |
| Georgia: | $297,400 |
Mean price in 2022:
Detached houses: $328,536
Here: $328,536 State: $376,364 Townhouses or other attached units: $277,890
Here: $277,890 State: $341,709 Mobile homes: $96,672
Here: $96,672 State: $102,413
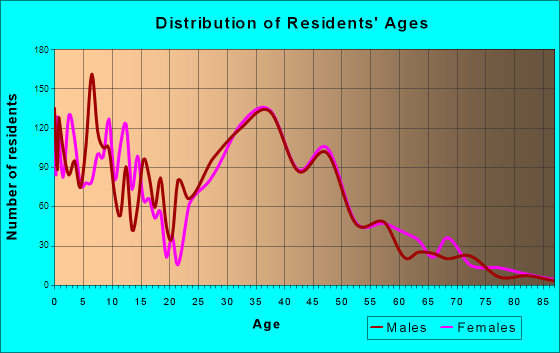
Total population: 20,821 (Urban population: 11,119, Rural population: 112 (all nonfarm))
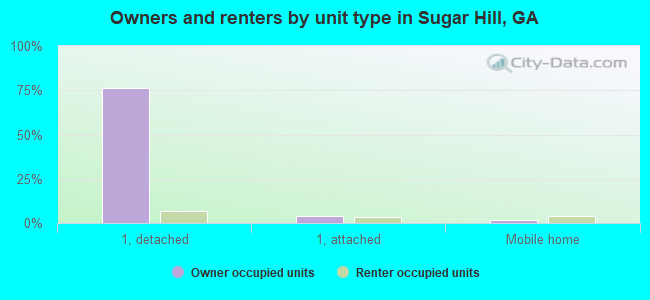
Houses: 8,708 (8,540 occupied: 6,925 owner occupied, 1,617 renter occupied)
| % of renters here: | 19% |
| State: | 34% |
Housing density: 951 houses/condos per square mile
Median price asked for vacant for-sale houses and condos in 2022: $509,856.
Median contract rent in 2022: $1,328 (lower quartile is $1,093, upper quartile is $1,834)
Median rent asked for vacant for-rent units in 2022: $4,170
Median gross rent in Sugar Hill, GA in 2022: $1,578
Housing units in Sugar Hill with a mortgage: 4,730 (291 second mortgage, 0 home equity loan, 213 both second mortgage and home equity loan)
Houses without a mortgage: 66
Median household income for houses/condos with a mortgage: $113,939
Median household income for apartments without a mortgage: $59,107
Median monthly housing costs: $1,723
Compare current foreclosures near Sugar Hill, GA:
| Photo | Address | Area | Beds / Baths | Price | Details |
|---|---|---|---|---|---|

|
#1
Cranbrook Glen Ln
Snellville, GA 30078
|
3,979 sq. feet
|
3 baths 5 beds |
$799,900
|
show details |

|
#2
Thames Willow Way
Suwanee, GA 30024
|
1,802 sq. feet
|
3 baths 3 beds |
show details | |

|
#3
Hidden Branch Dr
Buford, GA 30518
|
1,568 sq. feet
|
2 baths 3 beds |
show details | |

|
#4
Quailwood Dr
Flowery Branch, GA 30542
|
5,142 sq. feet
|
4 baths 4 beds |
show details | |

|
#5
Bart Johnson Rd
Buford, GA 30519
|
4,185 sq. feet
|
1 baths 2 beds |
show details | |

|
#6
Mahone Drive
Lilburn, GA 30047
|
1,897 sq. feet
|
1 baths 3 beds |
show details | |

|
#7
Alcovy Shoals Blf
Lawrenceville, GA 30045
|
4,131 sq. feet
|
4 baths 5 beds |
show details | |

|
#8
Knights Bridge Ct
Norcross, GA 30093
|
1,272 sq. feet
|
2 baths 3 beds |
show details | |

|
#9
Orleans Ct
Grayson, GA 30017
|
4,634 sq. feet
|
1 baths 4 beds |
show details | |

|
#10
Saint Claire Dr
Alpharetta, GA 30004
|
2,092 sq. feet
|
2 baths 3 beds |
show details |
| Photo | Address | Area | Beds / Baths | Price | Details |
|---|---|---|---|---|---|

|
#11
Hollywood Dr
Lawrenceville, GA 30044
|
1,812 sq. feet
|
2 baths 3 beds |
show details | |

|
#12
Lazy Ln
Winder, GA 30680
|
2,205 sq. feet
|
2 baths 3 beds |
show details | |

|
#13
Chastain Ct
Alpharetta, GA 30004
|
2,101 sq. feet
|
2 baths 3 beds |
show details | |

|
#14
Winnbrook Dr
Dacula, GA 30019
|
1,903 sq. feet
|
3 baths 3 beds |
show details | |

|
#15
Crooked O Trl # O
Gainesville, GA 30506
|
1,118 sq. feet
|
2 baths 3 beds |
show details | |

|
#16
Ridge Bluff Ln
Suwanee, GA 30024
|
4,006 sq. feet
|
3 baths 4 beds |
show details | |

|
#17
Mill Springs Cir
Buford, GA 30519
|
1,468 sq. feet
|
3 baths 3 beds |
show details | |

|
#18
Orion Ct
Grayson, GA 30017
|
2,051 sq. feet
|
2 baths 3 beds |
show details | |

|
#19
Howell Park Rd
Duluth, GA 30096
|
1,428 sq. feet
|
2 baths 3 beds |
show details | |

|
#20
Merrion Park Ct
Dacula, GA 30019
|
2,840 sq. feet
|
2 baths 4 beds |
show details |
| Photo | Address | Area | Beds / Baths | Price | Details |
|---|---|---|---|---|---|

|
#21
Castle View Ct
Suwanee, GA 30024
|
3,372 sq. feet
|
3 baths 4 beds |
show details | |

|
#22
Buena Vista Cir
Gainesville, GA 30504
|
1,360 sq. feet
|
2 baths 3 beds |
show details | |

|
#23
Landington Way
Duluth, GA 30096
|
1,244 sq. feet
|
2 baths 3 beds |
show details | |

|
#24
Centennial Sq
Norcross, GA 30092
|
1,456 sq. feet
|
3 baths 3 beds |
show details | |

|
#25
Gracen Dr
Gainesville, GA 30506
|
- sq. feet
|
2 baths 4 beds |
show details | |

|
#26
Amber Creek Dr
Buford, GA 30519
|
1,385 sq. feet
|
2 baths 3 beds |
show details | |

|
#27
Candlewood Way
Lawrenceville, GA 30044
|
1,730 sq. feet
|
3 baths 4 beds |
show details | |

|
#28
Knox Park Overlook
Duluth, GA 30097
|
2,098 sq. feet
|
2 baths 3 beds |
show details | |

|
#29
Loowit Falls Way
Braselton, GA 30517
|
2,580 sq. feet
|
3 baths 4 beds |
show details | |

|
#30
High Hampton Chase
Alpharetta, GA 30022
|
3,157 sq. feet
|
4 baths 4 beds |
show details |
| Photo | Address | Area | Beds / Baths | Price | Details |
|---|---|---|---|---|---|

|
#31
Springer Walk
Lawrenceville, GA 30043
|
2,502 sq. feet
|
3 baths 4 beds |
show details | |

|
#32
Eagles Pass
Alpharetta, GA 30004
|
4,596 sq. feet
|
6 baths 6 beds |
show details | |

|
#33
Ridgedale Way
Lawrenceville, GA 30044
|
1,728 sq. feet
|
2 baths 4 beds |
show details | |

|
#34
Flowers Xing
Lawrenceville, GA 30044
|
1,968 sq. feet
|
2 baths 4 beds |
show details | |

|
#35
Parkside Close
Alpharetta, GA 30022
|
2,678 sq. feet
|
2 baths 4 beds |
show details | |

|
#36
Wind Forest Ct
Norcross, GA 30071
|
948 sq. feet
|
2 baths 3 beds |
show details | |

|
#37
Stonebrook Way
Lawrenceville, GA 30043
|
4,342 sq. feet
|
3 baths 5 beds |
show details | |

|
#38
Glenbarr Dr
Duluth, GA 30097
|
1,720 sq. feet
|
2 baths 3 beds |
show details | |

|
#39
Lost Creek Dr
Gainesville, GA 30504
|
1,303 sq. feet
|
3 baths 5 beds |
show details | |

|
#40
Twin Creeks Pl
Norcross, GA 30071
|
3,383 sq. feet
|
3 baths 4 beds |
show details |
| Photo | Address | Area | Beds / Baths | Price | Details |
|---|---|---|---|---|---|

|
#41
Marcia Overlook Dr
Cumming, GA 30041
|
3,400 sq. feet
|
4 baths 5 beds |
show details | |

|
#42
Eagle Crossing Dr
Lawrenceville, GA 30044
|
2,771 sq. feet
|
2 baths 5 beds |
show details | |

|
#43
Lester Woods Dr
Lawrenceville, GA 30044
|
1,328 sq. feet
|
2 baths 3 beds |
show details | |

|
#44
Cedarhurst Rd
Lawrenceville, GA 30045
|
1,776 sq. feet
|
2 baths 4 beds |
show details | |

|
#45
Hewatt Rd SW
Lilburn, GA 30047
|
1,362 sq. feet
|
2 baths 3 beds |
show details | |

|
#46
Horizon Dr
Flowery Branch, GA 30542
|
1,816 sq. feet
|
2 baths 3 beds |
show details | |

|
#47
Austin Garner Rd
Buford, GA 30518
|
1,536 sq. feet
|
3 baths 3 beds |
show details | |

|
#48
Arbor Gat 1908
Lawrenceville, GA 30044
|
1,520 sq. feet
|
1 baths 3 beds |
show details | |

|
#49
Lowell Rd
Bethlehem, GA 30620
|
2,740 sq. feet
|
4 baths 4 beds |
show details | |

|
Check over 1 million property listings on Foreclosure.com!
|
browse all offers | |||


 | Working class and lower income neighborhoods close to office parks? Housing under 100k? Tralier parks, townhomes, condos (24 replies) |
| Why are so many homes up for sale in Suwanee? (13 replies) |
| Housing Search (230 replies) |
| Housing prices are ridiculous (82 replies) |
| Do nice homes in nice areas for under $250k exist in Atlanta Metro? (36 replies) |
| Sugar Hill - are we making a mistake?! (25 replies) |
Median year apartment built: 1989
Household type by relationship:
Households: 25,399- Male householders: 4,478 (483 living alone), Female householders: 3,978 (694 living alone)
5,322 spouses (5,278 opposite-sex spouses), 256 unmarried partners, (187 opposite-sex unmarried partners), 9,285 children (8,863 natural, 127 adopted, 294 stepchildren), 289 grandchildren, 233 brothers or sisters, 412 parents, 14 foster children, 672 other relatives, 439 non-relatives
- In group quarters: 15
Size of family households: 2,539 2-persons, 1,695 3-persons, 1,738 4-persons, 671 5-persons, 310 6-persons, 110 7-or-more-persons.
Size of nonfamily households: 1,149 1-person, 234 2-persons, 72 3-persons.
4,668 married couples with children.
2,002 single-parent households (486 men, 1,516 women).
66.3% of residents of Sugar Hill speak English at home.
14.9% of residents speak Spanish at home (42% speak English very well, 33% speak English well, 19% speak English not well, 6% don't speak English at all).
6.8% of residents speak other Indo-European language at home (72% speak English very well, 20% speak English well, 9% speak English not well).
9.3% of residents speak Asian or Pacific Island language at home (41% speak English very well, 34% speak English well, 23% speak English not well, 2% don't speak English at all).
2.3% of residents speak other language at home (51% speak English very well, 40% speak English well, 1% speak English not well, 8% don't speak English at all).
Foreign born population: 5,872 (23.1%)
(52.7% of them are naturalized citizens)
| Here: | 7.2 |
| State: | 6.8 |
| Here: | 5.4 |
| State: | 4.6 |
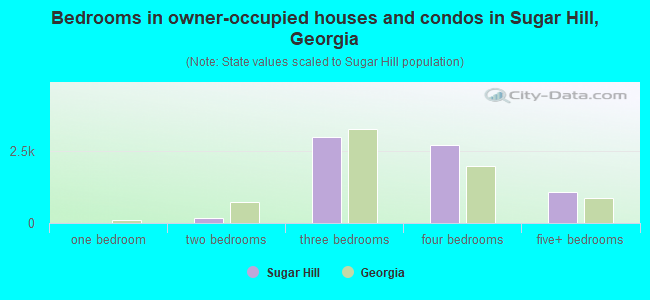
- Bedrooms in owner-occupied houses and condos in Sugar Hill, Georgia
- 0no bedroom
- 01 bedroom
- 1612 bedrooms
- 2,9733 bedrooms
- 2,7154 bedrooms
- 1,0765+ bedrooms
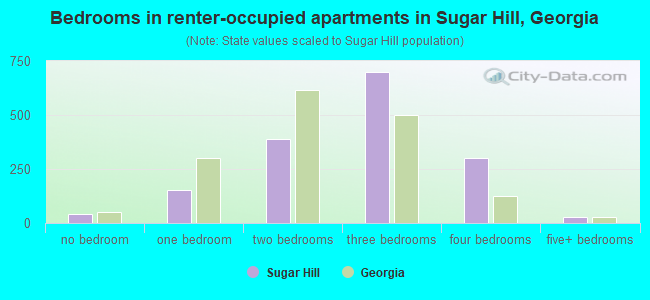
- Bedrooms in renter-occupied apartments in Sugar Hill, Georgia
- 42no bedroom
- 1531 bedroom
- 3912 bedrooms
- 7013 bedrooms
- 3004 bedrooms
- 305+ bedrooms
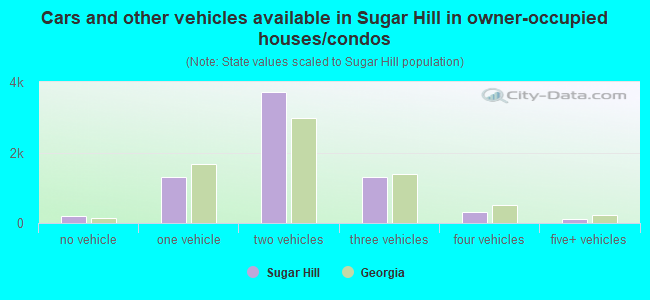
- Cars and other vehicles available in Sugar Hill in owner-occupied houses/condos
- 186no vehicle
- 1,3111 vehicle
- 3,7072 vehicles
- 1,3013 vehicles
- 3054 vehicles
- 1155+ vehicles
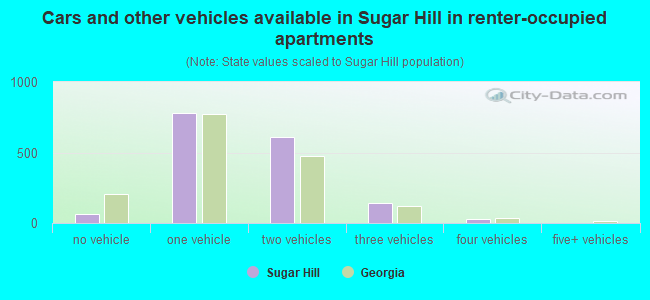
- Cars and other vehicles available in Sugar Hill in renter-occupied apartments
- 65no vehicle
- 7781 vehicle
- 6082 vehicles
- 1393 vehicles
- 294 vehicles
- 05+ vehicles
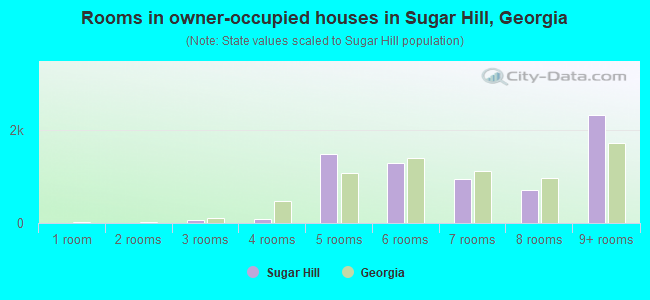
- Rooms in owner-occupied houses in Sugar Hill, Georgia
- 01 room
- 02 rooms
- 723 rooms
- 844 rooms
- 1,4875 rooms
- 1,2846 rooms
- 9527 rooms
- 7218 rooms
- 2,3259+ rooms
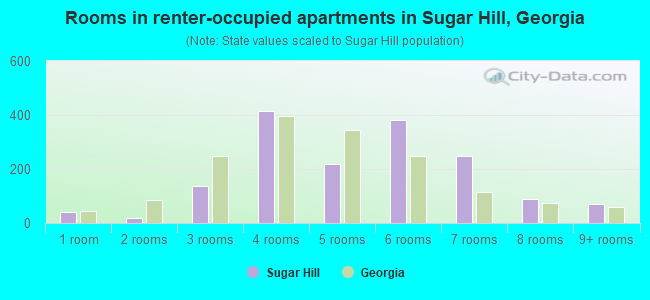
- Rooms in renter-occupied apartments in Sugar Hill, Georgia
- 421 room
- 202 rooms
- 1383 rooms
- 4154 rooms
- 2175 rooms
- 3806 rooms
- 2477 rooms
- 888 rooms
- 719+ rooms
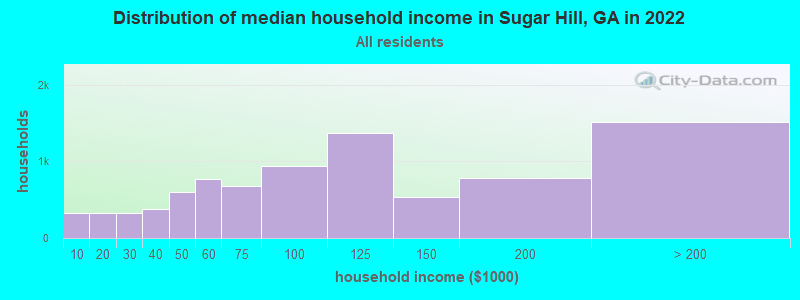
Sugar Hill, GA household income distribution

- 327Less than $10,000
- 324$10,000 to $19,999
- 330$20,000 to $29,999
- 376$30,000 to $39,999
- 595$40,000 to $49,999
- 768$50,000 to $59,999
- 684$60,000 to $74,999
- 937$75,000 to $99,999
- 1,374$100,000 to $124,999
- 533$125,000 to $149,999
- 779$150,000 to $199,999
- 1,512$200,000 or more
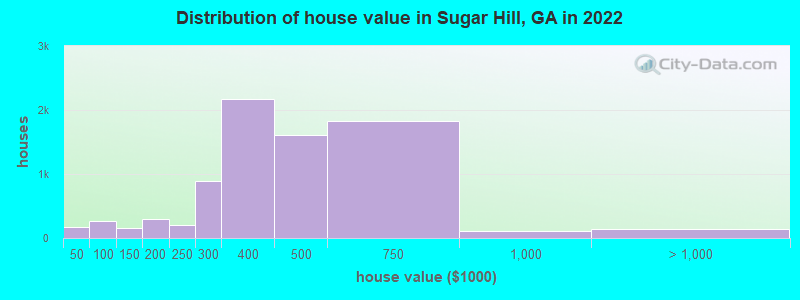
Home value of owner - occupied houses in 2022 in Sugar Hill, GA
-
- 99Less than $10,000
- 25$10,000 to $14,999
- 18$20,000 to $24,999
- 26$25,000 to $29,999
- 203$50,000 to $59,999
- 31$70,000 to $79,999
- 25$90,000 to $99,999
- 78$100,000 to $124,999
- 71$125,000 to $149,999
- 120$150,000 to $174,999
- 172$175,000 to $199,999
- 202$200,000 to $249,999
- 892$250,000 to $299,999
- 2,171$300,000 to $399,999
- 1,613$400,000 to $499,999
- 1,823$500,000 to $749,999
- 102$750,000 to $999,999
- 137$2,000,000 or more
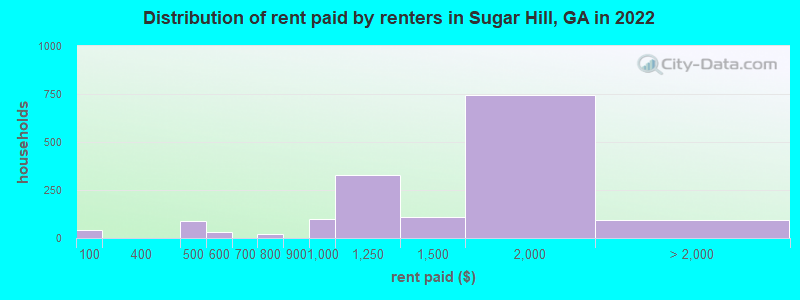
Rent paid by renters in 2022 in Sugar Hill, GA
-
- 41Less than $100
- 85$450 to $499
- 33$550 to $599
- 21$750 to $799
- 99$900 to $999
- 325$1,000 to $1,249
- 107$1,250 to $1,499
- 745$1,500 to $1,999
- 91$2,000 to $2,499
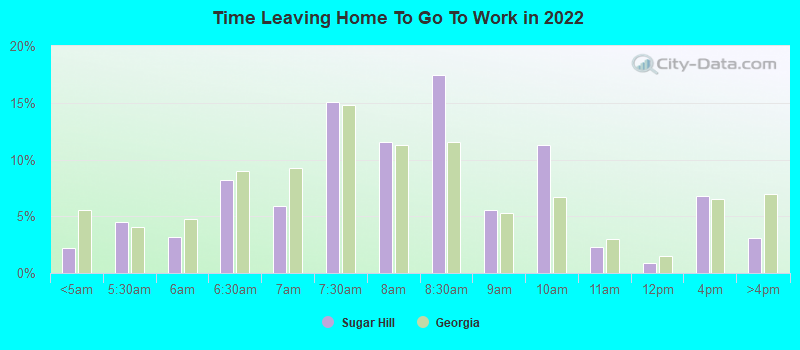
Percentage of workers working in this county: 61.4%
Number of people working at home: 2,163 (16.4% of all workers)
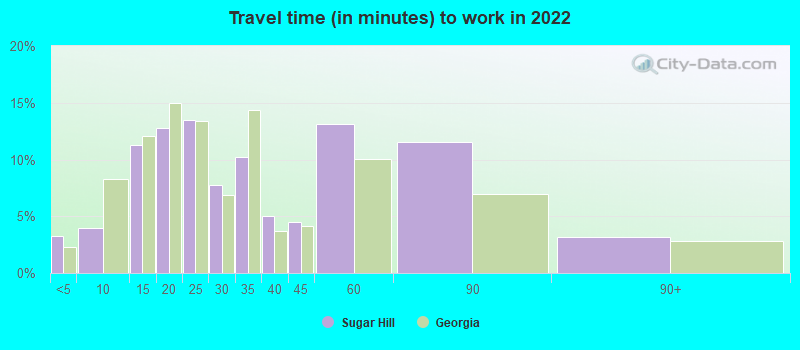
Travel time to work (commute)
- Less than 5 minutes: 128
- 5 to 9 minutes: 231
- 10 to 14 minutes: 799
- 15 to 19 minutes: 1,530
- 20 to 24 minutes: 1,977
- 25 to 29 minutes: 715
- 30 to 34 minutes: 2,134
- 35 to 39 minutes: 471
- 40 to 44 minutes: 470
- 45 to 59 minutes: 1,124
- 60 to 89 minutes: 1,190
- 90 or more minutes: 274
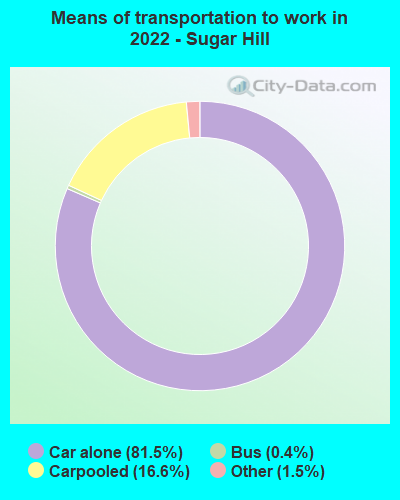
Means of transportation to work:
- Drove a car alone: 4,848 (59.2%)
- Carpooled: 1,180 (14.4%)
- Bus: 31 (0.4%)
- Taxi: 123 (1.5%)
- Worked at home: 2,163 (26.4%)
- Unemployment by race in 2022
- Unemployment rate for White non-Hispanic residents
- 2.1%Males
- 3.5%Females
- Unemployment rate for Black residents
- 1.5%Males
- 10.5%Females
- Unemployment rate for Asian residents
- 3.9%Males
- 1.2%Females
- Unemployment rate for Hispanic or Latino residents
- 2.6%Males
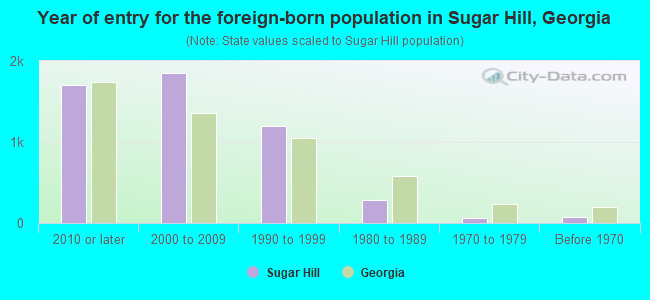
- Year of entry for the foreign-born population in Sugar Hill, Georgia
- 1,6992010 or later
- 1,8472000 to 2009
- 1,1991990 to 1999
- 2901980 to 1989
- 641970 to 1979
- 71Before 1970
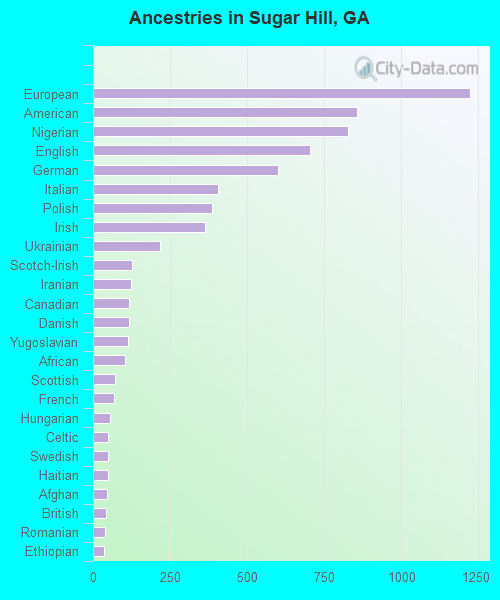
First ancestries reported:
- European: 1,224 (8.9%)
- American: 856 (6.2%)
- Nigerian: 827 (6.0%)
- English: 705 (5.1%)
- German: 600 (4.4%)
- Italian: 407 (3.0%)
- Polish: 387 (2.8%)
- Irish: 362 (2.6%)
- Ukrainian: 217 (1.6%)
- Scotch-Irish: 128 (0.9%)
- Iranian: 122 (0.9%)
- Canadian: 118 (0.9%)
- Danish: 116 (0.8%)
- Yugoslavian: 112 (0.8%)
- African: 104 (0.8%)
- Scottish: 70 (0.5%)
- French: 67 (0.5%)
- Hungarian: 55 (0.4%)
- Celtic: 49 (0.4%)
- Swedish: 49 (0.4%)
- Haitian: 48 (0.3%)
- Afghan: 44 (0.3%)
- British: 42 (0.3%)
- Romanian: 38 (0.3%)
- Ethiopian: 37 (0.3%)
- Lebanese: 31 (0.2%)
- Finnish: 16 (0.1%)
- Lithuanian: 15 (0.1%)
- Greek: 13 (0.09%)
- French Canadian: 13 (0.09%)
- Palestinian: 10 (0.07%)
- Slovene: 10 (0.07%)
- Zimbabwean: 8 (0.06%)
- Liberian: 7 (0.05%)
- Northern European: 3 (0.02%)
Most common places of birth for foreign-born residents (%):
| Sugar Hill: | 18.4% (1,070) |
| Georgia: | 3.9% (43,756) |
| Sugar Hill: | 18.4% (1,070) |
| Georgia: | 20.0% (223,400) |
| Sugar Hill: | 9.8% (571) |
| Georgia: | 2.5% (27,846) |
| Sugar Hill: | 7.2% (417) |
| Georgia: | 1.7% (19,012) |
| Sugar Hill: | 5.1% (294) |
| Georgia: | 3.5% (39,227) |
| Sugar Hill: | 4.9% (287) |
| Georgia: | 9.2% (103,325) |
| Sugar Hill: | 4.5% (262) |
| Georgia: | 0.4% (4,193) |
| Sugar Hill: | 3.5% (206) |
| Georgia: | 2.5% (27,794) |
| Sugar Hill: | 2.9% (171) |
| Georgia: | 1.6% (17,851) |
| Sugar Hill: | 2.6% (153) |
| Georgia: | 2.1% (23,813) |
| Sugar Hill: | 2.0% (117) |
| Georgia: | 0.7% (7,441) |
| Sugar Hill: | 2.0% (114) |
| Georgia: | 0.6% (6,963) |
Place of birth for U.S.-born residents:
- This state: 10,243
- Other state: 8,825
- Northeast: 2,452
- Midwest: 1,461
- South: 3,838
- West: 1,097
88.2% of Sugar Hill residents lived in the same house 1 years ago.
Out of people who lived in different houses, 36.6% lived in this county.
Out of people who lived in different counties, 52.1% lived in Georgia.
| Sugar Hill: | 88.2% |
| State average: | 86.6% |
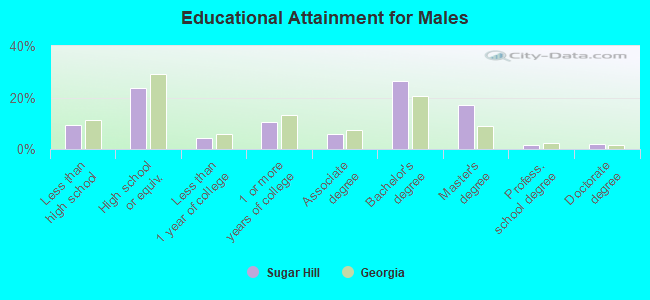
Education attainment for males 25 years and older:
- No schooling: 170
- Nursery to 4th grade: 49
- 5th and 6th grade: 43
- 7th and 8th grade: 154
- 9th grade: 54
- 10th grade: 112
- 11th grade: 25
- 12th grade, no diploma: 115
- High school graduate (or equivalency): 1,831
- Less than 1 year of college: 322
- Some college more than 1 year, no degree: 800
- Associate degree: 459
- Bachelor's degree: 2,039
- Master's degree: 1,319
- Professional school degree: 122
- Doctorate degree: 136
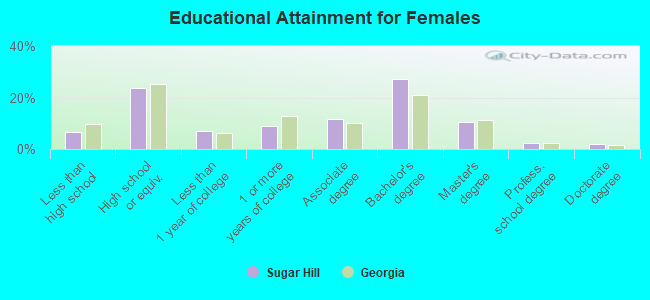
Education attainment for females 25 years and older:
- No schooling: 113
- Nursery to 4th grade: 34
- 5th and 6th grade: 110
- 7th and 8th grade: 53
- 9th grade: 101
- 10th grade: 6
- 11th grade: 19
- 12th grade, no diploma: 133
- High school graduate (or equivalency): 2,056
- Less than 1 year of college: 603
- Some college more than 1 year, no degree: 784
- Associate degree: 992
- Bachelor's degree: 2,360
- Master's degree: 913
- Professional school degree: 185
- Doctorate degree: 160
Housing units in structures:
- One, detached: 7,144
- One, attached: 598
- Two: 40
- 3 or 4: 40
- 5 to 9: 156
- 10 to 19: 20
- 20 to 49: 77
- 50 or more: 57
- Mobile homes: 574
Median worth of mobile homes: $71,210
Housing units lacking complete kitchen facilities in 2022: 0.5%
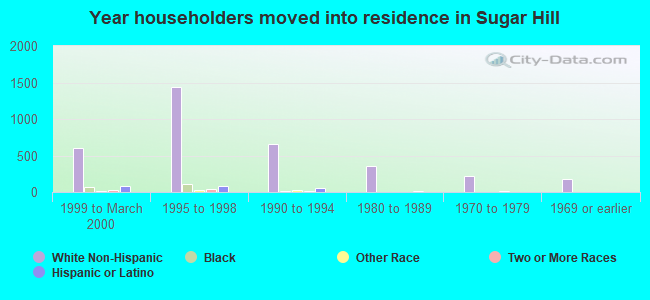
House/condo owner moved in on average 7 years ago
Renter moved in on average 3 years ago
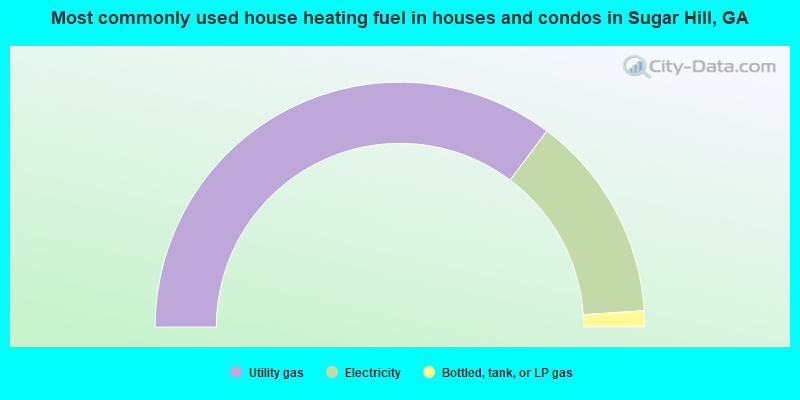
- 70.5%Utility gas
- 27.4%Electricity
- 2.1%Bottled, tank, or LP gas
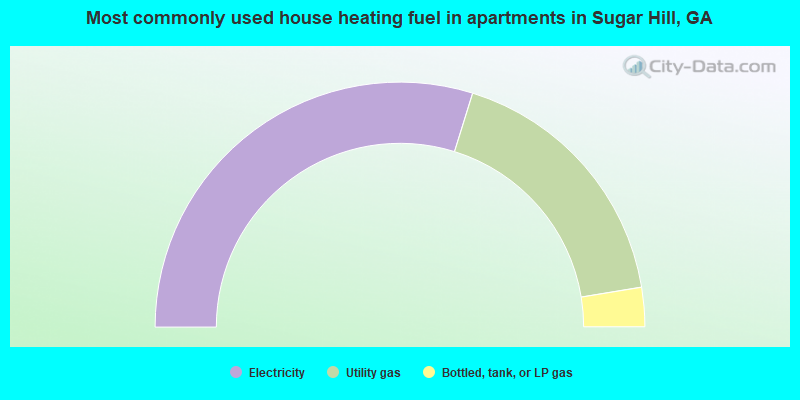
- 59.6%Electricity
- 35.2%Utility gas
- 5.2%Bottled, tank, or LP gas
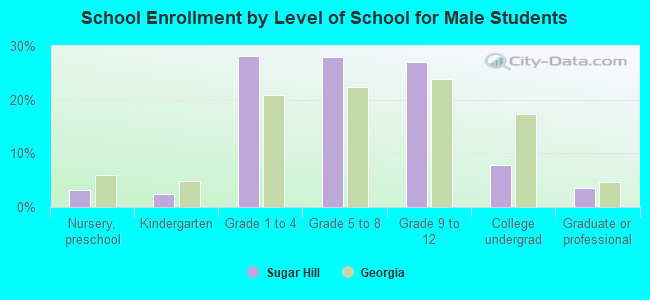
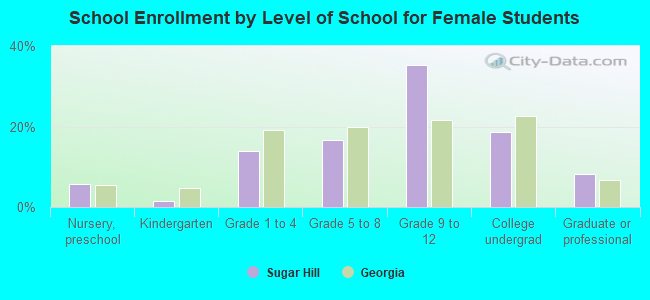
Private vs. public school enrollment:
| Here: | 6.2% |
| Georgia: | 12.1% |
| Here: | 2.6% |
| Georgia: | 10.8% |
| Here: | 28.0% |
| Georgia: | 17.1% |