Summerville, PA (Pennsylvania) Houses and Residents
| Summerville: | $83,244 |
| Pennsylvania: | $245,500 |
Mean price in 2022:
Detached houses: $101,206
Here: $101,206 State: $317,202 Mobile homes: $55,574
Here: $55,574 State: $92,414
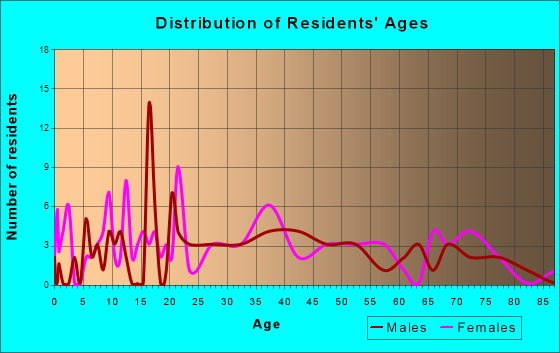
Total population: 522 (Urban population: 0, Rural population: 526 (all nonfarm))
Houses: 226 (169 occupied: 114 owner occupied, 57 renter occupied)
| % of renters here: | 33% |
| State: | 31% |
Housing density: 363 houses/condos per square mile
Median price asked for vacant for-sale houses and condos in 2022: $1,070,156.
Median contract rent in 2022: $496 (lower quartile is $370, upper quartile is $718)
Median rent asked for vacant for-rent units in 2022: $581
Median gross rent in Summerville, PA in 2022: $824
Housing units in Summerville with a mortgage: 32 (4 second mortgage, 0 home equity loan, 4 both second mortgage and home equity loan)
Houses without a mortgage: 0
Median household income for houses/condos with a mortgage: $68,506
Median household income for apartments without a mortgage: $54,216
Median monthly housing costs: $613
Compare current foreclosures near Summerville, PA:
| Photo | Address | Area | Beds / Baths | Price | Details |
|---|---|---|---|---|---|

|
#1
Curtinbottom Rd
Summerville, PA 15864
|
384 sq. feet
|
- baths - beds |
show details | |

|
#2
Burgoon Rd
Summerville, PA 15864
|
768 sq. feet
|
- baths - beds |
show details | |

|
#3
Penn St
New Bethlehem, PA 16242
|
780 sq. feet
|
2 baths 4 beds |
$39,900
|
show details |

|
#4
Ridge Ave
Punxsutawney, PA 15767
|
848 sq. feet
|
- baths - beds |
$14,900
|
show details |

|
#5
Jackson St
Reynoldsville, PA 15851
|
797 sq. feet
|
- baths - beds |
$25,900
|
show details |

|
#6
Main St
Corsica, PA 15829
|
1,268 sq. feet
|
1 baths 3 beds |
show details | |

|
#7
Route 68
Clarion, PA 16214
|
- sq. feet
|
1 baths 2 beds |
show details | |

|
#8
Gravel Lick Rd
Strattanville, PA 16258
|
512 sq. feet
|
- baths - beds |
show details | |

|
#9
Route 68
Rimersburg, PA 16248
|
- sq. feet
|
- baths - beds |
show details | |

|
#10
W Liberty St
Punxsutawney, PA 15767
|
609 sq. feet
|
- baths - beds |
show details |
| Photo | Address | Area | Beds / Baths | Price | Details |
|---|---|---|---|---|---|

|
#11
E Main St
Dayton, PA 16222
|
- sq. feet
|
- baths - beds |
show details | |

|
#12
W Mahoning St
Punxsutawney, PA 15767
|
- sq. feet
|
- baths - beds |
show details | |

|
#13
Grant St
Reynoldsville, PA 15851
|
840 sq. feet
|
- baths - beds |
show details | |

|
#14
Indiana St
Punxsutawney, PA 15767
|
784 sq. feet
|
- baths - beds |
show details | |

|
#15
Lobaughhill Rd
Rimersburg, PA 16248
|
580 sq. feet
|
- baths - beds |
show details | |

|
#16
Belmont Ave
Punxsutawney, PA 15767
|
700 sq. feet
|
- baths - beds |
show details | |

|
#17
W Mahoning St
Punxsutawney, PA 15767
|
- sq. feet
|
- baths - beds |
show details | |

|
#18
Allens Mills Rd
Reynoldsville, PA 15851
|
1,152 sq. feet
|
- baths - beds |
show details | |

|
#19
Calhoun School Rd
New Bethlehem, PA 16242
|
- sq. feet
|
- baths - beds |
show details | |

|
#20
Hormtown Rd
Reynoldsville, PA 15851
|
1,232 sq. feet
|
- baths - beds |
show details |
| Photo | Address | Area | Beds / Baths | Price | Details |
|---|---|---|---|---|---|

|
#21
Grant St
Reynoldsville, PA 15851
|
648 sq. feet
|
- baths - beds |
show details | |

|
#22
Bradford St
Reynoldsville, PA 15851
|
900 sq. feet
|
- baths - beds |
show details | |

|
#23
1st St
De Lancey, PA 15733
|
- sq. feet
|
- baths - beds |
show details | |

|
#24
Perry Way
Punxsutawney, PA 15767
|
448 sq. feet
|
- baths - beds |
show details | |

|
#25
Brocious Rd
Brookville, PA 15825
|
- sq. feet
|
- baths - beds |
show details | |

|
#26
Robinwood Dr
Clarion, PA 16214
|
1,144 sq. feet
|
- baths - beds |
show details | |

|
#27
Route 949
Sigel, PA 15860
|
1,008 sq. feet
|
- baths - beds |
show details | |

|
#28
Mays Rd
Clarion, PA 16214
|
675 sq. feet
|
- baths - beds |
show details | |

|
#29
Route 28 N
Brookville, PA 15825
|
618 sq. feet
|
- baths - beds |
show details | |

|
#30
Penn St
New Bethlehem, PA 16242
|
560 sq. feet
|
- baths - beds |
show details |
| Photo | Address | Area | Beds / Baths | Price | Details |
|---|---|---|---|---|---|

|
#31
Main St
Hawthorn, PA 16230
|
- sq. feet
|
- baths - beds |
show details | |

|
#32
Marlin St
Brookville, PA 15825
|
- sq. feet
|
- baths - beds |
show details | |

|
#33
Route 36
Brookville, PA 15825
|
624 sq. feet
|
- baths - beds |
show details | |

|
#34
Main St
Rimersburg, PA 16248
|
- sq. feet
|
- baths - beds |
show details | |

|
#35
Elk Run Ave
Punxsutawney, PA 15767
|
- sq. feet
|
- baths - beds |
show details | |

|
Check over 1 million property listings on Foreclosure.com!
|
browse all offers | |||

Latest news about housing in Summerville, PA collected exclusively by city-data.com from local newspapers, TV, and radio stations

 | Is PA "naturally safe" (except for cities and urban areas)? (72 replies) |
| Pittsburgh supply chain crisis in real life (51 replies) |
| Does western PA deserve better passenger rail service (40 replies) |
| Is it time to condemn properties along the river? (47 replies) |
| The Oil City Photo Trip - You can ride shotgun (187 replies) |
| Oil City, Pennsylvania (103 replies) |
Median year apartment built: 1940
Household type by relationship:
Households: 496- Male householders: 83 (37 living alone), Female householders: 83 (17 living alone)
76 spouses (76 opposite-sex spouses), 17 unmarried partners, (17 opposite-sex unmarried partners), 130 children (127 natural, 2 adopted, 0 stepchildren), 0 grandchildren, 9 brothers or sisters, 5 parents, 0 foster children, 1 other relatives, 10 non-relatives
- In group quarters: 73
Size of family households: 53 2-persons, 20 3-persons, 8 4-persons, 14 5-persons, 4 6-persons, 3 7-or-more-persons.
Size of nonfamily households: 57 1-person, 8 2-persons.
53 married couples with children.
23 single-parent households (3 men, 20 women).
99.0% of residents of Summerville speak English at home.
1.2% of residents speak Spanish at home (100% speak English very well).
| Here: | 6.7 |
| State: | 6.8 |
| Here: | 6.1 |
| State: | 4.3 |

- Bedrooms in owner-occupied houses and condos in Summerville, Pennsylvania
- 0no bedroom
- 41 bedroom
- 232 bedrooms
- 723 bedrooms
- 144 bedrooms
- 05+ bedrooms

- Bedrooms in renter-occupied apartments in Summerville, Pennsylvania
- 0no bedroom
- 41 bedroom
- 212 bedrooms
- 193 bedrooms
- 124 bedrooms
- 05+ bedrooms

- Cars and other vehicles available in Summerville in owner-occupied houses/condos
- 6no vehicle
- 411 vehicle
- 362 vehicles
- 323 vehicles
- 04 vehicles
- 05+ vehicles

- Cars and other vehicles available in Summerville in renter-occupied apartments
- 4no vehicle
- 221 vehicle
- 312 vehicles
- 03 vehicles
- 04 vehicles
- 05+ vehicles

- Rooms in owner-occupied houses in Summerville, Pennsylvania
- 01 room
- 02 rooms
- 03 rooms
- 24 rooms
- 155 rooms
- 356 rooms
- 257 rooms
- 228 rooms
- 149+ rooms

- Rooms in renter-occupied apartments in Summerville, Pennsylvania
- 01 room
- 42 rooms
- 03 rooms
- 04 rooms
- 185 rooms
- 106 rooms
- 167 rooms
- 88 rooms
- 09+ rooms


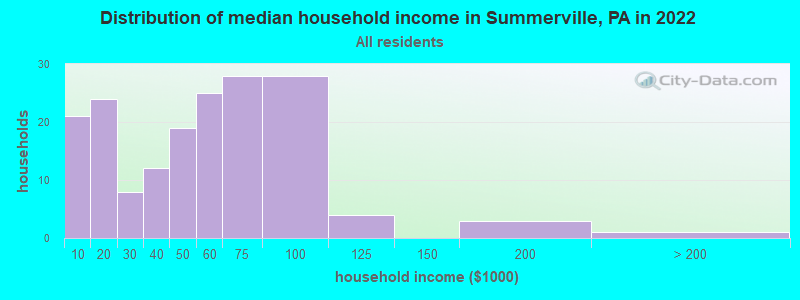
Summerville, PA household income distribution

- 21Less than $10,000
- 24$10,000 to $19,999
- 8$20,000 to $29,999
- 12$30,000 to $39,999
- 19$40,000 to $49,999
- 25$50,000 to $59,999
- 28$60,000 to $74,999
- 28$75,000 to $99,999
- 4$100,000 to $124,999
- 3$150,000 to $199,999
- 1$200,000 or more
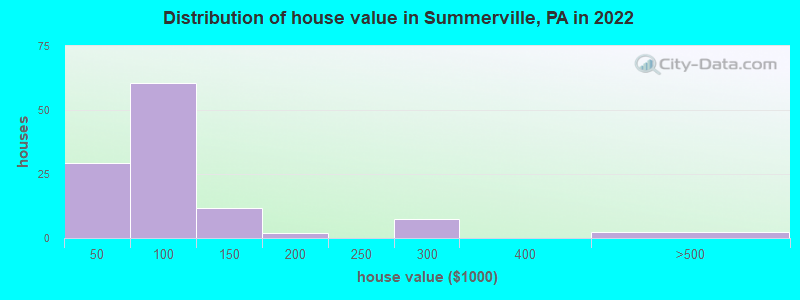
Home value of owner - occupied houses in 2022 in Summerville, PA
-
- 2Less than $10,000
- 2$10,000 to $14,999
- 3$15,000 to $19,999
- 7$25,000 to $29,999
- 2$30,000 to $34,999
- 4$35,000 to $39,999
- 7$40,000 to $49,999
- 11$50,000 to $59,999
- 2$60,000 to $69,999
- 15$70,000 to $79,999
- 18$80,000 to $89,999
- 5$90,000 to $99,999
- 11$100,000 to $124,999
- 1$175,000 to $199,999
- 7$250,000 to $299,999
- 2$400,000 to $499,999
Rent paid by renters in 2022 in Summerville, PA
-
- 5$200 to $249
- 2$250 to $299
- 6$350 to $399
- 2$400 to $449
- 5$450 to $499
- 3$500 to $549
- 5$600 to $649
- 2$650 to $699
- 3$700 to $749
- 6$750 to $799
- 13No cash rent


Percentage of workers working in this county: 65.1%
Number of people working at home: 5 (2.6% of all workers)
Travel time to work (commute)
- Less than 5 minutes: 0
- 5 to 9 minutes: 1
- 10 to 14 minutes: 24
- 15 to 19 minutes: 52
- 20 to 24 minutes: 16
- 25 to 29 minutes: 24
- 30 to 34 minutes: 27
- 35 to 39 minutes: 5
- 40 to 44 minutes: 9
- 45 to 59 minutes: 3
- 60 to 89 minutes: 9
- 90 or more minutes: 8
Means of transportation to work:
- Drove a car alone: 173 (79.7%)
- Carpooled: 34 (15.7%)
- Bus or trolley bus: 2 (0.9%)
- Streetcar or trolley car: 2 (0.9%)
- Walked: 2 (0.9%)
- Worked at home: 4 (1.8%)

- Unemployment by race in 2022
- Unemployment rate for White non-Hispanic residents
- 7.9%Males
- 4.7%Females

- Year of entry for the foreign-born population in Summerville, Pennsylvania
- 01995 to March 2000
- 01990 to 1994
- 01985 to 1989
- 01980 to 1984
- 01975 to 1979
- 01970 to 1974
- 01965 to 1969
- 5Before 1965

First ancestries reported:
- German: 40 (33.4%)
- Irish: 20 (16.7%)
- English: 18 (15.0%)
- Italian: 13 (10.8%)
- American: 5 (4.2%)
- European: 3 (2.5%)
- French: 3 (2.5%)
- Lithuanian: 3 (2.5%)
- Polish: 3 (2.5%)
- Scottish: 2 (1.7%)
- Slovak: 1 (0.8%)
Most common places of birth for foreign-born residents (%):
| Summerville: | 100.0% (5) |
| Pennsylvania: | 6.0% (30,559) |
Place of birth for U.S.-born residents:
- This state: 456
- Other state: 33
- Northeast: 8
- Midwest: 11
- South: 8
- West: 6
92.7% of Summerville residents lived in the same house 1 years ago.
Out of people who lived in different houses, 39.0% lived in this county.
Out of people who lived in different counties, 84.6% lived in Pennsylvania.
| Summerville: | 92.7% |
| State average: | 89.3% |
Education attainment for males 25 years and older:
- No schooling: 5
- Nursery to 4th grade: 0
- 5th and 6th grade: 0
- 7th and 8th grade: 1
- 9th grade: 1
- 10th grade: 8
- 11th grade: 0
- 12th grade, no diploma: 0
- High school graduate (or equivalency): 104
- Less than 1 year of college: 2
- Some college more than 1 year, no degree: 2
- Associate degree: 15
- Bachelor's degree: 10
- Master's degree: 7
- Professional school degree: 0
- Doctorate degree: 0

Education attainment for females 25 years and older:
- No schooling: 0
- Nursery to 4th grade: 0
- 5th and 6th grade: 0
- 7th and 8th grade: 0
- 9th grade: 0
- 10th grade: 0
- 11th grade: 6
- 12th grade, no diploma: 3
- High school graduate (or equivalency): 139
- Less than 1 year of college: 16
- Some college more than 1 year, no degree: 5
- Associate degree: 4
- Bachelor's degree: 39
- Master's degree: 2
- Professional school degree: 0
- Doctorate degree: 0

Housing units in structures:
- One, detached: 177
- Two: 3
- 3 or 4: 6
- 5 to 9: 14
- Mobile homes: 25
Median worth of mobile homes: $73,526
Housing units lacking complete kitchen facilities in 2022: 11.6%
House/condo owner moved in on average 22 years ago
Renter moved in on average 2 years ago

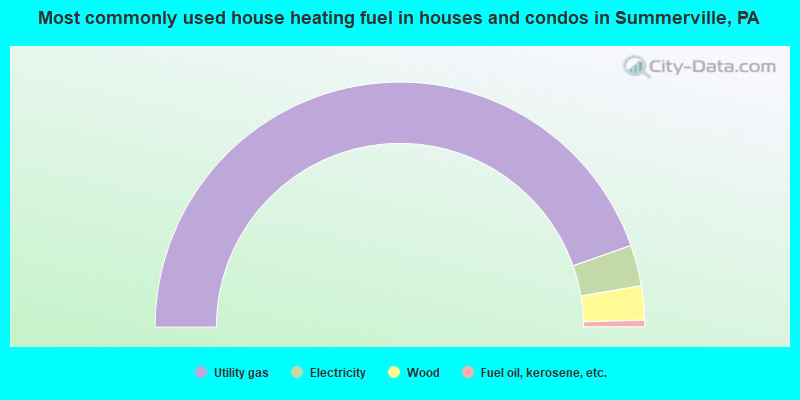
- 89.3%Utility gas
- 5.4%Electricity
- 4.5%Wood
- 0.9%Fuel oil, kerosene, etc.
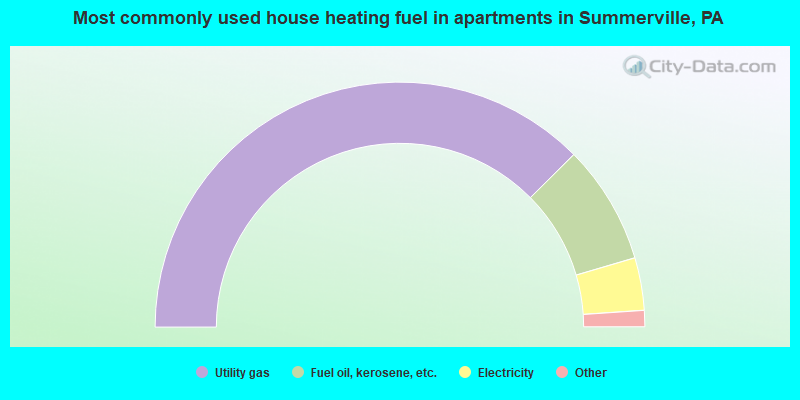
- 76.8%Utility gas
- 16.1%Fuel oil, kerosene, etc.
- 7.1%Electricity
Private vs. public school enrollment:
| Here: | 0.0% |
| Pennsylvania: | 15.7% |
| Here: | 0.0% |
| Pennsylvania: | 13.4% |
| Here: | 0.0% |
| Pennsylvania: | 39.8% |


