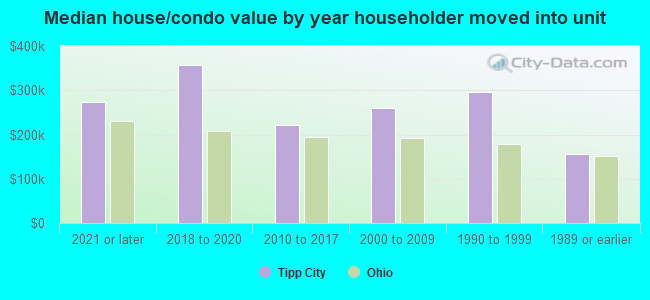
Tipp City, OH (Ohio) Houses and Residents
| Tipp City: | $234,377 |
| Ohio: | $204,100 |
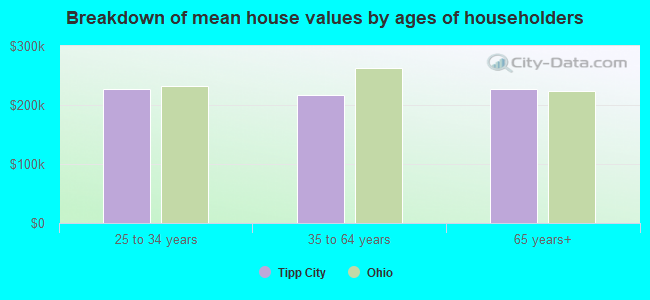
Mean price in 2022:
Detached houses: $274,240
Here: $274,240 State: $254,366 Townhouses or other attached units: $250,917
Here: $250,917 State: $225,733 In 2-unit structures: $129,461
Here: $129,461 State: $144,384
Total population: 9,858 (Urban population: 9,161, Rural population: 114 (42 farm, 72 nonfarm))
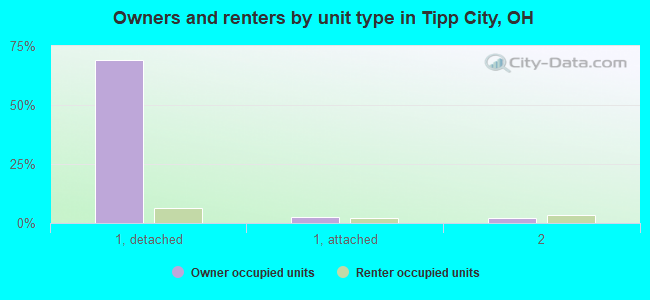
Houses: 4,373 (4,341 occupied: 3,169 owner occupied, 1,299 renter occupied)
| % of renters here: | 29% |
| State: | 33% |
Housing density: 708 houses/condos per square mile
Median price asked for vacant for-sale houses and condos in 2022 in this county: $72,963.
Median contract rent in 2022: $728 (lower quartile is $592, upper quartile is $869)
Median rent asked for vacant for-rent units in 2022: $628
Median gross rent in Tipp City, OH in 2022: $850
Housing units in Tipp City with a mortgage: 1,852 (191 second mortgage, 24 home equity loan, 177 both second mortgage and home equity loan)
Houses without a mortgage: 42
Median household income for houses/condos with a mortgage: $117,106
Median household income for apartments without a mortgage: $72,524
Median monthly housing costs: $912
Compare current foreclosures near Tipp City, OH:
| Photo | Address | Area | Beds / Baths | Price | Details |
|---|---|---|---|---|---|

|
#1
Cedar Grove Dr
Tipp City, OH 45371
|
1,586 sq. feet
|
2 baths 3 beds |
show details | |

|
#2
Amokee Pl
Tipp City, OH 45371
|
1,248 sq. feet
|
2 baths 4 beds |
show details | |

|
#3
Ford Ave
Tipp City, OH 45371
|
1,080 sq. feet
|
1 baths 3 beds |
show details | |

|
#4
N Westedge Dr
Tipp City, OH 45371
|
960 sq. feet
|
1 baths 3 beds |
show details | |

|
#5
Lightner Rd
Tipp City, OH 45371
|
2,028 sq. feet
|
2 baths 3 beds |
show details | |

|
#6
Lightner Rd
Tipp City, OH 45371
|
1,572 sq. feet
|
2 baths 4 beds |
show details | |

|
#7
Mann Rd
Tipp City, OH 45371
|
1,280 sq. feet
|
3 baths 5 beds |
show details | |

|
#8
Old Springfield Rd
Tipp City, OH 45371
|
1,638 sq. feet
|
1 baths 3 beds |
show details | |

|
#9
W Broadway St
Tipp City, OH 45371
|
1,592 sq. feet
|
1 baths 3 beds |
show details | |

|
#10
Cobblestone Dr
Tipp City, OH 45371
|
- sq. feet
|
- baths - beds |
show details |
| Photo | Address | Area | Beds / Baths | Price | Details |
|---|---|---|---|---|---|

|
#11
Violet Ln
Tipp City, OH 45371
|
- sq. feet
|
- baths - beds |
show details | |

|
#12
Dayflower Dr
Tipp City, OH 45371
|
- sq. feet
|
- baths - beds |
show details | |

|
#13
E Evanston Rd
Tipp City, OH 45371
|
- sq. feet
|
- baths - beds |
show details | |

|
#14
Bulrush St
Tipp City, OH 45371
|
- sq. feet
|
- baths - beds |
show details | |

|
#15
W Walnut St
Tipp City, OH 45371
|
- sq. feet
|
- baths - beds |
show details | |

|
#16
River Birch St
Tipp City, OH 45371
|
- sq. feet
|
- baths - beds |
show details | |

|
#17
Wind Ridge Pl Apt 9
Tipp City, OH 45371
|
- sq. feet
|
- baths - beds |
show details | |

|
#18
Coneflower Dr
Tipp City, OH 45371
|
- sq. feet
|
- baths - beds |
show details | |

|
#19
Cedar Grove Drive
Tipp City, OH 45371
|
- sq. feet
|
- baths - beds |
show details | |

|
#20
River Birch St
Tipp City, OH 45371
|
- sq. feet
|
- baths - beds |
show details |
| Photo | Address | Area | Beds / Baths | Price | Details |
|---|---|---|---|---|---|

|
#21
Rolling Acres Dr
Tipp City, OH 45371
|
- sq. feet
|
- baths - beds |
show details | |

|
#22
Ginghamsburg Frederick Rd
Tipp City, OH 45371
|
- sq. feet
|
- baths - beds |
show details | |

|
#23
Blackford Way
Tipp City, OH 45371
|
- sq. feet
|
- baths - beds |
show details | |

|
#24
Bowman Ave
Tipp City, OH 45371
|
- sq. feet
|
- baths - beds |
show details | |

|
#25
Coneflower Dr
Tipp City, OH 45371
|
- sq. feet
|
- baths - beds |
show details | |

|
#26
Troy Frederick Rd
Tipp City, OH 45371
|
- sq. feet
|
- baths - beds |
show details | |

|
#27
Sequoia Ct Apt B
Tipp City, OH 45371
|
- sq. feet
|
- baths - beds |
show details | |

|
#28
Catalpa Dr
Tipp City, OH 45371
|
- sq. feet
|
- baths - beds |
show details | |

|
#29
N 3rd St
Tipp City, OH 45371
|
- sq. feet
|
- baths - beds |
show details | |

|
#30
Carlisle Ave
Dayton, OH 45420
|
1,615 sq. feet
|
1 baths 3 beds |
$204,500
|
show details |
| Photo | Address | Area | Beds / Baths | Price | Details |
|---|---|---|---|---|---|

|
#31
Sparks St
Dayton, OH 45426
|
1,100 sq. feet
|
1 baths 3 beds |
$159,900
|
show details |

|
#32
Arlene Ave
Dayton, OH 45406
|
1,044 sq. feet
|
1 baths 3 beds |
$42,500
|
show details |

|
#33
S Market St
Troy, OH 45373
|
3,620 sq. feet
|
2 baths 5 beds |
$168,500
|
show details |

|
#34
N Jay St
West Milton, OH 45383
|
950 sq. feet
|
1 baths 3 beds |
$187,500
|
show details |

|
#35
Old Salem Rd
Englewood, OH 45322
|
2,458 sq. feet
|
2 baths 4 beds |
$334,900
|
show details |

|
#36
813 Ferndale Ave
Dayton, OH 45406
|
- sq. feet
|
2 baths 6 beds |
$103,950
|
show details |

|
#37
Hawker St
Dayton, OH 45410
|
- sq. feet
|
3 baths 3 beds |
$31,500
|
show details |

|
#38
Gardendale Ave
Dayton, OH 45417
|
960 sq. feet
|
1 baths 4 beds |
show details | |

|
#39
Mahler Dr
Dayton, OH 45424
|
1,404 sq. feet
|
2 baths 3 beds |
show details | |

|
#40
Noranda Dr
Dayton, OH 45415
|
1,857 sq. feet
|
3 baths 5 beds |
show details |
| Photo | Address | Area | Beds / Baths | Price | Details |
|---|---|---|---|---|---|

|
#41
Burleigh Ave
Dayton, OH 45417
|
1,500 sq. feet
|
2 baths 4 beds |
show details | |

|
#42
Pocono Dr
Dayton, OH 45424
|
1,540 sq. feet
|
2 baths 4 beds |
show details | |

|
#43
Mozart Ave
Dayton, OH 45424
|
1,080 sq. feet
|
2 baths 3 beds |
show details | |

|
#44
Mound St
Dayton, OH 45402
|
1,726 sq. feet
|
2 baths 4 beds |
show details | |

|
#45
Shannon St
Dayton, OH 45402
|
1,078 sq. feet
|
1 baths 2 beds |
show details | |

|
#46
Glendale Dr
Fairborn, OH 45324
|
1,860 sq. feet
|
3 baths 4 beds |
show details | |

|
#47
Burgess Ave
Dayton, OH 45415
|
1,160 sq. feet
|
2 baths 3 beds |
show details | |

|
#48
Naughton Dr
Dayton, OH 45424
|
1,080 sq. feet
|
2 baths 3 beds |
show details | |

|
#49
Mozart Ave
Dayton, OH 45424
|
1,080 sq. feet
|
2 baths 3 beds |
show details | |

|
Check over 1 million property listings on Foreclosure.com!
|
browse all offers | |||


 | Military first home buyer: Can you rent a $300K home? (12 replies) |
| Suggest Apartment communities in Dayton for rental (work location will be Sidney) (16 replies) |
| Home Buying Stats Clayton\Englewood (24 replies) |
| Renting single family home around Dayton (11 replies) |
| Moving to Vandalia, any recommendations for apartments? (6 replies) |
| Home Building in the Cincy/Dayton Area (74 replies) |

Median year apartment built: 1979
Household type by relationship:
Households: 10,400- Male householders: 2,245 (612 living alone), Female householders: 2,110 (709 living alone)
2,397 spouses (2,338 opposite-sex spouses), 194 unmarried partners, (174 opposite-sex unmarried partners), 3,155 children (2,993 natural, 148 adopted, 13 stepchildren), 47 grandchildren, 39 brothers or sisters, 55 parents, 0 foster children, 42 other relatives, 1 non-relatives
- In group quarters: 111
Size of family households: 1,573 2-persons, 547 3-persons, 561 4-persons, 259 5-persons, 81 6-persons.
Size of nonfamily households: 1,304 1-person, 90 2-persons.
1,687 married couples with children.
440 single-parent households (109 men, 331 women).
97.9% of residents of Tipp City speak English at home.
0.3% of residents speak Spanish at home (100% speak English very well).
0.3% of residents speak other Indo-European language at home (79% speak English very well, 21% speak English not well).
1.1% of residents speak Asian or Pacific Island language at home (76% speak English very well, 24% speak English well).
0.1% of residents speak other language at home (100% speak English very well).
Foreign born population: 124 (1.2%)
(65.3% of them are naturalized citizens)
| Here: | 6.8 |
| State: | 6.7 |
| Here: | 4.0 |
| State: | 4.4 |
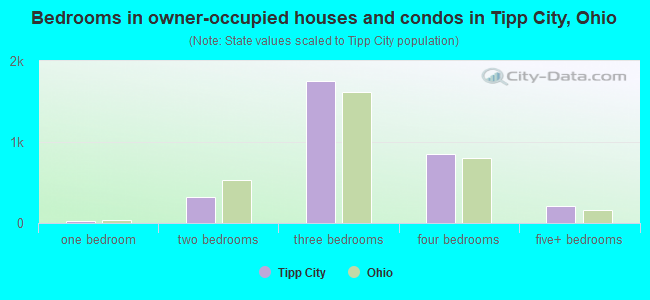
- Bedrooms in owner-occupied houses and condos in Tipp City, Ohio
- 0no bedroom
- 291 bedroom
- 3212 bedrooms
- 1,7503 bedrooms
- 8524 bedrooms
- 2165+ bedrooms
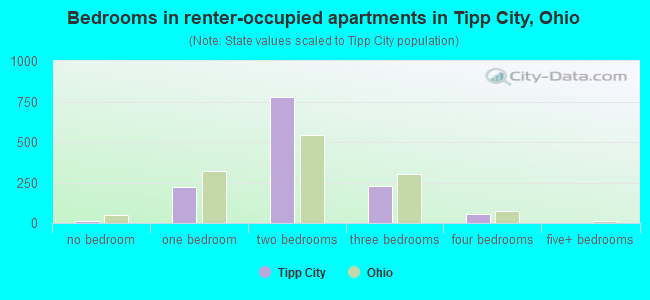
- Bedrooms in renter-occupied apartments in Tipp City, Ohio
- 15no bedroom
- 2231 bedroom
- 7752 bedrooms
- 2283 bedrooms
- 584 bedrooms
- 05+ bedrooms
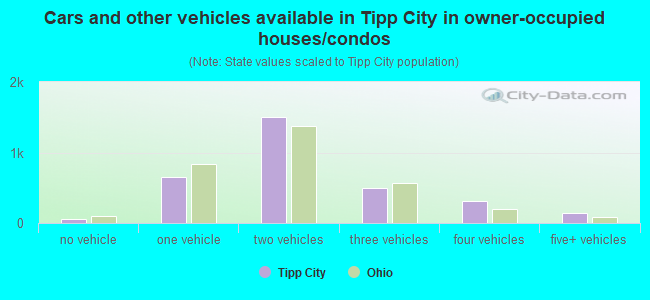
- Cars and other vehicles available in Tipp City in owner-occupied houses/condos
- 60no vehicle
- 6461 vehicle
- 1,5032 vehicles
- 5033 vehicles
- 3154 vehicles
- 1415+ vehicles
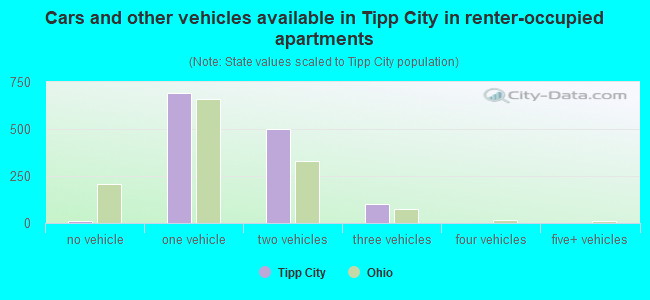
- Cars and other vehicles available in Tipp City in renter-occupied apartments
- 9no vehicle
- 6911 vehicle
- 5002 vehicles
- 993 vehicles
- 04 vehicles
- 05+ vehicles
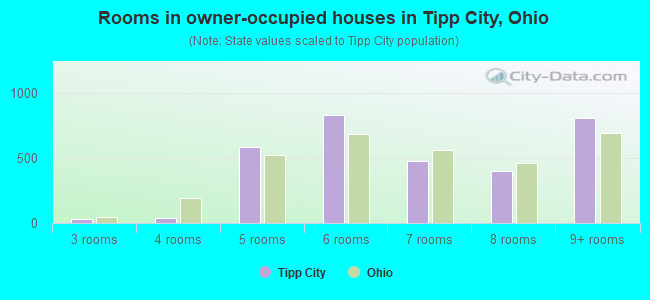
- Rooms in owner-occupied houses in Tipp City, Ohio
- 01 room
- 02 rooms
- 283 rooms
- 384 rooms
- 5875 rooms
- 8326 rooms
- 4767 rooms
- 4028 rooms
- 8069+ rooms
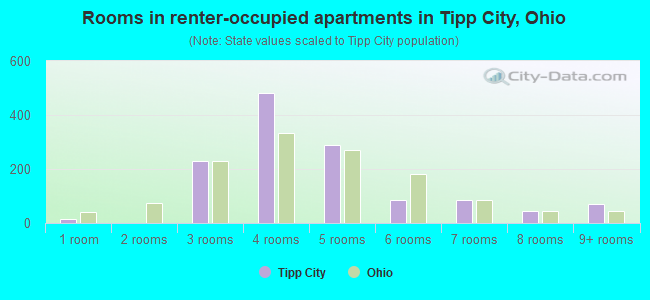
- Rooms in renter-occupied apartments in Tipp City, Ohio
- 151 room
- 02 rooms
- 2283 rooms
- 4834 rooms
- 2905 rooms
- 866 rooms
- 867 rooms
- 438 rooms
- 699+ rooms
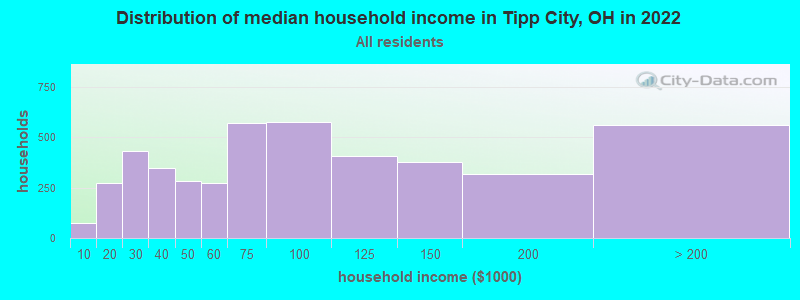
Tipp City, OH household income distribution

- 74Less than $10,000
- 273$10,000 to $19,999
- 431$20,000 to $29,999
- 349$30,000 to $39,999
- 281$40,000 to $49,999
- 275$50,000 to $59,999
- 569$60,000 to $74,999
- 575$75,000 to $99,999
- 407$100,000 to $124,999
- 376$125,000 to $149,999
- 316$150,000 to $199,999
- 562$200,000 or more
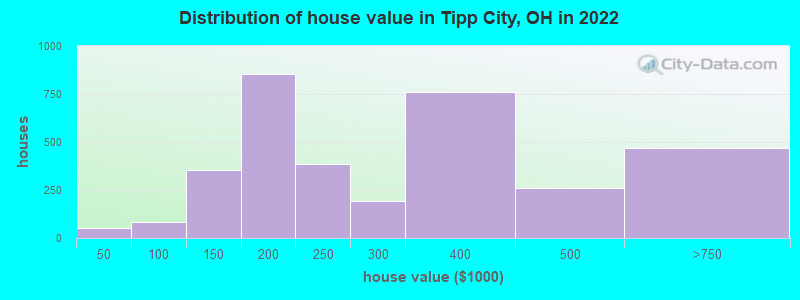
Home value of owner - occupied houses in 2022 in Tipp City, OH
-
- 5$10,000 to $14,999
- 28$20,000 to $24,999
- 5$25,000 to $29,999
- 14$40,000 to $49,999
- 28$80,000 to $89,999
- 40$90,000 to $99,999
- 139$100,000 to $124,999
- 211$125,000 to $149,999
- 614$150,000 to $174,999
- 237$175,000 to $199,999
- 385$200,000 to $249,999
- 190$250,000 to $299,999
- 760$300,000 to $399,999
- 259$400,000 to $499,999
- 456$500,000 to $749,999
- 12$1,500,000 to $1,999,999
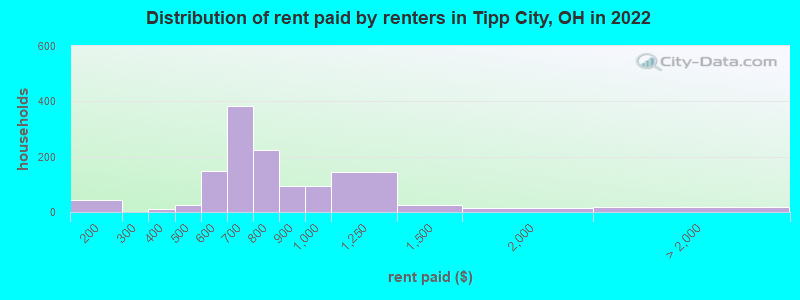
Rent paid by renters in 2022 in Tipp City, OH
-
- 44$100 to $149
- 11$300 to $349
- 14$400 to $449
- 11$450 to $499
- 36$500 to $549
- 110$550 to $599
- 323$600 to $649
- 58$650 to $699
- 60$700 to $749
- 163$750 to $799
- 94$800 to $899
- 95$900 to $999
- 145$1,000 to $1,249
- 23$1,250 to $1,499
- 15$1,500 to $1,999
- 17No cash rent
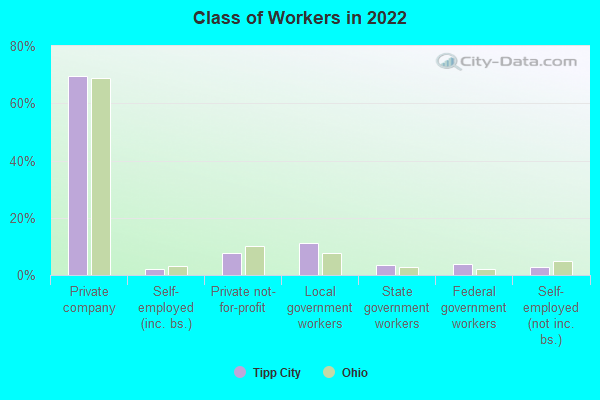
Percentage of workers working in this county: 49.1%
Number of people working at home: 490 (9.0% of all workers)
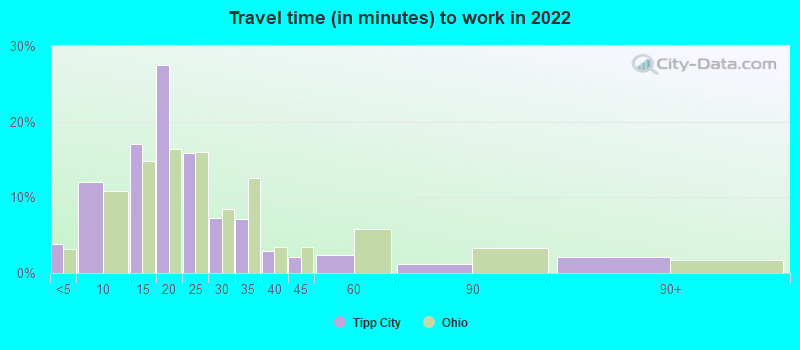
Travel time to work (commute)
- Less than 5 minutes: 157
- 5 to 9 minutes: 729
- 10 to 14 minutes: 1,038
- 15 to 19 minutes: 740
- 20 to 24 minutes: 818
- 25 to 29 minutes: 385
- 30 to 34 minutes: 478
- 35 to 39 minutes: 154
- 40 to 44 minutes: 136
- 45 to 59 minutes: 158
- 60 to 89 minutes: 98
- 90 or more minutes: 79
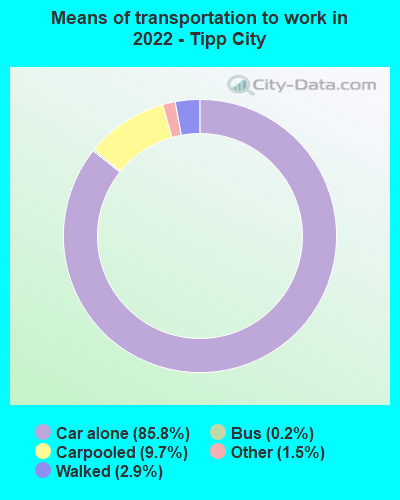
Means of transportation to work:
- Drove a car alone: 5,649 (77.9%)
- Carpooled: 684 (9.4%)
- Bus: 11 (0.2%)
- Taxi: 116 (1.6%)
- Walked: 193 (2.7%)
- Worked at home: 490 (6.8%)
- Unemployment by race in 2022
- Unemployment rate for White non-Hispanic residents
- 0.8%Males
- 0.7%Females
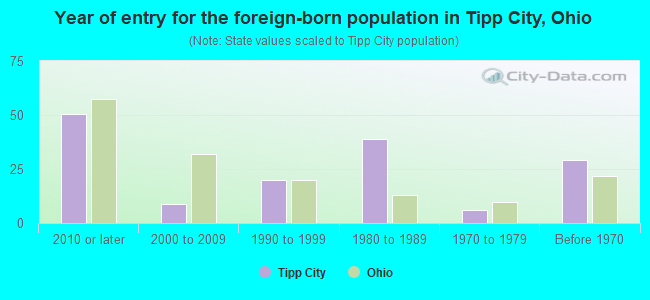
- Year of entry for the foreign-born population in Tipp City, Ohio
- 502010 or later
- 92000 to 2009
- 201990 to 1999
- 391980 to 1989
- 61970 to 1979
- 29Before 1970
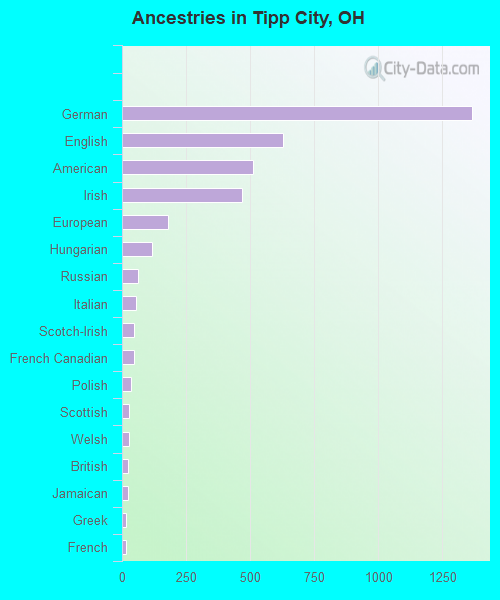
First ancestries reported:
- German: 1,365 (33.1%)
- English: 628 (15.2%)
- American: 512 (12.4%)
- Irish: 469 (11.4%)
- European: 180 (4.4%)
- Hungarian: 116 (2.8%)
- Russian: 63 (1.5%)
- Italian: 55 (1.3%)
- Scotch-Irish: 48 (1.2%)
- French Canadian: 47 (1.1%)
- Polish: 34 (0.8%)
- Scottish: 26 (0.6%)
- Welsh: 26 (0.6%)
- British: 24 (0.6%)
- Jamaican: 22 (0.5%)
- Greek: 16 (0.4%)
- French: 15 (0.4%)
- Czech: 12 (0.3%)
- Scandinavian: 11 (0.3%)
- Swedish: 8 (0.2%)
- Canadian: 7 (0.2%)
- Northern European: 7 (0.2%)
- Slovak: 5 (0.1%)
Most common places of birth for foreign-born residents (%):
| Tipp City: | 23.7% (33) |
| Ohio: | 1.4% (8,101) |
| Tipp City: | 19.4% (27) |
| Ohio: | 0.7% (4,187) |
| Tipp City: | 15.8% (22) |
| Ohio: | 2.0% (11,398) |
| Tipp City: | 8.6% (12) |
| Ohio: | 0.4% (2,071) |
| Tipp City: | 7.9% (11) |
| Ohio: | 0.5% (3,042) |
| Tipp City: | 6.5% (9) |
| Ohio: | 2.6% (14,988) |
| Tipp City: | 5.0% (7) |
| Ohio: | 0.9% (5,422) |
| Tipp City: | 5.0% (7) |
| Ohio: | 0.7% (3,920) |
| Tipp City: | 2.9% (4) |
| Ohio: | 6.2% (35,703) |
| Tipp City: | 2.2% (3) |
| Ohio: | 2.2% (12,846) |
Place of birth for U.S.-born residents:
- This state: 8,121
- Other state: 2,115
- Northeast: 508
- Midwest: 524
- South: 590
- West: 532
87.8% of Tipp City residents lived in the same house 1 years ago.
Out of people who lived in different houses, 29.6% lived in this county.
Out of people who lived in different counties, 67.4% lived in Ohio.
| Tipp City: | 87.8% |
| State average: | 87.8% |
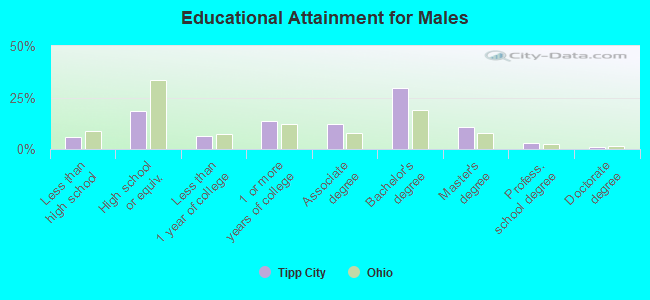
Education attainment for males 25 years and older:
- No schooling: 13
- Nursery to 4th grade: 0
- 5th and 6th grade: 0
- 7th and 8th grade: 18
- 9th grade: 3
- 10th grade: 13
- 11th grade: 132
- 12th grade, no diploma: 50
- High school graduate (or equivalency): 700
- Less than 1 year of college: 235
- Some college more than 1 year, no degree: 526
- Associate degree: 463
- Bachelor's degree: 1,135
- Master's degree: 419
- Professional school degree: 105
- Doctorate degree: 28
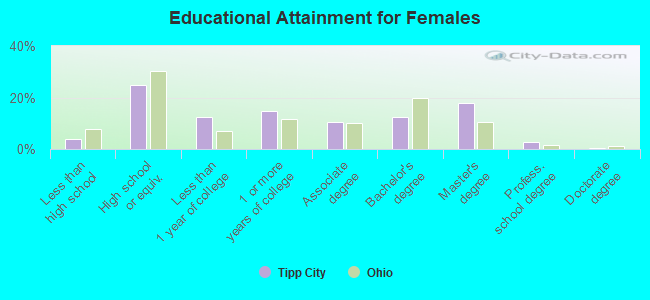
Education attainment for females 25 years and older:
- No schooling: 36
- Nursery to 4th grade: 0
- 5th and 6th grade: 0
- 7th and 8th grade: 0
- 9th grade: 0
- 10th grade: 30
- 11th grade: 81
- 12th grade, no diploma: 0
- High school graduate (or equivalency): 926
- Less than 1 year of college: 457
- Some college more than 1 year, no degree: 554
- Associate degree: 389
- Bachelor's degree: 465
- Master's degree: 661
- Professional school degree: 94
- Doctorate degree: 14


Housing units in structures:
- One, detached: 3,245
- One, attached: 257
- Two: 178
- 3 or 4: 312
- 5 to 9: 200
- 10 to 19: 140
- 20 to 49: 11
- 50 or more: 26
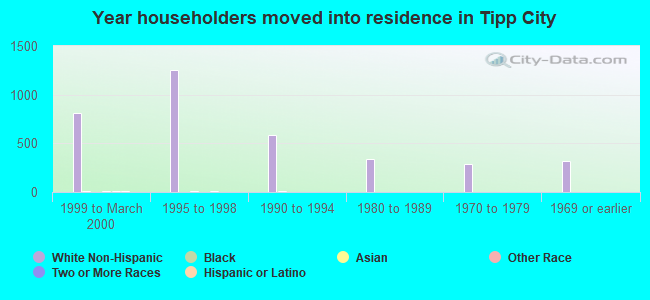
House/condo owner moved in on average 11 years ago
Renter moved in on average 3 years ago
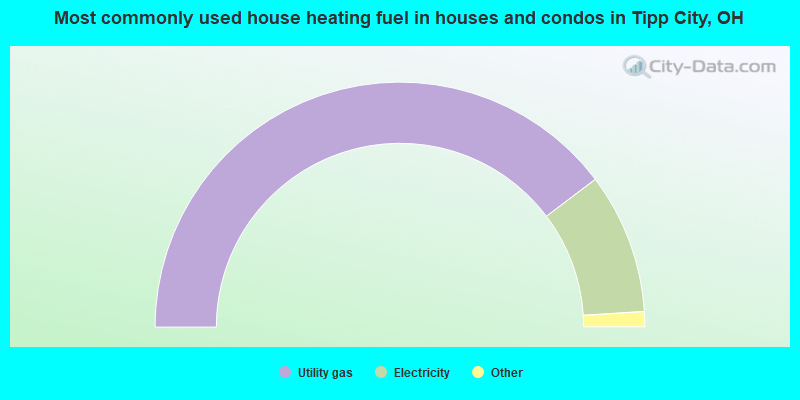
- 79.5%Utility gas
- 18.6%Electricity
- 1.4%Bottled, tank, or LP gas
- 0.4%Other fuel
- 0.2%Fuel oil, kerosene, etc.
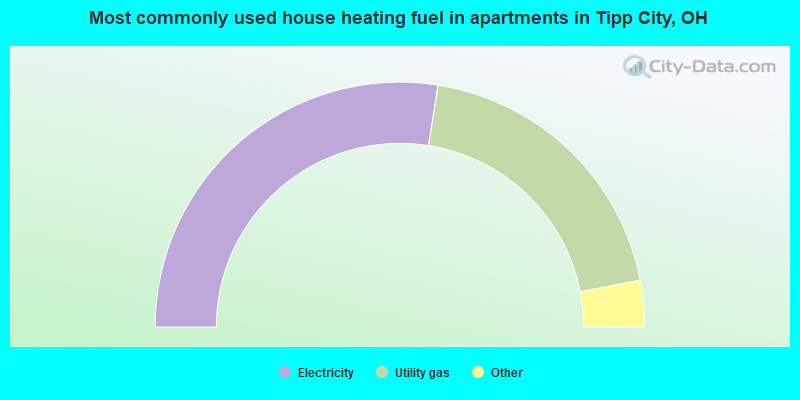
- 55.0%Electricity
- 38.9%Utility gas
- 3.9%No fuel used
- 1.1%Other fuel
- 1.0%Bottled, tank, or LP gas
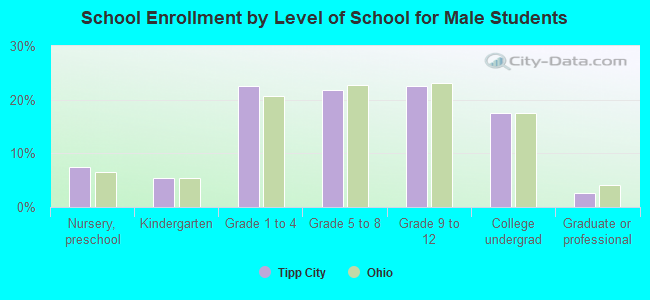
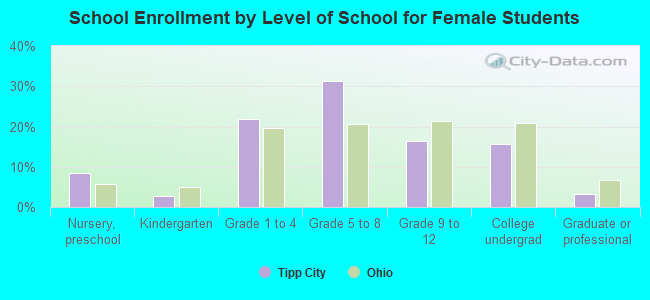
Private vs. public school enrollment:
| Here: | 5.2% |
| Ohio: | 16.0% |
| Here: | 6.8% |
| Ohio: | 13.1% |
| Here: | 13.4% |
| Ohio: | 22.3% |