Wildwood, MO (Missouri) Houses and Residents
| Wildwood: | $476,779 |
| Missouri: | $221,200 |
Total population: 35,820 (Urban population: 26,635, Rural population: 6,810 (18 farm, 6,792 nonfarm))
Houses: 13,255 (12,870 occupied: 11,757 owner occupied, 1,084 renter occupied)
| % of renters here: | 8% |
| State: | 32% |
Housing density: 201 houses/condos per square mile
Median price asked for vacant for-sale houses and condos in 2022: $256,487.
Median contract rent in 2022: $1,298 (lower quartile is $1,074, upper quartile is $1,739)
Median rent asked for vacant for-rent units in 2022: $1,767
Median gross rent in Wildwood, MO in 2022: $1,440
Housing units in Wildwood with a mortgage: 8,144 (975 second mortgage, 10 home equity loan, 854 both second mortgage and home equity loan)
Houses without a mortgage: 363
Median household income for houses/condos with a mortgage: $168,371
Median household income for apartments without a mortgage: $118,123
Median monthly housing costs: $1,935
Compare current foreclosures near Wildwood, MO:
| Photo | Address | Area | Beds / Baths | Price | Details |
|---|---|---|---|---|---|

|
#1
Mallet Hl
Ballwin, MO 63021
|
4,530 sq. feet
|
4 baths 5 beds |
$649,900
|
show details |

|
#2
Ross Ave
Saint Louis, MO 63146
|
1,520 sq. feet
|
2 baths 3 beds |
$218,400
|
show details |

|
#3
Old State Route 21
Imperial, MO 63052
|
1,763 sq. feet
|
2 baths 3 beds |
$144,900
|
show details |

|
#4
Connor Rd
House Springs, MO 63051
|
1,076 sq. feet
|
2 baths 3 beds |
$227,000
|
show details |

|
#5
Eastbrook Dr
Saint Louis, MO 63114
|
816 sq. feet
|
1 baths 2 beds |
show details | |

|
#6
Cumberland Lndg
Saint Charles, MO 63303
|
2,387 sq. feet
|
3 baths 3 beds |
show details | |

|
#7
Winthrop Ct
Saint Louis, MO 63123
|
1,320 sq. feet
|
1 baths 3 beds |
show details | |

|
#8
Redcoat Dr
Maryland Heights, MO 63043
|
1,478 sq. feet
|
2 baths 4 beds |
show details | |

|
#9
Eulalie Ave
Saint Louis, MO 63144
|
1,264 sq. feet
|
2 baths 2 beds |
show details | |

|
#10
Arbor Green Dr
Saint Charles, MO 63304
|
2,165 sq. feet
|
2 baths 4 beds |
show details |
| Photo | Address | Area | Beds / Baths | Price | Details |
|---|---|---|---|---|---|

|
#11
Mars Ln
Maryland Heights, MO 63043
|
1,260 sq. feet
|
1 baths 3 beds |
show details | |

|
#12
W Hawthorne St
Pacific, MO 63069
|
1,292 sq. feet
|
1 baths 3 beds |
show details | |

|
#13
Butler Dr
Eureka, MO 63025
|
966 sq. feet
|
1 baths 3 beds |
show details | |

|
#14
Warm Winds Dr
O Fallon, MO 63366
|
1,663 sq. feet
|
2 baths 3 beds |
show details | |

|
#15
Orchid Blossom Ct
Saint Peters, MO 63376
|
- sq. feet
|
2 baths 3 beds |
show details | |

|
#16
Woodrun Dr
Ballwin, MO 63021
|
1,310 sq. feet
|
3 baths 3 beds |
show details | |

|
#17
Pine Bend Dr
Chesterfield, MO 63005
|
3,770 sq. feet
|
5 baths 4 beds |
show details | |

|
#18
Pine Bend Dr
Chesterfield, MO 63005
|
4,770 sq. feet
|
4 baths 4 beds |
show details | |

|
#19
Roanoke Dr
Saint Charles, MO 63304
|
2,526 sq. feet
|
2 baths 4 beds |
show details | |

|
#20
Center Dr
High Ridge, MO 63049
|
912 sq. feet
|
2 baths 3 beds |
show details |
| Photo | Address | Area | Beds / Baths | Price | Details |
|---|---|---|---|---|---|

|
#21
Taylor Ave
Bridgeton, MO 63044
|
2,252 sq. feet
|
3 baths 4 beds |
show details | |

|
#22
Dover Trace Dr
Fenton, MO 63026
|
4,046 sq. feet
|
4 baths 4 beds |
show details | |

|
#23
Jacobs Crossing Dr
Saint Charles, MO 63304
|
2,413 sq. feet
|
3 baths 4 beds |
show details | |

|
#24
Barrett Station Rd
Saint Louis, MO 63122
|
1,974 sq. feet
|
2 baths 3 beds |
show details | |

|
#25
Lynnbrook Dr
Saint Charles, MO 63303
|
1,260 sq. feet
|
3 baths 3 beds |
show details | |

|
#26
W Woodbine Ave
Saint Louis, MO 63122
|
- sq. feet
|
1 baths 1 beds |
show details | |

|
#27
Belleau Lake Dr
O Fallon, MO 63366
|
1,508 sq. feet
|
2 baths 3 beds |
show details | |

|
#28
Burgan Grove Rd
House Springs, MO 63051
|
2,355 sq. feet
|
3 baths 3 beds |
show details | |

|
#29
Cambridge Rd
High Ridge, MO 63049
|
1,040 sq. feet
|
1 baths 3 beds |
show details | |

|
#30
Big Bend Rd
Ballwin, MO 63021
|
1,594 sq. feet
|
2 baths 4 beds |
show details |
| Photo | Address | Area | Beds / Baths | Price | Details |
|---|---|---|---|---|---|

|
#31
Green Valley Dr
Saint Peters, MO 63376
|
800 sq. feet
|
1 baths 2 beds |
show details | |

|
#32
Sundale Ct
Eureka, MO 63025
|
2,604 sq. feet
|
3 baths 4 beds |
show details | |

|
#33
Bremerton Rd
Saint Louis, MO 63144
|
875 sq. feet
|
1 baths 3 beds |
show details | |

|
#34
Driver Ave
Saint Louis, MO 63114
|
1,328 sq. feet
|
2 baths 3 beds |
show details | |

|
#35
Mendoza Dr
Saint Peters, MO 63376
|
1,300 sq. feet
|
2 baths 3 beds |
show details | |

|
#36
Jody Dr
Saint Peters, MO 63376
|
1,528 sq. feet
|
2 baths 3 beds |
show details | |

|
#37
Meadowgate Ct
Saint Peters, MO 63376
|
1,781 sq. feet
|
2 baths 3 beds |
show details | |

|
#38
Lemonwood Dr
Saint Peters, MO 63376
|
1,344 sq. feet
|
2 baths 3 beds |
show details | |

|
#39
Barkwood Trails Dr
Saint Peters, MO 63376
|
1,013 sq. feet
|
1 baths 3 beds |
show details | |

|
#40
Crockett Dr
Saint Louis, MO 63132
|
1,419 sq. feet
|
2 baths 3 beds |
show details |
| Photo | Address | Area | Beds / Baths | Price | Details |
|---|---|---|---|---|---|

|
#41
Redbluff Ct
Saint Louis, MO 63146
|
1,742 sq. feet
|
2 baths 3 beds |
show details | |

|
#42
Pralle Ln
Saint Charles, MO 63303
|
1,392 sq. feet
|
2 baths 3 beds |
show details | |

|
#43
Red Cedar Parc Dr
O Fallon, MO 63368
|
1,092 sq. feet
|
2 baths 3 beds |
show details | |

|
#44
Meadowgate Ct
Saint Peters, MO 63376
|
2,630 sq. feet
|
2 baths 4 beds |
show details | |

|
#45
Hawk Run Dr
O Fallon, MO 63368
|
1,713 sq. feet
|
2 baths 2 beds |
show details | |

|
#46
Drayton Ave
Saint Louis, MO 63119
|
1,059 sq. feet
|
1 baths 3 beds |
show details | |

|
#47
N Lang Dr
O Fallon, MO 63366
|
1,026 sq. feet
|
2 baths 3 beds |
show details | |

|
#48
Overview Ct
Saint Louis, MO 63128
|
1,764 sq. feet
|
2 baths 3 beds |
show details | |

|
#49
Black Willow Ct
Saint Charles, MO 63303
|
1,085 sq. feet
|
2 baths 3 beds |
show details | |

|
Check over 1 million property listings on Foreclosure.com!
|
browse all offers | |||

Latest news about housing in Wildwood, MO collected exclusively by city-data.com from local newspapers, TV, and radio stations

 | Where to buy a home STL County Low Taxes Good Schools (2 replies) |
| Wildwood or chesterfield (18 replies) |
| Definitions of Mid, South, North, and West St. Louis County? (42 replies) |
| How is the home market here (Stl County)? (6 replies) |
| Where is a good place to live outside STL county within 45 minute commute to Maplewood? (6 replies) |
| Asians moving to STL (42 replies) |
Median year apartment built: 1992
Household type by relationship:
Households: 34,948- Male householders: 7,300 (909 living alone), Female householders: 5,421 (918 living alone)
9,168 spouses (9,114 opposite-sex spouses), 495 unmarried partners, (481 opposite-sex unmarried partners), 11,339 children (10,562 natural, 329 adopted, 446 stepchildren), 277 grandchildren, 85 brothers or sisters, 263 parents, 0 foster children, 319 other relatives, 192 non-relatives
- In group quarters: 86
Size of family households: 4,930 2-persons, 2,455 3-persons, 1,745 4-persons, 1,080 5-persons, 352 6-persons, 98 7-or-more-persons.
Size of nonfamily households: 1,808 1-person, 370 2-persons, 35 3-persons, 9 4-persons.
6,927 married couples with children.
929 single-parent households (192 men, 737 women).
90.5% of residents of Wildwood speak English at home.
2.1% of residents speak Spanish at home (72% speak English very well, 19% speak English well, 8% speak English not well).
3.7% of residents speak other Indo-European language at home (87% speak English very well, 8% speak English well, 5% speak English not well).
3.3% of residents speak Asian or Pacific Island language at home (76% speak English very well, 20% speak English well, 4% speak English not well, 1% don't speak English at all).
0.3% of residents speak other language at home (84% speak English very well, 16% speak English well).
Foreign born population: 2,914 (8.3%)
(69.0% of them are naturalized citizens)
| Here: | 10.0 |
| State: | 6.4 |
| Here: | 4.5 |
| State: | 4.4 |

- Bedrooms in owner-occupied houses and condos in Wildwood, Missouri
- 10no bedroom
- 431 bedroom
- 6032 bedrooms
- 3,1443 bedrooms
- 6,1134 bedrooms
- 1,8445+ bedrooms

- Bedrooms in renter-occupied apartments in Wildwood, Missouri
- 9no bedroom
- 1071 bedroom
- 5512 bedrooms
- 2643 bedrooms
- 864 bedrooms
- 675+ bedrooms

- Cars and other vehicles available in Wildwood in owner-occupied houses/condos
- 85no vehicle
- 1,4841 vehicle
- 5,8412 vehicles
- 3,1923 vehicles
- 9314 vehicles
- 2245+ vehicles

- Cars and other vehicles available in Wildwood in renter-occupied apartments
- 54no vehicle
- 4541 vehicle
- 4452 vehicles
- 1223 vehicles
- 04 vehicles
- 95+ vehicles

- Rooms in owner-occupied houses in Wildwood, Missouri
- 01 room
- 112 rooms
- 753 rooms
- 2464 rooms
- 5525 rooms
- 1,2646 rooms
- 1,3817 rooms
- 2,2648 rooms
- 5,9649+ rooms

- Rooms in renter-occupied apartments in Wildwood, Missouri
- 91 room
- 102 rooms
- 1423 rooms
- 3874 rooms
- 1615 rooms
- 526 rooms
- 1147 rooms
- 658 rooms
- 1449+ rooms


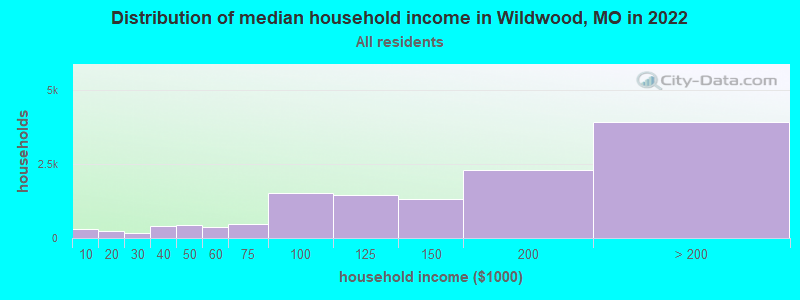
Wildwood, MO household income distribution

- 309Less than $10,000
- 232$10,000 to $19,999
- 155$20,000 to $29,999
- 395$30,000 to $39,999
- 436$40,000 to $49,999
- 386$50,000 to $59,999
- 482$60,000 to $74,999
- 1,516$75,000 to $99,999
- 1,442$100,000 to $124,999
- 1,307$125,000 to $149,999
- 2,287$150,000 to $199,999
- 3,911$200,000 or more
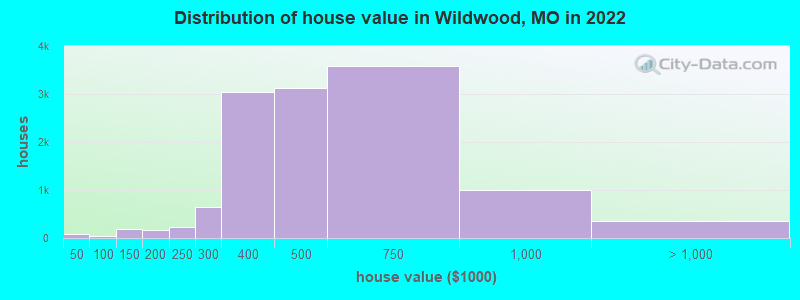
Home value of owner - occupied houses in 2022 in Wildwood, MO
-
- 67Less than $10,000
- 11$40,000 to $49,999
- 14$70,000 to $79,999
- 12$80,000 to $89,999
- 103$100,000 to $124,999
- 93$125,000 to $149,999
- 44$150,000 to $174,999
- 114$175,000 to $199,999
- 224$200,000 to $249,999
- 653$250,000 to $299,999
- 3,038$300,000 to $399,999
- 3,125$400,000 to $499,999
- 3,584$500,000 to $749,999
- 1,010$750,000 to $999,999
- 154$1,000,000 to $1,499,999
- 97$1,500,000 to $1,999,999
- 111$2,000,000 or more
Rent paid by renters in 2022 in Wildwood, MO
-
- 6$250 to $299
- 53$500 to $549
- 16$700 to $749
- 9$800 to $899
- 88$900 to $999
- 441$1,000 to $1,249
- 248$1,250 to $1,499
- 154$1,500 to $1,999
- 88$2,000 to $2,499
- 63$3,000 to $3,499
- 29No cash rent


Percentage of workers working in this county: 84.3%
Number of people working at home: 4,287 (24.6% of all workers)
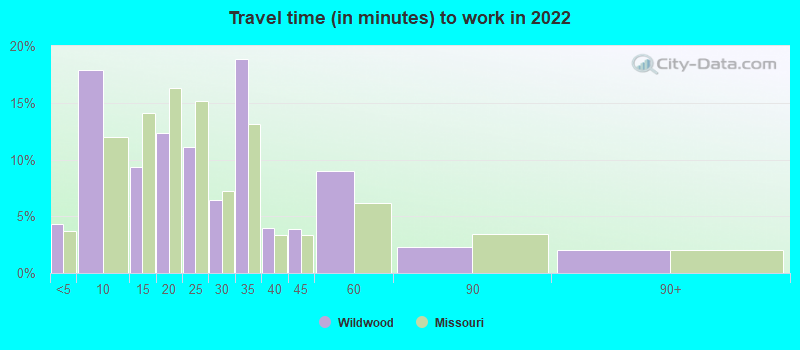
Travel time to work (commute)
- Less than 5 minutes: 302
- 5 to 9 minutes: 1,092
- 10 to 14 minutes: 1,115
- 15 to 19 minutes: 1,624
- 20 to 24 minutes: 1,628
- 25 to 29 minutes: 931
- 30 to 34 minutes: 2,602
- 35 to 39 minutes: 969
- 40 to 44 minutes: 1,033
- 45 to 59 minutes: 1,198
- 60 to 89 minutes: 317
- 90 or more minutes: 289
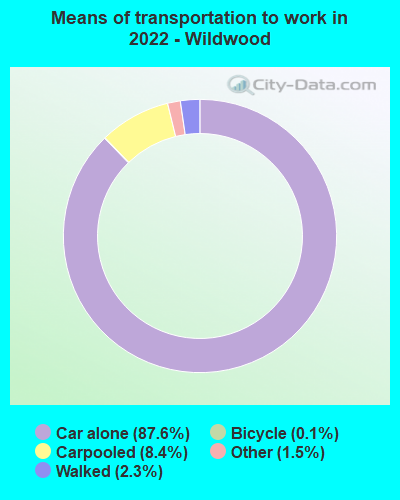
Means of transportation to work:
- Drove a car alone: 4,799 (53.8%)
- Carpooled: 438 (4.9%)
- Taxi: 75 (0.8%)
- Bicycle: 9 (0.1%)
- Walked: 148 (1.7%)
- Worked at home: 4,287 (48.1%)

- Unemployment by race in 2022
- Unemployment rate for White non-Hispanic residents
- 3.1%Males
- 2.0%Females
- Unemployment rate for Asian residents
- 1.8%Males
- 3.9%Females
- Unemployment rate for other race residents
- 3.3%Males
- Unemployment rate for two or more race residents
- 1.6%Females

- Year of entry for the foreign-born population in Wildwood, Missouri
- 6632010 or later
- 6942000 to 2009
- 5511990 to 1999
- 2951980 to 1989
- 2661970 to 1979
- 158Before 1970

First ancestries reported:
- German: 3,516 (23.9%)
- English: 1,646 (11.2%)
- American: 1,406 (9.6%)
- Irish: 1,279 (8.7%)
- European: 937 (6.4%)
- Italian: 850 (5.8%)
- Polish: 270 (1.8%)
- Dutch: 193 (1.3%)
- Scotch-Irish: 148 (1.0%)
- Iranian: 144 (1.0%)
- Scottish: 118 (0.8%)
- Scandinavian: 114 (0.8%)
- French: 101 (0.7%)
- Romanian: 99 (0.7%)
- Eastern European: 96 (0.7%)
- Russian: 87 (0.6%)
- Norwegian: 68 (0.5%)
- Bulgarian: 60 (0.4%)
- Yugoslavian: 58 (0.4%)
- Swedish: 56 (0.4%)
- Greek: 53 (0.4%)
- Ukrainian: 49 (0.3%)
- Egyptian: 37 (0.3%)
- Ethiopian: 36 (0.2%)
- Canadian: 33 (0.2%)
- Swiss: 31 (0.2%)
- Haitian: 30 (0.2%)
- Danish: 29 (0.2%)
- African: 29 (0.2%)
- British: 27 (0.2%)
- Czech: 26 (0.2%)
- Portuguese: 26 (0.2%)
- Lebanese: 25 (0.2%)
- Hungarian: 21 (0.1%)
- Kenyan: 18 (0.1%)
- Northern European: 14 (0.10%)
- French Canadian: 13 (0.09%)
- Welsh: 13 (0.09%)
- Nigerian: 12 (0.08%)
- Palestinian: 10 (0.07%)
- Croatian: 10 (0.07%)
- Finnish: 7 (0.05%)
- Serbian: 6 (0.04%)
- Lithuanian: 5 (0.03%)
- Slovak: 5 (0.03%)
- Slovene: 5 (0.03%)
- Macedonian: 4 (0.03%)
Most common places of birth for foreign-born residents (%):
| Wildwood: | 30.9% (890) |
| Missouri: | 8.9% (22,932) |
| Wildwood: | 7.8% (225) |
| Missouri: | 2.9% (7,525) |
| Wildwood: | 7.3% (209) |
| Missouri: | 1.9% (4,806) |
| Wildwood: | 6.3% (181) |
| Missouri: | 6.6% (17,002) |
| Wildwood: | 4.9% (140) |
| Missouri: | 4.2% (10,873) |
| Wildwood: | 4.7% (136) |
| Missouri: | 0.4% (1,043) |
| Wildwood: | 4.3% (124) |
| Missouri: | 14.9% (38,568) |
| Wildwood: | 3.4% (98) |
| Missouri: | 0.6% (1,481) |
| Wildwood: | 3.3% (95) |
| Missouri: | 1.2% (3,209) |
| Wildwood: | 3.1% (88) |
| Missouri: | 1.1% (2,796) |
| Wildwood: | 2.8% (80) |
| Missouri: | 0.2% (494) |
| Wildwood: | 1.7% (49) |
| Missouri: | 1.7% (4,518) |
| Wildwood: | 1.6% (47) |
| Missouri: | 2.8% (7,146) |
Place of birth for U.S.-born residents:
- This state: 20,227
- Other state: 11,399
- Northeast: 1,592
- Midwest: 5,688
- South: 2,849
- West: 1,259
90.0% of Wildwood residents lived in the same house 1 years ago.
Out of people who lived in different houses, 39.7% lived in this county.
Out of people who lived in different counties, 53.6% lived in Missouri.
| Wildwood: | 90.0% |
| State average: | 87.1% |
Education attainment for males 25 years and older:
- No schooling: 68
- Nursery to 4th grade: 0
- 5th and 6th grade: 23
- 7th and 8th grade: 50
- 9th grade: 9
- 10th grade: 0
- 11th grade: 25
- 12th grade, no diploma: 41
- High school graduate (or equivalency): 841
- Less than 1 year of college: 434
- Some college more than 1 year, no degree: 1,222
- Associate degree: 712
- Bachelor's degree: 5,405
- Master's degree: 2,492
- Professional school degree: 494
- Doctorate degree: 438

Education attainment for females 25 years and older:
- No schooling: 71
- Nursery to 4th grade: 5
- 5th and 6th grade: 0
- 7th and 8th grade: 49
- 9th grade: 0
- 10th grade: 11
- 11th grade: 22
- 12th grade, no diploma: 66
- High school graduate (or equivalency): 1,323
- Less than 1 year of college: 667
- Some college more than 1 year, no degree: 1,277
- Associate degree: 669
- Bachelor's degree: 5,015
- Master's degree: 2,581
- Professional school degree: 249
- Doctorate degree: 380

Housing units in structures:
- One, detached: 12,167
- One, attached: 279
- Two: 19
- 3 or 4: 119
- 5 to 9: 339
- 10 to 19: 261
- 20 to 49: 22
- 50 or more: 47
Housing units lacking complete kitchen facilities in 2022: 1.1%
House/condo owner moved in on average 10 years ago
Renter moved in on average 1 years ago

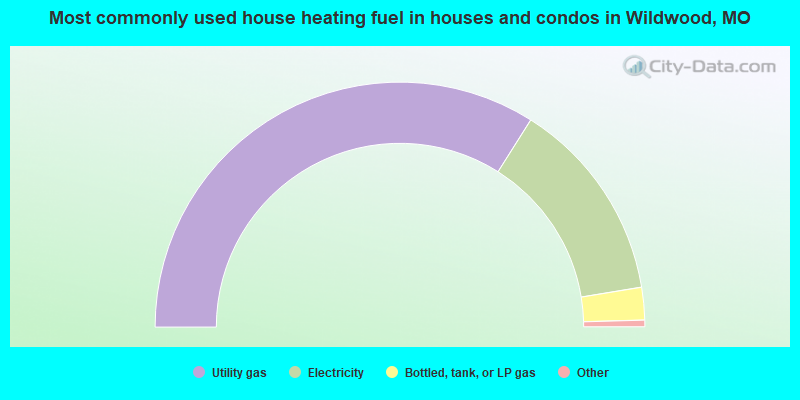
- 68.0%Utility gas
- 26.9%Electricity
- 4.3%Bottled, tank, or LP gas
- 0.5%Other fuel
- 0.1%Wood
- 0.1%No fuel used
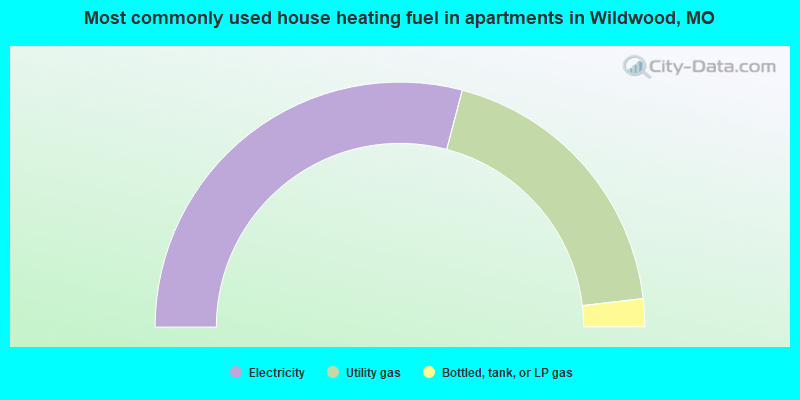
- 58.2%Electricity
- 38.1%Utility gas
- 3.7%Bottled, tank, or LP gas
Private vs. public school enrollment:
| Here: | 17.0% |
| Missouri: | 15.4% |
| Here: | 16.1% |
| Missouri: | 13.9% |
| Here: | 26.3% |
| Missouri: | 22.6% |


