Woodmore, MD (Maryland) Houses and Residents
| Woodmore: | $556,550 |
| Maryland: | $398,100 |
Mean price in 2022:
Detached houses: $748,687
Here: $748,687 State: $526,819 Townhouses or other attached units: $497,526
Here: $497,526 State: $328,305
Total population: 3,936 (All urban)
Houses: 1,772 (1,731 occupied: 1,543 owner occupied, 196 renter occupied)
| % of renters here: | 11% |
| State: | 32% |
Housing density: 147 houses/condos per square mile
Median price asked for vacant for-sale houses and condos in 2022 in this county: $422,373.
Median contract rent in 2022: over $2,000
Median rent asked for vacant for-rent units in 2022: $823
Median gross rent in Woodmore, MD in 2022: over $2,000
Housing units in Woodmore with a mortgage: 1,332 (141 second mortgage, 0 home equity loan, 123 both second mortgage and home equity loan)
Houses without a mortgage: 17
Median household income for houses/condos with a mortgage: $173,693
Median household income for apartments without a mortgage: $189,072
Median monthly housing costs: $2,809
Compare current foreclosures near Woodmore, MD:
| Photo | Address | Area | Beds / Baths | Price | Details |
|---|---|---|---|---|---|

|
#1
Gladys Retreat Cir
Bowie, MD 20720
|
2,880 sq. feet
|
3 baths 3 beds |
$409,900
|
show details |

|
#2
Carousel Ct
Upper Marlboro, MD 20772
|
2,112 sq. feet
|
2 baths 3 beds |
$412,000
|
show details |

|
#3
Whistling Duck Dr
Upper Marlboro, MD 20774
|
1,740 sq. feet
|
2 baths 3 beds |
$389,500
|
show details |

|
#4
19th St NW
Washington, DC 20036
|
2,515 sq. feet
|
6 baths 8 beds |
$1,684,800
|
show details |

|
#5
17th St NW Apt 504
Washington, DC 20009
|
800 sq. feet
|
1 baths 1 beds |
$419,900
|
show details |

|
#6
Addison Rd
Capitol Heights, MD 20743
|
1,400 sq. feet
|
1 baths 3 beds |
$260,000
|
show details |

|
#7
Parkside Dr
Bowie, MD 20721
|
5,066 sq. feet
|
2 baths 5 beds |
$780,000
|
show details |

|
#8
Heming Ln
Bowie, MD 20716
|
1,800 sq. feet
|
2 baths 3 beds |
$400,000
|
show details |

|
#9
Pickett Dr
Suitland, MD 20746
|
1,296 sq. feet
|
1 baths 2 beds |
$358,900
|
show details |

|
#10
Cathedral Ave NW Apt 108
Washington, DC 20016
|
765 sq. feet
|
1 baths 1 beds |
$279,900
|
show details |
| Photo | Address | Area | Beds / Baths | Price | Details |
|---|---|---|---|---|---|

|
#11
Eastern Ave NE
Washington, DC 20011
|
1,024 sq. feet
|
1 baths 3 beds |
$395,000
|
show details |

|
#12
Brooke Ln
Upper Marlboro, MD 20772
|
- sq. feet
|
5 baths 6 beds |
$949,000
|
show details |

|
#13
Delaware Ave SW Apt N720
Washington, DC 20024
|
- sq. feet
|
1 baths 1 beds |
$155,000
|
show details |

|
#14
T St SE Apt 3
Washington, DC 20020
|
- sq. feet
|
2 baths 4 beds |
$339,900
|
show details |

|
#15
Braden Loop
Glen Burnie, MD 21061
|
2,513 sq. feet
|
2 baths 3 beds |
show details | |

|
#16
Willow Leaf Ct
Odenton, MD 21113
|
1,476 sq. feet
|
2 baths 2 beds |
show details | |

|
#17
Millshire Dr
Millersville, MD 21108
|
1,280 sq. feet
|
2 baths 3 beds |
show details | |

|
#18
4th St NE Apt 2
Washington, DC 20002
|
1,061 sq. feet
|
2 baths 2 beds |
show details | |

|
#19
Lake Heron Dr # 1b
Annapolis, MD 21403
|
1,089 sq. feet
|
2 baths 2 beds |
show details | |

|
#20
46th St SE
Washington, DC 20019
|
1,232 sq. feet
|
2 baths 3 beds |
show details |
| Photo | Address | Area | Beds / Baths | Price | Details |
|---|---|---|---|---|---|

|
#21
S Arbory Ln
Laurel, MD 20707
|
1,283 sq. feet
|
3 baths 3 beds |
show details | |

|
#22
Connecticut Ave NW Apt 606
Washington, DC 20008
|
160 sq. feet
|
1 baths 1 beds |
show details | |

|
#23
Fern Pl NW
Washington, DC 20012
|
1,920 sq. feet
|
1 baths 4 beds |
show details | |

|
#24
Eddy Rd
Crownsville, MD 21032
|
1,100 sq. feet
|
2 baths 2 beds |
show details | |

|
#25
Southern Ave SE
Washington, DC 20019
|
1,024 sq. feet
|
1 baths 3 beds |
show details | |

|
#26
Astor Pl SE
Washington, DC 20019
|
2,516 sq. feet
|
4 baths 4 beds |
show details | |

|
#27
Wahler Pl SE
Washington, DC 20032
|
1,364 sq. feet
|
2 baths 3 beds |
show details | |

|
#28
Cathedral Ave NW Apt 404w
Washington, DC 20016
|
803 sq. feet
|
1 baths 1 beds |
show details | |

|
#29
Dana Dr
Hyattsville, MD 20783
|
2,380 sq. feet
|
2 baths 3 beds |
show details | |

|
#30
Berrybrook Ter
Upper Marlboro, MD 20772
|
2,319 sq. feet
|
3 baths 5 beds |
show details |
| Photo | Address | Area | Beds / Baths | Price | Details |
|---|---|---|---|---|---|

|
#31
Arbroath Dr
Clinton, MD 20735
|
1,432 sq. feet
|
2 baths 3 beds |
show details | |

|
#32
10th St
Bowie, MD 20715
|
994 sq. feet
|
1 baths 2 beds |
show details | |

|
#33
T Pl SE
Washington, DC 20020
|
900 sq. feet
|
2 baths 2 beds |
show details | |

|
#34
Redwood Ter
Temple Hills, MD 20748
|
1,188 sq. feet
|
3 baths 3 beds |
show details | |

|
#35
Kipling Pkwy
District Heights, MD 20747
|
1,680 sq. feet
|
1 baths 3 beds |
show details | |

|
#36
Dennington Dr
Bowie, MD 20721
|
4,164 sq. feet
|
2 baths 4 beds |
show details | |

|
#37
Sargent Rd NE
Washington, DC 20017
|
1,360 sq. feet
|
2 baths 3 beds |
show details | |

|
#38
Rugged Ln
Capitol Heights, MD 20743
|
- sq. feet
|
3 baths 4 beds |
show details | |

|
#39
Brock Bridge Rd
Laurel, MD 20724
|
1,428 sq. feet
|
1 baths 4 beds |
show details | |

|
#40
Dennis Rd
Shady Side, MD 20764
|
1,376 sq. feet
|
2 baths 3 beds |
show details |
| Photo | Address | Area | Beds / Baths | Price | Details |
|---|---|---|---|---|---|

|
#41
N Royal St
Alexandria, VA 22314
|
- sq. feet
|
1 baths 1 beds |
show details | |

|
#42
Halloway S
Upper Marlboro, MD 20772
|
1,300 sq. feet
|
2 baths 3 beds |
show details | |

|
#43
Wheeling Ave
Upper Marlboro, MD 20772
|
1,918 sq. feet
|
3 baths 4 beds |
show details | |

|
#44
Bowen Rd SE Apt 403
Washington, DC 20020
|
930 sq. feet
|
1 baths 2 beds |
show details | |

|
#45
Kalmia Rd NW
Washington, DC 20012
|
2,382 sq. feet
|
4 baths 4 beds |
show details | |

|
#46
Trent St
Clinton, MD 20735
|
1,080 sq. feet
|
2 baths 3 beds |
show details | |

|
#47
Norge Ct
Bowie, MD 20716
|
1,160 sq. feet
|
1 baths 3 beds |
show details | |

|
#48
Underwood Pl NW
Washington, DC 20012
|
1,088 sq. feet
|
3 baths 3 beds |
show details | |

|
#49
Rolling View Dr
Lanham, MD 20706
|
1,108 sq. feet
|
1 baths 3 beds |
show details | |

|
Check over 1 million property listings on Foreclosure.com!
|
browse all offers | |||

Latest news about housing in Woodmore, MD collected exclusively by city-data.com from local newspapers, TV, and radio stations


Median year apartment built: 1986
Household type by relationship:
Households: 4,328- Male householders: 751 (163 living alone), Female householders: 938 (238 living alone)
1,063 spouses (1,063 opposite-sex spouses), 71 unmarried partners, (51 opposite-sex unmarried partners), 1,039 children (992 natural, 43 adopted, 3 stepchildren), 107 grandchildren, 0 brothers or sisters, 30 parents, 0 foster children, 100 other relatives, 220 non-relatives
- In group quarters: 2
Size of family households: 637 2-persons, 349 3-persons, 217 4-persons, 48 5-persons, 15 6-persons, 10 7-or-more-persons.
Size of nonfamily households: 395 1-person, 11 2-persons, 33 3-persons, 10 4-persons, 9 5-persons, 11 6-persons.
421 married couples with children.
90 single-parent households (0 men, 90 women).
84.8% of residents of Woodmore speak English at home.
3.5% of residents speak Spanish at home (80% speak English very well, 20% speak English not well).
3.8% of residents speak other Indo-European language at home (80% speak English very well, 20% speak English well).
7.6% of residents speak other language at home (98% speak English very well, 2% speak English well).
Foreign born population: 577 (13.3%)
(76.6% of them are naturalized citizens)
| Here: | 9.7 |
| State: | 7.3 |
| Here: | 8.1 |
| State: | 4.2 |

- Bedrooms in owner-occupied houses and condos in Woodmore, Maryland
- 0no bedroom
- 71 bedroom
- 02 bedrooms
- 5583 bedrooms
- 5824 bedrooms
- 3965+ bedrooms

- Bedrooms in renter-occupied apartments in Woodmore, Maryland
- 0no bedroom
- 01 bedroom
- 02 bedrooms
- 1513 bedrooms
- 324 bedrooms
- 145+ bedrooms

- Cars and other vehicles available in Woodmore in owner-occupied houses/condos
- 8no vehicle
- 2331 vehicle
- 6122 vehicles
- 4313 vehicles
- 1944 vehicles
- 655+ vehicles

- Cars and other vehicles available in Woodmore in renter-occupied apartments
- 0no vehicle
- 01 vehicle
- 1512 vehicles
- 353 vehicles
- 04 vehicles
- 115+ vehicles

- Rooms in owner-occupied houses in Woodmore, Maryland
- 01 room
- 02 rooms
- 03 rooms
- 204 rooms
- 825 rooms
- 766 rooms
- 847 rooms
- 1798 rooms
- 1,1009+ rooms

- Rooms in renter-occupied apartments in Woodmore, Maryland
- 01 room
- 02 rooms
- 03 rooms
- 04 rooms
- 05 rooms
- 06 rooms
- 257 rooms
- 1258 rooms
- 469+ rooms


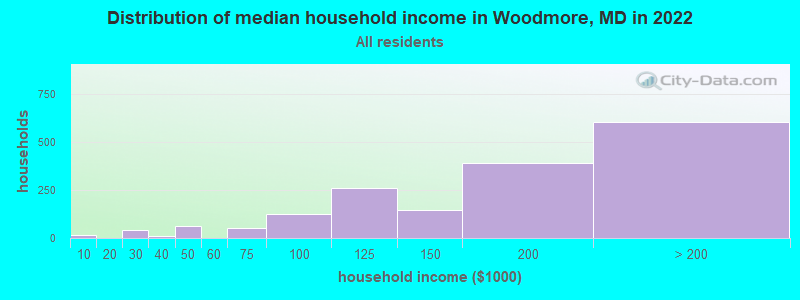
Woodmore, MD household income distribution

- 15Less than $10,000
- 41$20,000 to $29,999
- 9$30,000 to $39,999
- 65$40,000 to $49,999
- 51$60,000 to $74,999
- 126$75,000 to $99,999
- 261$100,000 to $124,999
- 144$125,000 to $149,999
- 390$150,000 to $199,999
- 604$200,000 or more
Home value of owner - occupied houses in 2022 in Woodmore, MD
-
- 2$60,000 to $69,999
- 10$250,000 to $299,999
- 247$300,000 to $399,999
- 527$400,000 to $499,999
- 578$500,000 to $749,999
- 213$750,000 to $999,999
- 184$1,000,000 to $1,499,999
- 25$1,500,000 to $1,999,999
- 13$2,000,000 or more

Percentage of workers working in this county: 61.2%
Number of people working at home: 595 (24.3% of all workers)
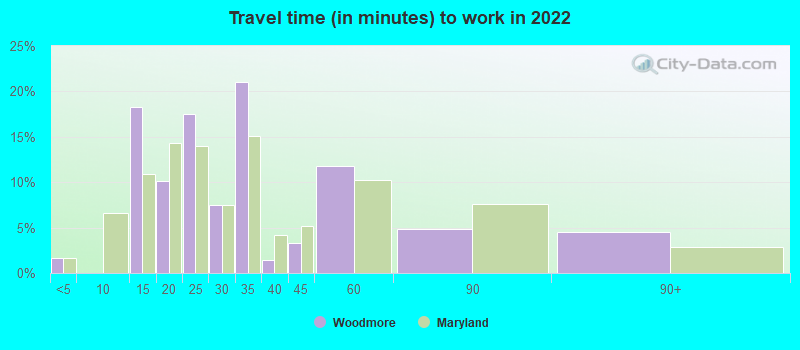
Travel time to work (commute)
- Less than 5 minutes: 6
- 5 to 9 minutes: 48
- 10 to 14 minutes: 200
- 15 to 19 minutes: 166
- 20 to 24 minutes: 94
- 25 to 29 minutes: 168
- 30 to 34 minutes: 193
- 35 to 39 minutes: 84
- 40 to 44 minutes: 159
- 45 to 59 minutes: 395
- 60 to 89 minutes: 323
- 90 or more minutes: 50
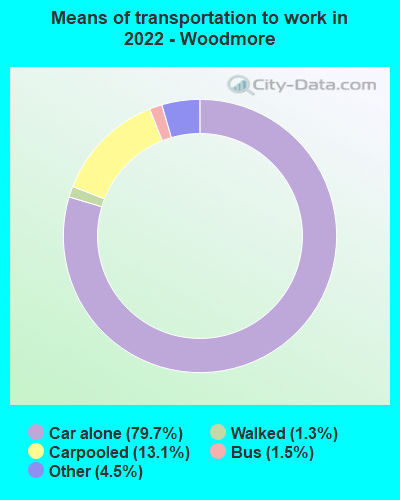
Means of transportation to work:
- Drove a car alone: 674 (50.1%)
- Carpooled: 101 (7.5%)
- Bus: 9 (0.7%)
- Taxi: 48 (3.6%)
- Walked: 10 (0.7%)
- Worked at home: 595 (44.2%)

- Unemployment by race in 2022
- Unemployment rate for White non-Hispanic residents
- 11.1%Females
- Unemployment rate for Black residents
- 10.9%Males
- 1.0%Females
- Unemployment rate for two or more race residents
- 30.5%Females
- Unemployment rate for Hispanic or Latino residents
- 10.7%Females

- Year of entry for the foreign-born population in Woodmore, Maryland
- 892010 or later
- 1222000 to 2009
- 1371990 to 1999
- 1621980 to 1989
- 2021970 to 1979
- 60Before 1970

First ancestries reported:
- Nigerian: 470 (16.0%)
- Ghanaian: 92 (3.1%)
- African: 44 (1.5%)
- Guyanese: 36 (1.2%)
- Kenyan: 36 (1.2%)
- American: 30 (1.0%)
- Northern European: 20 (0.7%)
- Jamaican: 19 (0.6%)
- Swiss: 10 (0.3%)
- Italian: 9 (0.3%)
- Sierra Leonean: 9 (0.3%)
- English: 8 (0.3%)
- Scotch-Irish: 8 (0.3%)
- Swedish: 8 (0.3%)
- Iranian: 7 (0.2%)
- German: 6 (0.2%)
- Polish: 6 (0.2%)
Most common places of birth for foreign-born residents (%):
| Woodmore: | 47.1% (268) |
| Maryland: | 4.6% (44,825) |
| Woodmore: | 11.8% (67) |
| Maryland: | 1.8% (17,774) |
| Woodmore: | 11.8% (67) |
| Maryland: | 0.8% (8,109) |
| Woodmore: | 6.0% (34) |
| Maryland: | 1.3% (12,074) |
| Woodmore: | 5.1% (29) |
| Maryland: | 12.0% (115,412) |
| Woodmore: | 3.3% (19) |
| Maryland: | 1.1% (10,233) |
| Woodmore: | 2.8% (16) |
| Maryland: | 0.5% (4,901) |
| Woodmore: | 2.3% (13) |
| Maryland: | 6.4% (61,725) |
| Woodmore: | 1.9% (11) |
| Maryland: | 0.1% (778) |
| Woodmore: | 1.6% (9) |
| Maryland: | 0.1% (916) |
Place of birth for U.S.-born residents:
- This state: 1,029
- Other state: 2,577
- Northeast: 389
- Midwest: 371
- South: 1,678
- West: 182
92.3% of Woodmore residents lived in the same house 1 years ago.
Out of people who lived in different houses, 36.6% lived in this county.
Out of people who lived in different counties, 0.0% lived in Maryland.
| Woodmore: | 92.3% |
| State average: | 88.5% |
Education attainment for males 25 years and older:
- No schooling: 55
- Nursery to 4th grade: 0
- 5th and 6th grade: 0
- 7th and 8th grade: 0
- 9th grade: 0
- 10th grade: 0
- 11th grade: 0
- 12th grade, no diploma: 12
- High school graduate (or equivalency): 238
- Less than 1 year of college: 127
- Some college more than 1 year, no degree: 156
- Associate degree: 114
- Bachelor's degree: 402
- Master's degree: 266
- Professional school degree: 191
- Doctorate degree: 58

Education attainment for females 25 years and older:
- No schooling: 7
- Nursery to 4th grade: 0
- 5th and 6th grade: 0
- 7th and 8th grade: 0
- 9th grade: 0
- 10th grade: 0
- 11th grade: 0
- 12th grade, no diploma: 0
- High school graduate (or equivalency): 230
- Less than 1 year of college: 134
- Some college more than 1 year, no degree: 295
- Associate degree: 86
- Bachelor's degree: 357
- Master's degree: 490
- Professional school degree: 136
- Doctorate degree: 150


Housing units in structures:
- One, detached: 1,398
- One, attached: 373
House/condo owner moved in on average 16 years ago
Renter moved in on average 1 years ago

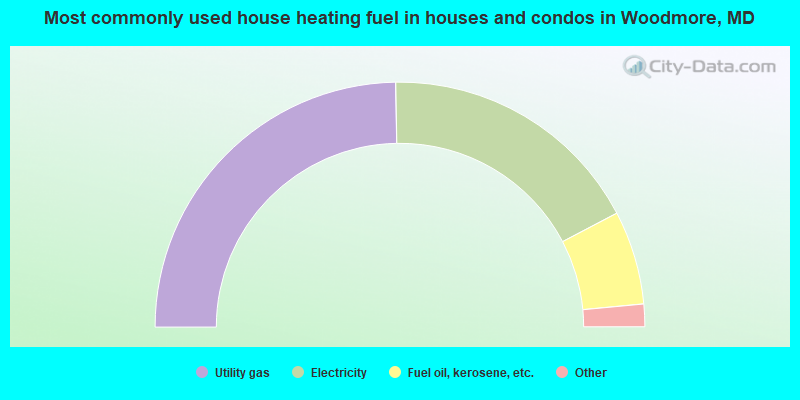
- 49.5%Utility gas
- 35.2%Electricity
- 12.4%Fuel oil, kerosene, etc.
- 1.6%Solar energy
- 1.3%Bottled, tank, or LP gas
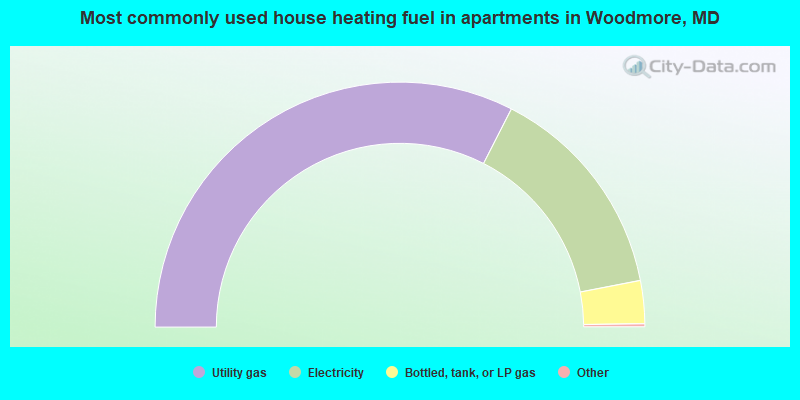
- 65.3%Utility gas
- 29.0%Electricity
- 5.7%Bottled, tank, or LP gas
Private vs. public school enrollment:
| Here: | 45.6% |
| Maryland: | 15.2% |
| Here: | 21.8% |
| Maryland: | 14.4% |
| Here: | 27.0% |
| Maryland: | 20.2% |


