Yellville, AR (Arkansas) Houses and Residents
| Yellville: | $150,904 |
| Arkansas: | $179,800 |
Mean price in 2022:
Detached houses: $144,371
Here: $144,371 State: $243,881
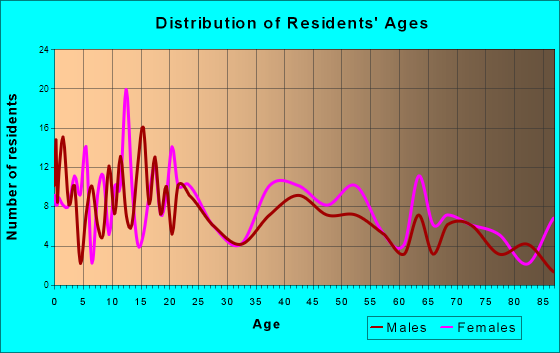
Total population: 1,181 (Urban population: 0, Rural population: 1,332 (6 farm, 1,326 nonfarm))
Houses: 597 (434 occupied: 261 owner occupied, 181 renter occupied)
| % of renters here: | 41% |
| State: | 34% |
Housing density: 235 houses/condos per square mile
Median price asked for vacant for-sale houses and condos in 2022: $195,334.
Median contract rent in 2022: $538 (lower quartile is $300, upper quartile is $705)
Median rent asked for vacant for-rent units in 2022: $569
Median gross rent in Yellville, AR in 2022: $665
Housing units in Yellville with a mortgage: 157 (0 second mortgage, 0 home equity loan, 0 both second mortgage and home equity loan)
Houses without a mortgage: 3
Median household income for houses/condos with a mortgage: $34,053
Median monthly housing costs: $652
Compare current foreclosures near Yellville, AR:
| Photo | Address | Area | Beds / Baths | Price | Details |
|---|---|---|---|---|---|

|
#1
Old Rush Creek Rd
Yellville, AR 72687
|
800 sq. feet
|
1 baths - beds |
show details | |

|
#2
Marion County 8013
Yellville, AR 72687
|
1,029 sq. feet
|
1 baths - beds |
show details | |

|
#3
Marion County 6016
Yellville, AR 72687
|
- sq. feet
|
- baths - beds |
show details | |

|
#4
South St
Flippin, AR 72634
|
900 sq. feet
|
1 baths 3 beds |
$119,900
|
show details |

|
#5
Marion County 8001
Yellville, AR 72687
|
- sq. feet
|
- baths - beds |
show details | |

|
#6
Bent Oak Ln
Midway, AR 72651
|
- sq. feet
|
2 baths 3 beds |
show details | |

|
#7
E Main St
Lead Hill, AR 72644
|
1,844 sq. feet
|
1 baths - beds |
show details | |

|
#8
Brittain Cemetery Rd
Harrison, AR 72601
|
1,152 sq. feet
|
1 baths - beds |
show details | |

|
#9
Orchid Ln
Mountain Home, AR 72653
|
2,759 sq. feet
|
2 baths - beds |
show details | |

|
#10
Leawood Dr
Midway, AR 72651
|
960 sq. feet
|
1 baths - beds |
show details |
| Photo | Address | Area | Beds / Baths | Price | Details |
|---|---|---|---|---|---|

|
#11
County Road 185
Mountain Home, AR 72653
|
1,108 sq. feet
|
1 baths - beds |
show details | |

|
#12
Highway 62 W
Gassville, AR 72635
|
1,783 sq. feet
|
2 baths - beds |
show details | |

|
#13
Crest Loop
Gassville, AR 72635
|
1,368 sq. feet
|
2 baths - beds |
show details | |

|
#14
Elm St
Gassville, AR 72635
|
1,602 sq. feet
|
1 baths - beds |
show details | |

|
#15
S 6th St
Flippin, AR 72634
|
1,226 sq. feet
|
2 baths - beds |
show details | |

|
#16
Marion County 5004
Valley Springs, AR 72682
|
3,328 sq. feet
|
3 baths - beds |
show details | |

|
#17
Hathcoat Rd
Harrison, AR 72601
|
1,230 sq. feet
|
1 baths - beds |
show details | |

|
#18
Girard St
Flippin, AR 72634
|
983 sq. feet
|
1 baths - beds |
show details | |

|
#19
Broncos Trl
Flippin, AR 72634
|
1,148 sq. feet
|
3 baths - beds |
show details | |

|
#20
Carolyn Dr
Bull Shoals, AR 72619
|
936 sq. feet
|
1 baths - beds |
show details |
| Photo | Address | Area | Beds / Baths | Price | Details |
|---|---|---|---|---|---|

|
#21
Pace Pl
Gassville, AR 72635
|
- sq. feet
|
- baths - beds |
show details | |

|
#22
Buford Spur Cir
Mountain Home, AR 72653
|
672 sq. feet
|
- baths - beds |
show details | |

|
#23
County Road 643
Mountain Home, AR 72653
|
- sq. feet
|
- baths - beds |
show details | |

|
#24
Carmel Rd
Flippin, AR 72634
|
- sq. feet
|
- baths - beds |
show details | |

|
#25
N Pike St
Summit, AR 72677
|
- sq. feet
|
- baths - beds |
show details | |

|
#26
Marion County 2049
Lead Hill, AR 72644
|
- sq. feet
|
- baths - beds |
show details | |

|
#27
Nubbin Ridge Rd Lot 37
Lakeview, AR 72642
|
952 sq. feet
|
- baths - beds |
show details | |

|
#28
Highway 178 W
Lakeview, AR 72642
|
- sq. feet
|
- baths - beds |
show details | |

|
#29
Zinc Rd
Harrison, AR 72601
|
- sq. feet
|
- baths - beds |
show details | |

|
#30
S Cedar St
Summit, AR 72677
|
- sq. feet
|
- baths - beds |
show details |
| Photo | Address | Area | Beds / Baths | Price | Details |
|---|---|---|---|---|---|

|
Check over 1 million property listings on Foreclosure.com!
|
browse all offers | |||
| Photo | Address | Area | Beds / Baths | Price | Details |
|---|

Latest news about housing in Yellville, AR collected exclusively by city-data.com from local newspapers, TV, and radio stations

 | Looking To Homestead- How About The Waldron Area? (34 replies) |
| Point us in the right direction (47 replies) |
| Bull Shoals/Mountain Home (24 replies) |
| Is Arkansas what I'm looking for? (54 replies) |
| Mountain Home Area-Pros and Cons (3 replies) |
| What's your favorite town name in Arkansas? (121 replies) |
Median year apartment built: 1975
Household type by relationship:
Households: 1,169- Male householders: 193 (48 living alone), Female householders: 237 (82 living alone)
167 spouses (167 opposite-sex spouses), 18 unmarried partners, (18 opposite-sex unmarried partners), 294 children (249 natural, 0 adopted, 45 stepchildren), 69 grandchildren, 8 brothers or sisters, 0 parents, 0 foster children, 54 other relatives, 45 non-relatives
- In group quarters: 80
Size of family households: 154 2-persons, 67 3-persons, 27 4-persons, 18 5-persons, 8 6-persons, 9 7-or-more-persons.
Size of nonfamily households: 142 1-person, 18 2-persons.
126 married couples with children.
80 single-parent households (15 men, 65 women).
96.0% of residents of Yellville speak English at home.
1.5% of residents speak Spanish at home (41% speak English very well, 59% speak English well).
2.4% of residents speak other Indo-European language at home (100% speak English very well).
Foreign born population: 34 (2.9%)
(29.4% of them are naturalized citizens)
| Here: | 5.8 |
| State: | 6.1 |
| Here: | 3.7 |
| State: | 4.3 |

- Bedrooms in owner-occupied houses and condos in Yellville, Arkansas
- 0no bedroom
- 131 bedroom
- 552 bedrooms
- 1663 bedrooms
- 224 bedrooms
- 55+ bedrooms

- Bedrooms in renter-occupied apartments in Yellville, Arkansas
- 0no bedroom
- 631 bedroom
- 482 bedrooms
- 613 bedrooms
- 94 bedrooms
- 05+ bedrooms

- Cars and other vehicles available in Yellville in owner-occupied houses/condos
- 0no vehicle
- 1141 vehicle
- 1022 vehicles
- 243 vehicles
- 184 vehicles
- 45+ vehicles

- Cars and other vehicles available in Yellville in renter-occupied apartments
- 47no vehicle
- 831 vehicle
- 292 vehicles
- 133 vehicles
- 94 vehicles
- 05+ vehicles

- Rooms in owner-occupied houses in Yellville, Arkansas
- 01 room
- 62 rooms
- 03 rooms
- 364 rooms
- 805 rooms
- 286 rooms
- 357 rooms
- 698 rooms
- 79+ rooms

- Rooms in renter-occupied apartments in Yellville, Arkansas
- 01 room
- 02 rooms
- 783 rooms
- 374 rooms
- 375 rooms
- 236 rooms
- 67 rooms
- 08 rooms
- 09+ rooms


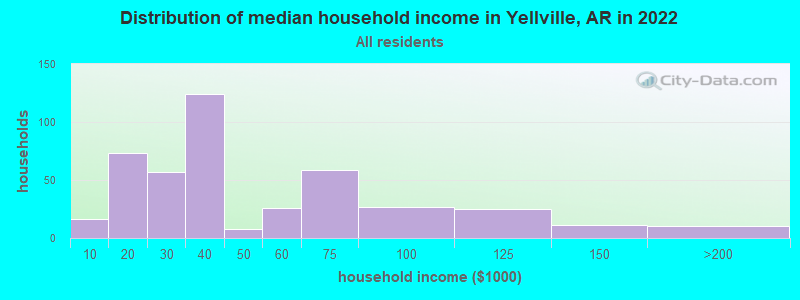
Yellville, AR household income distribution

- 16Less than $10,000
- 73$10,000 to $19,999
- 57$20,000 to $29,999
- 124$30,000 to $39,999
- 8$40,000 to $49,999
- 26$50,000 to $59,999
- 59$60,000 to $74,999
- 27$75,000 to $99,999
- 25$100,000 to $124,999
- 11$125,000 to $149,999
- 8$150,000 to $199,999
- 2$200,000 or more
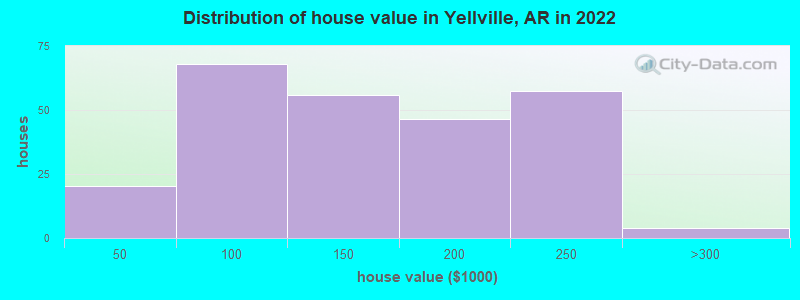
Home value of owner - occupied houses in 2022 in Yellville, AR
-
- 3$15,000 to $19,999
- 3$30,000 to $34,999
- 13$40,000 to $49,999
- 6$50,000 to $59,999
- 11$60,000 to $69,999
- 3$70,000 to $79,999
- 20$80,000 to $89,999
- 11$90,000 to $99,999
- 27$100,000 to $124,999
- 28$125,000 to $149,999
- 40$150,000 to $174,999
- 5$175,000 to $199,999
- 57$200,000 to $249,999
- 3$250,000 to $299,999
Rent paid by renters in 2022 in Yellville, AR
-
- 9$150 to $199
- 3$200 to $249
- 27$250 to $299
- 14$300 to $349
- 2$350 to $399
- 3$400 to $449
- 8$450 to $499
- 22$500 to $549
- 23$550 to $599
- 12$600 to $649
- 12$700 to $749
- 29$800 to $899
- 1No cash rent


Percentage of workers working in this county: 69.1%
Number of people working at home: 47 (11.1% of all workers)
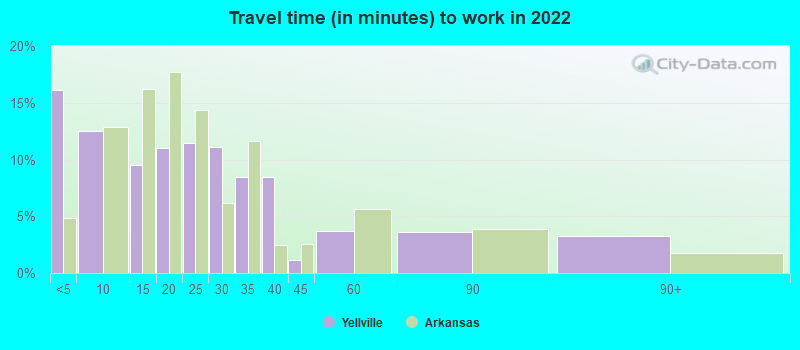
Travel time to work (commute)
- Less than 5 minutes: 101
- 5 to 9 minutes: 70
- 10 to 14 minutes: 34
- 15 to 19 minutes: 31
- 20 to 24 minutes: 16
- 25 to 29 minutes: 2
- 30 to 34 minutes: 58
- 35 to 39 minutes: 6
- 40 to 44 minutes: 13
- 45 to 59 minutes: 29
- 60 to 89 minutes: 12
- 90 or more minutes: 0
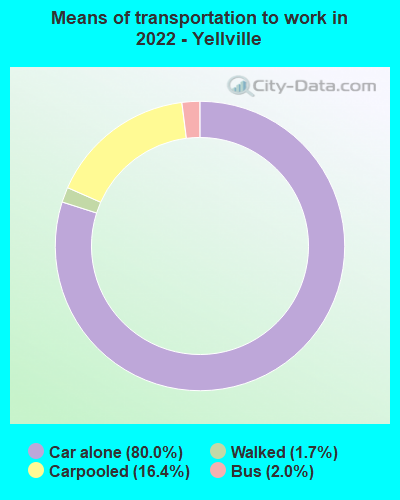
Means of transportation to work:
- Drove a car alone: 1,015 (77.0%)
- Carpooled: 181 (13.7%)
- Bus: 25 (1.9%)
- Walked: 22 (1.7%)
- Worked at home: 47 (3.6%)

- Unemployment by race in 2022
- Unemployment rate for White non-Hispanic residents
- 5.5%Males
- 9.4%Females
- Unemployment rate for Black residents
- 100.0%Males
- 100.0%Females
- Unemployment rate for two or more race residents
- 10.8%Females

- Year of entry for the foreign-born population in Yellville, Arkansas
- 272010 or later
- 02000 to 2009
- 01990 to 1999
- 01980 to 1989
- 01970 to 1979
- 9Before 1970
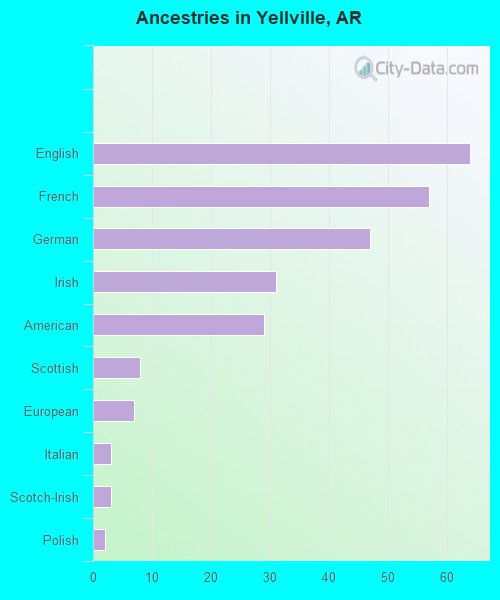
First ancestries reported:
- English: 64 (17.4%)
- French: 57 (15.5%)
- German: 47 (12.8%)
- Irish: 31 (8.4%)
- American: 29 (7.9%)
- Scottish: 8 (2.2%)
- European: 7 (1.9%)
- Italian: 3 (0.8%)
- Scotch-Irish: 3 (0.8%)
- Polish: 2 (0.5%)
Most common places of birth for foreign-born residents (%):
| Yellville: | 44.1% (15) |
| Arkansas: | 0.1% (195) |
| Yellville: | 29.4% (10) |
| Arkansas: | 10.7% (16,210) |
| Yellville: | 26.5% (9) |
| Arkansas: | 0.3% (469) |
Place of birth for U.S.-born residents:
- This state: 609
- Other state: 528
- Northeast: 23
- Midwest: 224
- South: 211
- West: 67
85.9% of Yellville residents lived in the same house 1 years ago.
Out of people who lived in different houses, 29.7% lived in this county.
Out of people who lived in different counties, 25.0% lived in Arkansas.
| Yellville: | 85.9% |
| State average: | 87.0% |
Education attainment for males 25 years and older:
- No schooling: 3
- Nursery to 4th grade: 0
- 5th and 6th grade: 6
- 7th and 8th grade: 0
- 9th grade: 0
- 10th grade: 12
- 11th grade: 0
- 12th grade, no diploma: 2
- High school graduate (or equivalency): 124
- Less than 1 year of college: 39
- Some college more than 1 year, no degree: 77
- Associate degree: 22
- Bachelor's degree: 24
- Master's degree: 22
- Professional school degree: 0
- Doctorate degree: 0

Education attainment for females 25 years and older:
- No schooling: 3
- Nursery to 4th grade: 0
- 5th and 6th grade: 17
- 7th and 8th grade: 7
- 9th grade: 8
- 10th grade: 4
- 11th grade: 3
- 12th grade, no diploma: 20
- High school graduate (or equivalency): 201
- Less than 1 year of college: 43
- Some college more than 1 year, no degree: 39
- Associate degree: 33
- Bachelor's degree: 20
- Master's degree: 15
- Professional school degree: 3
- Doctorate degree: 0

Housing units in structures:
- One, detached: 470
- Two: 53
- 5 to 9: 42
- 20 to 49: 5
- Mobile homes: 25
Housing units lacking complete kitchen facilities in 2022: 1.4%
House/condo owner moved in on average 9 years ago
Renter moved in on average 5 years ago

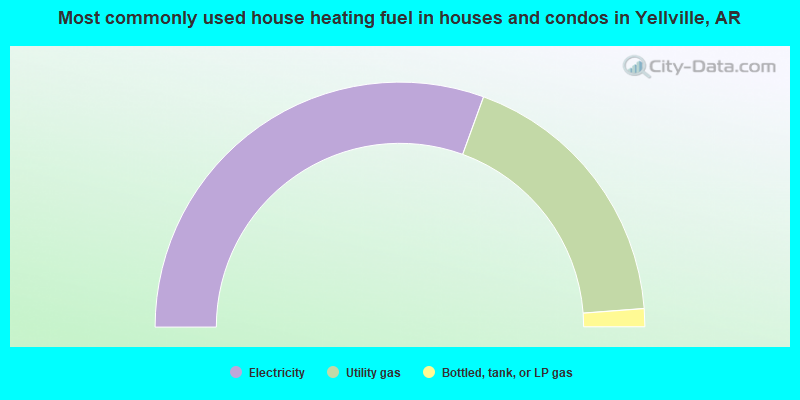
- 61.1%Electricity
- 36.5%Utility gas
- 2.4%Bottled, tank, or LP gas
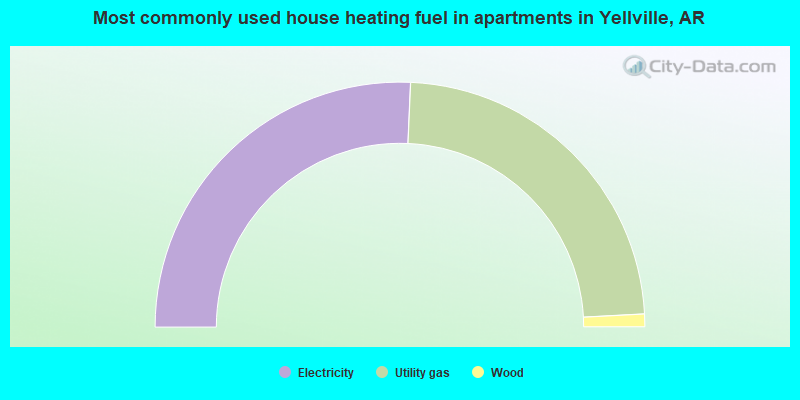
- 51.4%Electricity
- 46.9%Utility gas
- 1.7%Wood
Private vs. public school enrollment:
| Here: | 0.0% |
| Arkansas: | 10.5% |
| Here: | 11.9% |
| Arkansas: | 8.7% |
| Here: | 75.0% |
| Arkansas: | 19.4% |


