Bennsville, Maryland
Submit your own pictures of this place and show them to the world
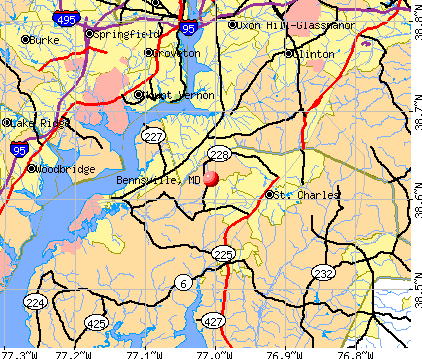
- OSM Map
- General Map
- Google Map
- MSN Map
Population change since 2000: +62.8%
| Males: 5,760 | |
| Females: 6,163 |
| Median resident age: | 37.8 years |
| Maryland median age: | 34.4 years |
Zip codes: 20603, 20675, 20695.
Bennsville Zip Code Map| Bennsville: | $155,356 |
| MD: | $94,991 |
Estimated per capita income in 2022: $57,792 (it was $29,677 in 2000)
Bennsville CDP income, earnings, and wages data
Estimated median house or condo value in 2022: $503,084 (it was $193,300 in 2000)
| Bennsville: | $503,084 |
| MD: | $398,100 |
Mean prices in 2022: all housing units: $421,884; detached houses: $448,816; townhouses or other attached units: $287,336; in 2-unit structures: $223,968; in 3-to-4-unit structures: $232,479; in 5-or-more-unit structures: $265,223; mobile homes: $64,617; occupied boats, rvs, vans, etc.: $454,094
Detailed information about poverty and poor residents in Bennsville, MD
Compare current foreclosures near Bennsville, MD:
| Photo | Address | Area | Beds / Baths | Price | Details |
|---|---|---|---|---|---|

|
#1
Bannister Cir
Waldorf, MD 20602
|
1,196 sq. feet
|
3 baths 4 beds |
$449,900
|
show details |

|
#2
Greenwood Pl
Indian Head, MD 20640
|
912 sq. feet
|
1 baths 2 beds |
$104,900
|
show details |

|
#3
Wills Rd
Bel Alton, MD 20611
|
1,444 sq. feet
|
2 baths 3 beds |
$275,000
|
show details |

|
#4
Old Fort Rd
Fort Washington, MD 20744
|
721 sq. feet
|
1 baths 2 beds |
$179,900
|
show details |

|
#5
Pickett Dr
Suitland, MD 20746
|
1,296 sq. feet
|
1 baths 2 beds |
$358,900
|
show details |

|
#6
Carousel Ct
Upper Marlboro, MD 20772
|
2,112 sq. feet
|
2 baths 3 beds |
$412,000
|
show details |

|
#7
T St SE Apt 3
Washington, DC 20020
|
- sq. feet
|
2 baths 4 beds |
$339,900
|
show details |

|
#8
Ryon Ct
Waldorf, MD 20601
|
1,244 sq. feet
|
3 baths 3 beds |
show details | |

|
#9
Newtowne Ct
Lorton, VA 22079
|
- sq. feet
|
2 baths 4 beds |
show details | |

|
#10
Carolyn Forest Dr
Woodbridge, VA 22192
|
1,593 sq. feet
|
2 baths 2 beds |
show details |
| Photo | Address | Area | Beds / Baths | Price | Details |
|---|---|---|---|---|---|

|
#11
Summerwood Ln
Accokeek, MD 20607
|
3,774 sq. feet
|
5 baths 4 beds |
show details | |

|
#12
Oakside Ln
Indian Head, MD 20640
|
1,102 sq. feet
|
1 baths 3 beds |
show details | |

|
#13
Culpeper Dr
Woodbridge, VA 22191
|
1,224 sq. feet
|
3 baths 4 beds |
show details | |

|
#14
16th St S Apt 696
Arlington, VA 22204
|
1,008 sq. feet
|
1 baths 2 beds |
show details | |

|
#15
Windbreak Dr
Alexandria, VA 22306
|
1,360 sq. feet
|
3 baths 3 beds |
show details | |

|
#16
Eaton Woods Pl
Lorton, VA 22079
|
1,448 sq. feet
|
2 baths 3 beds |
show details | |

|
#17
Litton Ln
Accokeek, MD 20607
|
816 sq. feet
|
2 baths 3 beds |
show details | |

|
#18
Gunsmith Ter
Woodbridge, VA 22191
|
969 sq. feet
|
3 baths 2 beds |
show details | |

|
#19
S Faulkner Rd
Faulkner, MD 20632
|
1,512 sq. feet
|
2 baths 3 beds |
show details | |

|
#20
Berrybrook Ter
Upper Marlboro, MD 20772
|
2,319 sq. feet
|
3 baths 5 beds |
show details |
| Photo | Address | Area | Beds / Baths | Price | Details |
|---|---|---|---|---|---|

|
#21
Herring Creek Dr
Accokeek, MD 20607
|
2,636 sq. feet
|
3 baths 4 beds |
show details | |

|
#22
Ironwood St
Woodbridge, VA 22191
|
1,280 sq. feet
|
2 baths 3 beds |
show details | |

|
#23
Peanuts Ln
Waldorf, MD 20602
|
- sq. feet
|
2 baths 3 beds |
show details | |

|
#24
Poplarwood Ct
Waldorf, MD 20601
|
1,080 sq. feet
|
2 baths 3 beds |
show details | |

|
#25
Catenary Dr
Woodbridge, VA 22191
|
2,012 sq. feet
|
3 baths 4 beds |
show details | |

|
#26
Bowen Rd SE Apt 403
Washington, DC 20020
|
930 sq. feet
|
1 baths 2 beds |
show details | |

|
#27
Lake Hill Ct
Waldorf, MD 20603
|
1,948 sq. feet
|
2 baths 3 beds |
show details | |

|
#28
Wahler Pl SE
Washington, DC 20032
|
1,364 sq. feet
|
2 baths 3 beds |
show details | |

|
#29
S George Mason Dr Unit 918n
Falls Church, VA 22041
|
752 sq. feet
|
1 baths 1 beds |
show details | |

|
#30
Petzold Dr
Waldorf, MD 20601
|
1,784 sq. feet
|
2 baths 4 beds |
show details |
| Photo | Address | Area | Beds / Baths | Price | Details |
|---|---|---|---|---|---|

|
#31
Wheeling Ave
Upper Marlboro, MD 20772
|
1,918 sq. feet
|
3 baths 4 beds |
show details | |

|
#32
N Royal St
Alexandria, VA 22314
|
- sq. feet
|
1 baths 1 beds |
show details | |

|
#33
Cloverdale Rd # 22193
Woodbridge, VA 22193
|
1,410 sq. feet
|
3 baths 3 beds |
show details | |

|
#34
Penns Hill Rd
La Plata, MD 20646
|
2,702 sq. feet
|
2 baths 4 beds |
show details | |

|
#35
Rolling Spring Ct
Springfield, VA 22152
|
3,365 sq. feet
|
4 baths 4 beds |
show details | |

|
#36
Smallwood Dr
Hughesville, MD 20637
|
1,120 sq. feet
|
1 baths 3 beds |
show details | |

|
#37
Birdsong Dr
Fort Washington, MD 20744
|
2,406 sq. feet
|
2 baths 4 beds |
show details | |

|
#38
English Ct
Suitland, MD 20746
|
1,296 sq. feet
|
2 baths 3 beds |
show details | |

|
#39
Trent St
Clinton, MD 20735
|
1,080 sq. feet
|
2 baths 3 beds |
show details | |

|
#40
Patuxent Ct
La Plata, MD 20646
|
1,104 sq. feet
|
1 baths 2 beds |
show details |
| Photo | Address | Area | Beds / Baths | Price | Details |
|---|---|---|---|---|---|

|
#41
Tayack Pl Unit 203
Alexandria, VA 22312
|
1,322 sq. feet
|
2 baths 2 beds |
show details | |

|
#42
Scottsdale Pl
Waldorf, MD 20602
|
2,068 sq. feet
|
3 baths 3 beds |
show details | |

|
#43
Carousel Ct
Upper Marlboro, MD 20772
|
1,608 sq. feet
|
4 baths 4 beds |
show details | |

|
#44
Baileys Pond Rd
Accokeek, MD 20607
|
4,677 sq. feet
|
2 baths 7 beds |
show details | |

|
#45
Lakewood Dr
Woodbridge, VA 22192
|
2,038 sq. feet
|
2 baths 4 beds |
show details | |

|
#46
T Pl SE
Washington, DC 20020
|
900 sq. feet
|
2 baths 2 beds |
show details | |

|
#47
Redwood Ter
Temple Hills, MD 20748
|
1,188 sq. feet
|
3 baths 3 beds |
show details | |

|
#48
Bittersweet Dr
Hughesville, MD 20637
|
2,249 sq. feet
|
2 baths 3 beds |
show details | |

|
#49
Arbroath Dr
Clinton, MD 20735
|
1,432 sq. feet
|
2 baths 3 beds |
show details | |

|
Check over 1 million property listings on Foreclosure.com!
|
browse all offers | |||

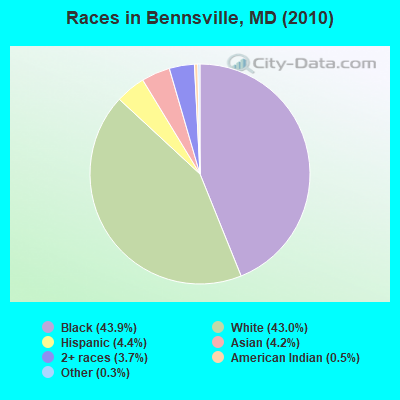
- 5,23843.9%Black alone
- 5,13143.0%White alone
- 5194.4%Hispanic
- 4964.2%Asian alone
- 4373.7%Two or more races
- 590.5%American Indian alone
- 330.3%Other race alone
- 100.08%Native Hawaiian and Other
Pacific Islander alone
Races in Bennsville detailed stats: ancestries, foreign born residents, place of birth
 Recent articles from our blog. Our writers, many of them Ph.D. graduates or candidates, create easy-to-read articles on a wide variety of topics.


 | Waldorf-MD? (69 replies) |
| The truth about Waldorf, MD? (148 replies) |
Ancestries: German (20.7%), Irish (17.3%), English (14.5%), Italian (8.2%), United States (5.0%), French (2.9%).
Current Local Time: EST time zone
Elevation: 180 feet
Land area: 17.0 square miles.
Population density: 703 people per square mile (low).
179 residents are foreign born (1.0% Asia, 0.7% Latin America, 0.7% Europe).
| This place: | 2.4% |
| Maryland: | 9.8% |
| Bennsville CDP: | 1.0% ($1,932) |
| Maryland: | 1.2% ($1,782) |
Nearest city with pop. 50,000+: Alexandria, VA  (13.8 miles , pop. 128,283).
Nearest city with pop. 200,000+: Washington, DC (20.1 miles , pop. 572,059).
Nearest city with pop. 1,000,000+: Philadelphia, PA (137.7 miles , pop. 1,517,550).
Nearest cities:
), ), ), ), ), Latitude: 38.62 N, Longitude: 77.01 W
Daytime population change due to commuting: -3,602 (-49.2%)
Workers who live and work in this place: 187 (4.6%)
Property values in Bennsville, MD
| Here: | 2.1% |
| Maryland: | 2.0% |
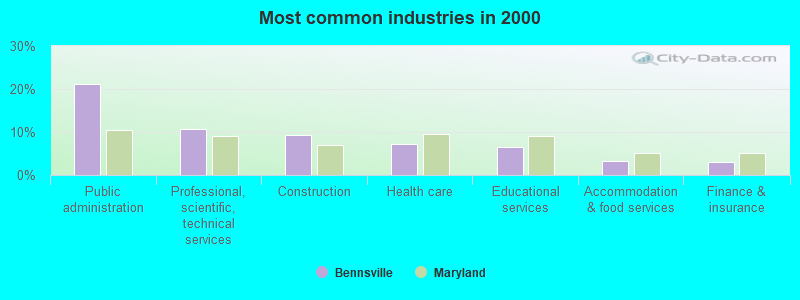
- Public administration (21.1%)
- Professional, scientific, technical services (10.7%)
- Construction (9.4%)
- Health care (7.1%)
- Educational services (6.6%)
- Accommodation & food services (3.3%)
- Finance & insurance (2.9%)
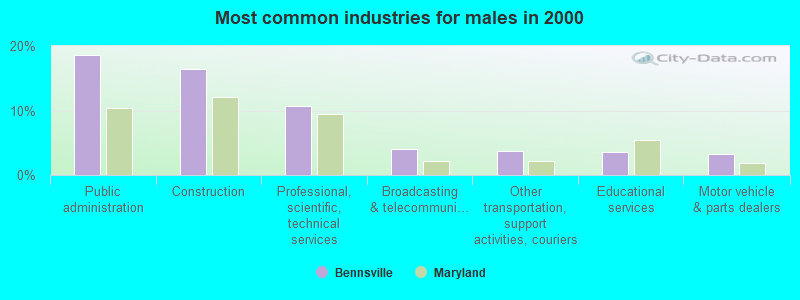
- Public administration (18.6%)
- Construction (16.4%)
- Professional, scientific, technical services (10.7%)
- Broadcasting & telecommunications (4.1%)
- Other transportation, support activities, couriers (3.7%)
- Educational services (3.6%)
- Motor vehicle & parts dealers (3.2%)
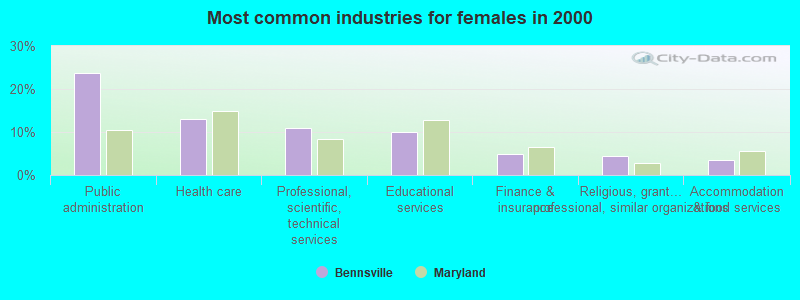
- Public administration (23.8%)
- Health care (13.0%)
- Professional, scientific, technical services (10.8%)
- Educational services (10.0%)
- Finance & insurance (4.9%)
- Religious, grantmaking, civic, professional, similar organizations (4.4%)
- Accommodation & food services (3.5%)
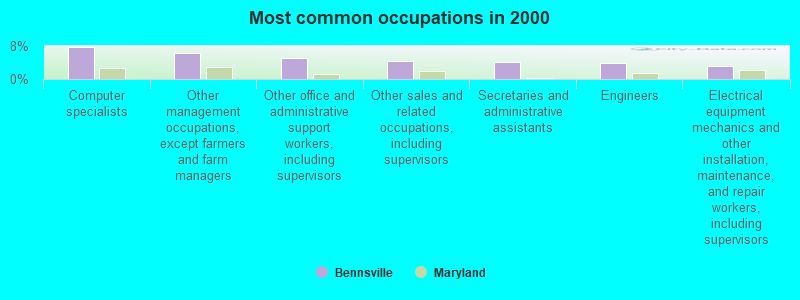
- Computer specialists (7.7%)
- Other management occupations, except farmers and farm managers (6.4%)
- Other office and administrative support workers, including supervisors (5.0%)
- Other sales and related occupations, including supervisors (4.3%)
- Secretaries and administrative assistants (4.1%)
- Engineers (3.8%)
- Electrical equipment mechanics and other installation, maintenance, and repair workers, including supervisors (3.2%)
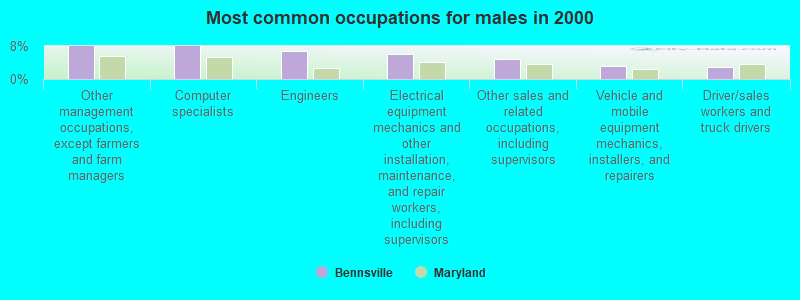
- Other management occupations, except farmers and farm managers (8.0%)
- Computer specialists (7.9%)
- Engineers (6.8%)
- Electrical equipment mechanics and other installation, maintenance, and repair workers, including supervisors (6.2%)
- Other sales and related occupations, including supervisors (4.8%)
- Vehicle and mobile equipment mechanics, installers, and repairers (3.1%)
- Driver/sales workers and truck drivers (3.0%)
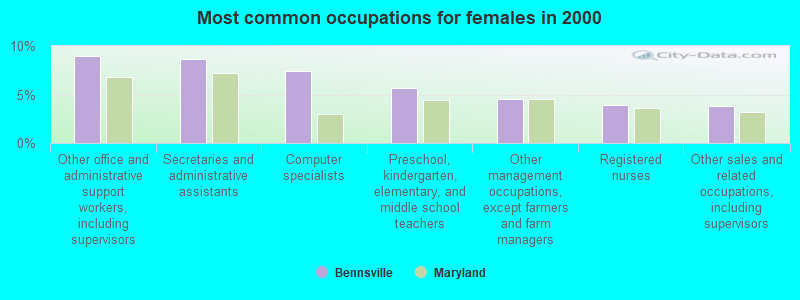
- Other office and administrative support workers, including supervisors (9.0%)
- Secretaries and administrative assistants (8.6%)
- Computer specialists (7.5%)
- Preschool, kindergarten, elementary, and middle school teachers (5.7%)
- Other management occupations, except farmers and farm managers (4.5%)
- Registered nurses (3.9%)
- Other sales and related occupations, including supervisors (3.9%)
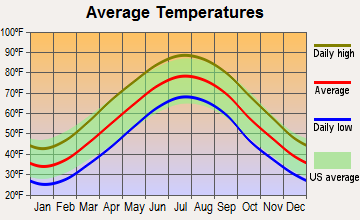
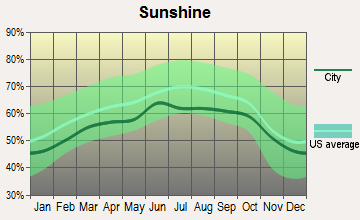
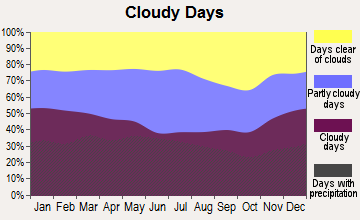
Average climate in Bennsville, Maryland
Based on data reported by over 4,000 weather stations
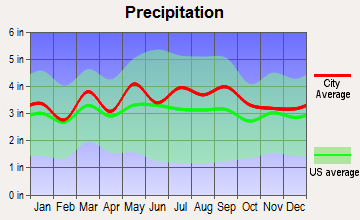
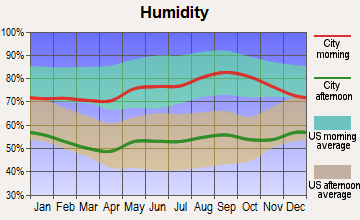
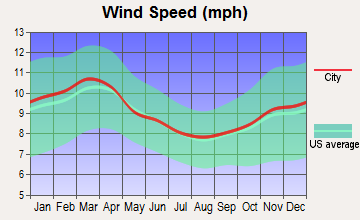
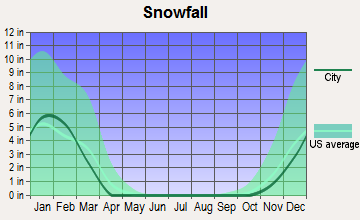
(lower is better)
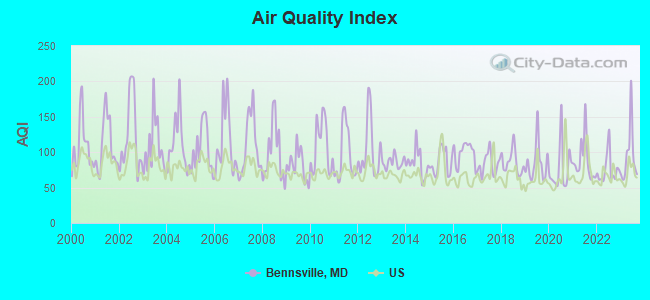
Air Quality Index (AQI) level in 2023 was 94.6. This is worse than average.
| City: | 94.6 |
| U.S.: | 72.6 |
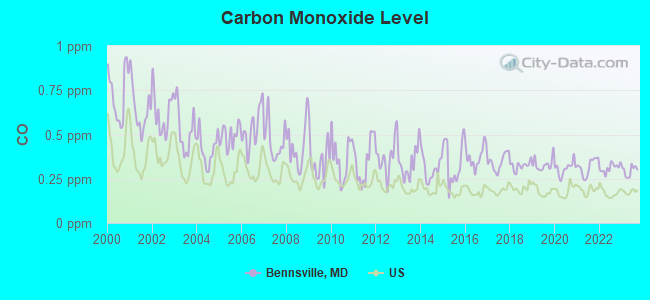
Carbon Monoxide (CO) [ppm] level in 2023 was 0.295. This is about average. Closest monitor was 9.1 miles away from the city center.
| City: | 0.295 |
| U.S.: | 0.251 |
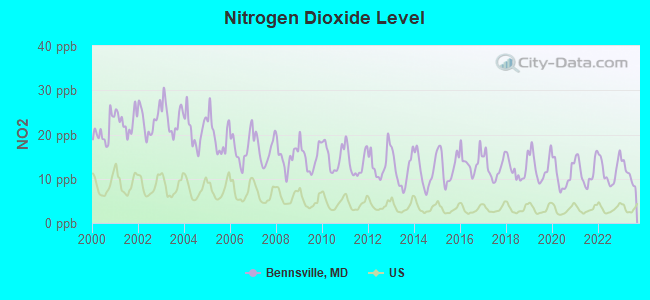
Nitrogen Dioxide (NO2) [ppb] level in 2023 was 11.1. This is significantly worse than average. Closest monitor was 4.5 miles away from the city center.
| City: | 11.1 |
| U.S.: | 5.1 |
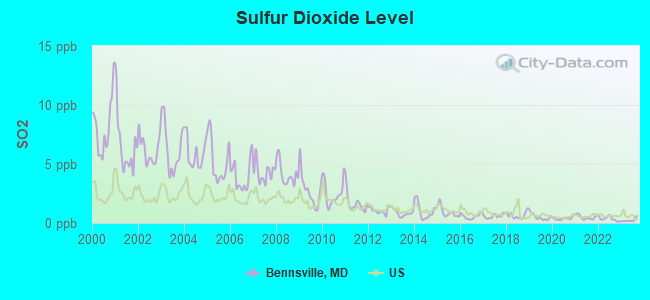
Sulfur Dioxide (SO2) [ppb] level in 2023 was 0.245. This is significantly better than average. Closest monitor was 4.5 miles away from the city center.
| City: | 0.245 |
| U.S.: | 1.515 |
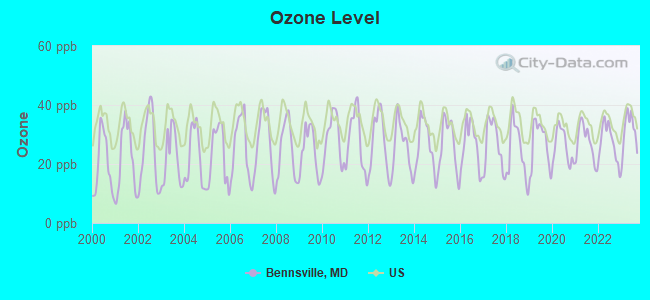
Ozone [ppb] level in 2023 was 31.2. This is about average. Closest monitor was 6.8 miles away from the city center.
| City: | 31.2 |
| U.S.: | 33.3 |
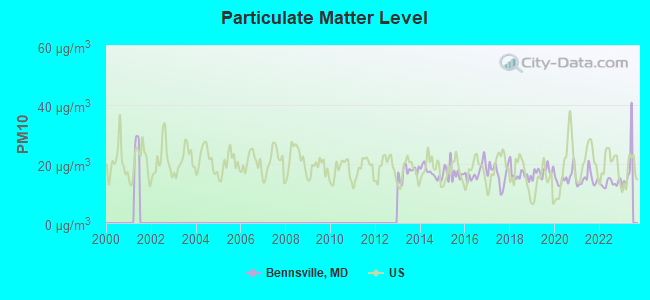
Particulate Matter (PM10) [µg/m3] level in 2022 was 13.6. This is significantly better than average. Closest monitor was 9.1 miles away from the city center.
| City: | 13.6 |
| U.S.: | 19.2 |
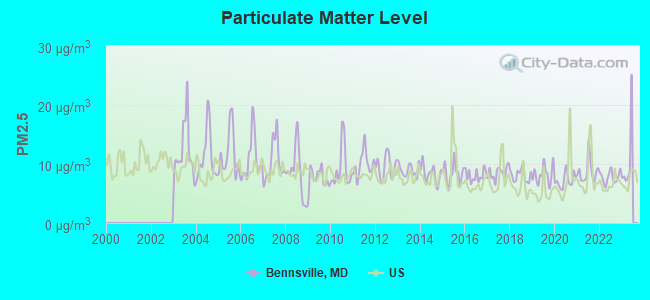
Particulate Matter (PM2.5) [µg/m3] level in 2022 was 7.79. This is about average. Closest monitor was 11.7 miles away from the city center.
| City: | 7.79 |
| U.S.: | 8.11 |
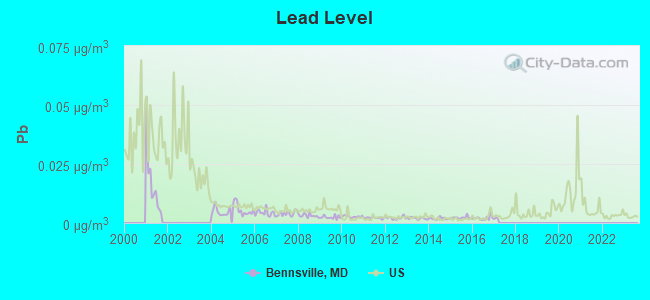
Lead (Pb) [µg/m3] level in 2016 was 0.00212. This is significantly better than average. Closest monitor was 4.5 miles away from the city center.
| City: | 0.00212 |
| U.S.: | 0.00931 |
Tornado activity:
Bennsville-area historical tornado activity is slightly above Maryland state average. It is 5% greater than the overall U.S. average.
On 4/28/2002, a category F4 (max. wind speeds 207-260 mph) tornado 10.7 miles away from the Bennsville place center killed 3 people and injured 122 people and caused $124 million in damages.
On 9/5/1979, a category F3 (max. wind speeds 158-206 mph) tornado 11.5 miles away from the place center killed one person and injured 6 people and caused between $500,000 and $5,000,000 in damages.
Earthquake activity:
Bennsville-area historical earthquake activity is significantly above Maryland state average. It is 57% smaller than the overall U.S. average.On 8/23/2011 at 17:51:04, a magnitude 5.8 (5.8 MW, Depth: 3.7 mi, Class: Moderate, Intensity: VI - VII) earthquake occurred 70.6 miles away from the city center
On 8/25/2011 at 05:07:52, a magnitude 4.5 (4.5 ML, Depth: 4.2 mi, Class: Light, Intensity: IV - V) earthquake occurred 70.1 miles away from Bennsville center
On 12/9/2003 at 20:59:18, a magnitude 4.5 (4.5 ML, Depth: 6.2 mi) earthquake occurred 83.6 miles away from the city center
On 12/9/2003 at 20:59:14, a magnitude 4.5 (4.5 MB, 4.5 LG) earthquake occurred 86.7 miles away from Bennsville center
On 1/16/1994 at 01:49:16, a magnitude 4.6 (4.6 MB, 4.6 LG, Depth: 3.1 mi) earthquake occurred 128.9 miles away from Bennsville center
On 9/25/1998 at 19:52:52, a magnitude 5.2 (4.8 MB, 4.3 MS, 5.2 LG, 4.5 MW, Depth: 3.1 mi) earthquake occurred 267.4 miles away from the city center
Magnitude types: regional Lg-wave magnitude (LG), body-wave magnitude (MB), local magnitude (ML), surface-wave magnitude (MS), moment magnitude (MW)
Natural disasters:
The number of natural disasters in Charles County (21) is greater than the US average (15).Major Disasters (Presidential) Declared: 16
Emergencies Declared: 5
Causes of natural disasters: Hurricanes: 7, Winter Storms: 6, Snowstorms: 4, Storms: 2, Tropical Storms: 2, Blizzard: 1, Flood: 1, Heavy Rain: 1, Ice Storm: 1, Snowfall: 1, Tornado: 1, Wind: 1, Other: 1 (Note: some incidents may be assigned to more than one category).
Hospitals and medical centers near Bennsville:
- WALDORF CENTER (Nursing Home, about 5 miles away; WALDORF, MD)
- WALDORF SURGICAL CTR AKA MED AND SUR CLINI (Hospital, about 6 miles away; WALDORF, MD)
- FMC - WALDORF (Dialysis Facility, about 6 miles away; WALDORF, MD)
- LAPLATA CENTER (Nursing Home, about 6 miles away; LAPLATA, MD)
- BMA - FORT WASHINGTON (Dialysis Facility, about 7 miles away; FORT WASHINGTON, MD)
- UNIVERSITY OF MD CHARLES REGIONAL MEDICAL CENTER Acute Care Hospitals (about 7 miles away; LA PLATA, MD)
- FORT WASHINGTON HEALTH AND REHABILITATION CENTER (Nursing Home, about 8 miles away; FORT WASHINGTON, MD)
Amtrak stations near Bennsville:
- 13 miles: LORTON (AUTO-TRAIN) (LORTON, 8006 LORTON RD.) . Services: ticket office, fully wheelchair accessible, enclosed waiting area, public restrooms, public payphones, vending machines, free short-term parking, call for taxi service.
- 14 miles: ALEXANDRIA (110 CALLAHAN DR.) . Services: ticket office, partially wheelchair accessible, enclosed waiting area, public restrooms, public payphones, vending machines, ATM, free short-term parking, free long-term parking, call for car rental service, call for taxi service, public transit connection.
- 14 miles: WOODBRIDGE (1040 EXPRESS WAY) . Services: partially wheelchair accessible, public payphones, vending machines, paid short-term parking, call for taxi service, public transit connection.
Colleges/universities with over 2000 students nearest to Bennsville:
- College of Southern Maryland (about 5 miles; La Plata, MD; Full-time enrollment: 5,775)
- Strayer University-Maryland (about 15 miles; Suitland, MD; FT enrollment: 2,748)
- Strayer University-Virginia (about 19 miles; Arlington, VA; FT enrollment: 7,005)
- Northern Virginia Community College (about 20 miles; Annandale, VA; FT enrollment: 35,721)
- George Washington University (about 20 miles; Washington, DC; FT enrollment: 18,928)
- Medtech Institute (about 20 miles; Falls Church, VA; FT enrollment: 2,900)
- Strayer University-Global Region (about 20 miles; Washington, DC; FT enrollment: 2,613)
Points of interest:
Notable locations in Bennsville: Bennsville Siding (A), Pomfret Siding (B). Display/hide their locations on the map
Church in Bennsville: Saint Josephs Church (A). Display/hide its location on the map
Cemetery: Saint Josephs Cemetery (1). Display/hide its location on the map
Lake: Cat Pond (A). Display/hide its location on the map
Streams, rivers, and creeks: Pole Branch (A), Old Womans Run (B). Display/hide their locations on the map
| This place: | 3.1 people |
| Maryland: | 2.6 people |
| This place: | 83.3% |
| Whole state: | 67.1% |
| This place: | 4.3% |
| Whole state: | 6.4% |
Likely homosexual households (counted as self-reported same-sex unmarried-partner households)
- Lesbian couples: 0.3% of all households
- Gay men: 0.2% of all households
| This place: | 1.5% |
| Whole state: | 8.5% |
| This place: | 0.8% |
| Whole state: | 4.2% |
For population 15 years and over in Bennsville:
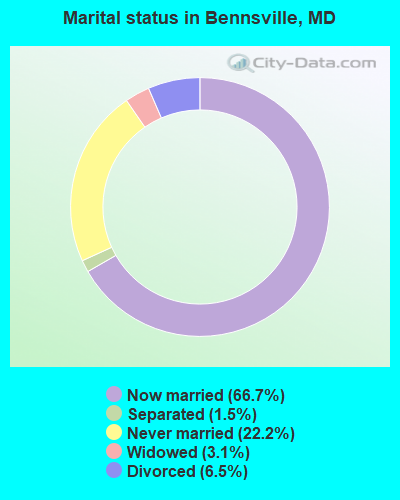
- Never married: 22.2%
- Now married: 66.7%
- Separated: 1.5%
- Widowed: 3.1%
- Divorced: 6.5%
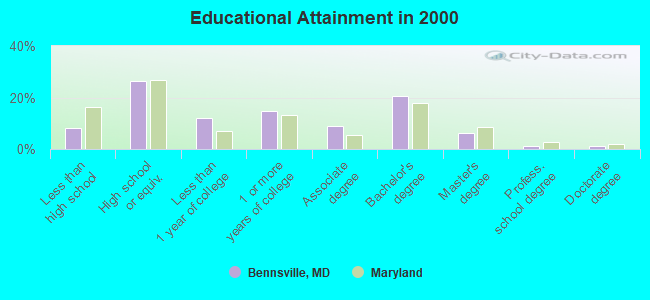
For population 25 years and over in Bennsville:
- High school or higher: 91.8%
- Bachelor's degree or higher: 29.3%
- Graduate or professional degree: 8.7%
- Unemployed: 2.2%
- Mean travel time to work (commute): 42.2 minutes
| Here: | 9.7 |
| Maryland average: | 12.7 |
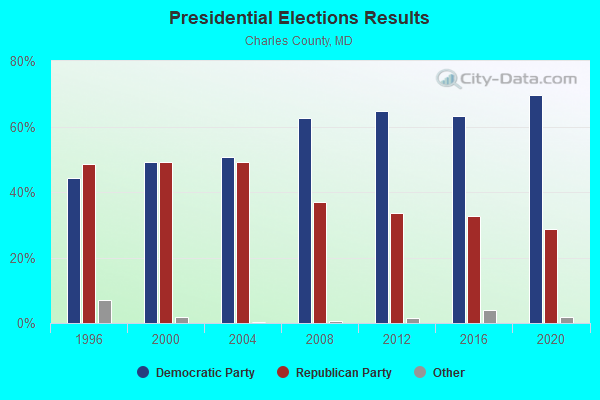
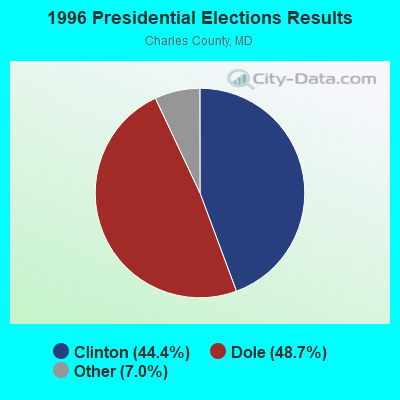
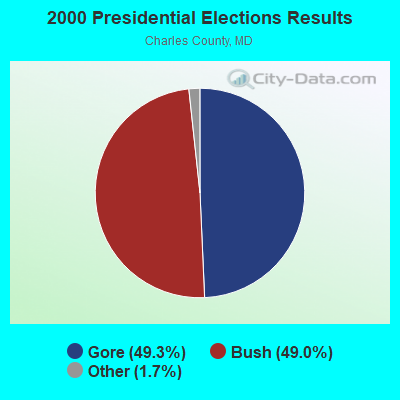
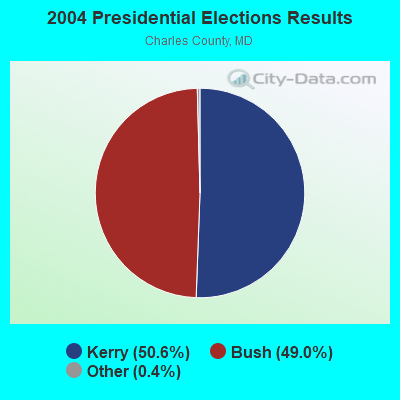
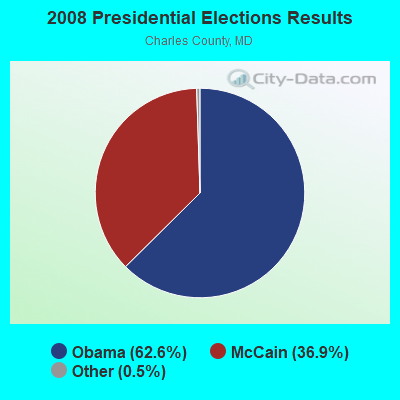
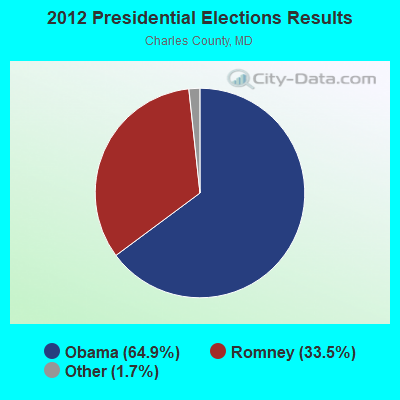
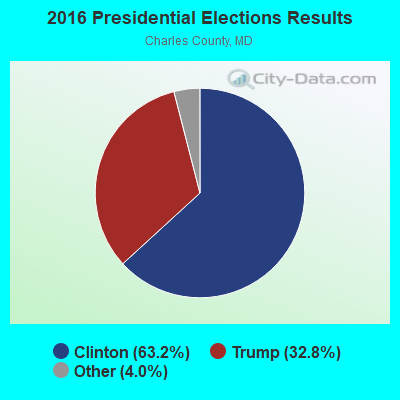
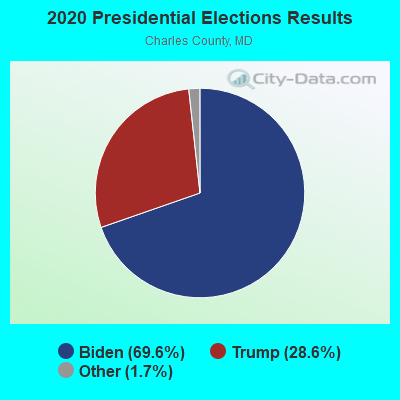
Graphs represent county-level data. Detailed 2008 Election Results
Religion statistics for Bennsville, MD (based on Charles County data)
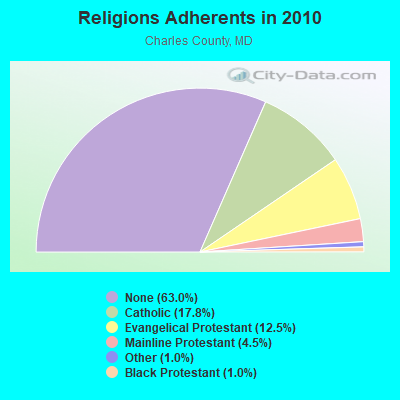
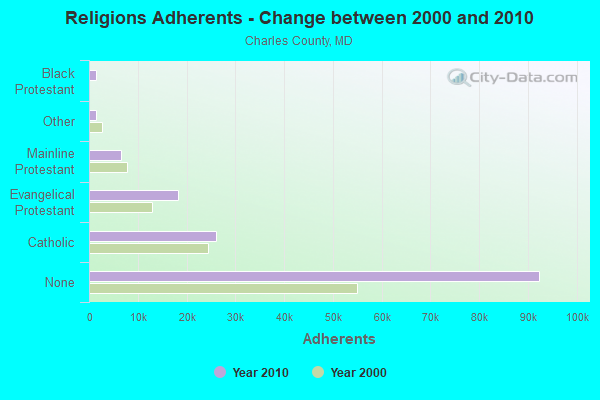
| Religion | Adherents | Congregations |
|---|---|---|
| Catholic | 26,146 | 12 |
| Evangelical Protestant | 18,323 | 72 |
| Mainline Protestant | 6,593 | 28 |
| Other | 1,512 | 7 |
| Black Protestant | 1,489 | 9 |
| Orthodox | 100 | 1 |
| None | 92,388 | - |
Food Environment Statistics:
| Charles County: | 1.57 / 10,000 pop. |
| Maryland: | 1.96 / 10,000 pop. |
| Here: | 0.14 / 10,000 pop. |
| State: | 0.07 / 10,000 pop. |
| Charles County: | 1.14 / 10,000 pop. |
| Maryland: | 1.22 / 10,000 pop. |
| Charles County: | 2.21 / 10,000 pop. |
| Maryland: | 2.05 / 10,000 pop. |
| Charles County: | 4.78 / 10,000 pop. |
| State: | 5.40 / 10,000 pop. |
| Here: | 9.2% |
| State: | 9.1% |
| Here: | 31.9% |
| Maryland: | 26.7% |
| Charles County: | 13.0% |
| Maryland: | 15.5% |
8.84% of this county's 2021 resident taxpayers lived in other counties in 2020 ($64,163 average adjusted gross income)
| Here: | 8.84% |
| Maryland average: | 7.42% |
0.09% of residents moved from foreign countries ($733 average AGI)
Charles County: 0.09% Maryland average: 0.05%
Top counties from which taxpayers relocated into this county between 2020 and 2021:
| from Prince George's County, MD | |
| from District of Columbia, DC | |
| from St. Mary's County, MD |
8.30% of this county's 2020 resident taxpayers moved to other counties in 2021 ($68,972 average adjusted gross income)
| Here: | 8.30% |
| Maryland average: | 7.91% |
0.07% of residents moved to foreign countries ($634 average AGI)
Charles County: 0.07% Maryland average: 0.04%
Top counties to which taxpayers relocated from this county between 2020 and 2021:
| to Prince George's County, MD | |
| to St. Mary's County, MD | |
| to Calvert County, MD |
Strongest AM radio stations in Bennsville:
- WWGB (1030 AM; daytime; 50 kW; INDIAN HEAD, MD; Owner: GOOD BODY MEDIA, LLC)
- WKDL (730 AM; 8 kW; ALEXANDRIA, VA; Owner: MEGA COMMUNICATIONS OF ALEXANDRIA LICENSEE, LLC)
- WPGC (1580 AM; 50 kW; MORNINGSIDE, MD; Owner: INFINITY WPGC(AM), INC.)
- WTEM (980 AM; 50 kW; WASHINGTON, DC; Owner: AMFM RADIO LICENSES, L.L.C.)
- WTOP (1500 AM; 50 kW; WASHINGTON, DC; Owner: BONNEVILLE HOLDING COMPANY)
- WUST (1120 AM; daytime; 20 kW; WASHINGTON, DC)
- WBIS (1190 AM; 50 kW; ANNAPOLIS, MD; Owner: NATIONS RADIO, LLC)
- WMET (1150 AM; 50 kW; GAITHERSBURG, MD; Owner: BELTWAY ACQUISITION CORPORATION)
- WCBM (680 AM; 50 kW; BALTIMORE, MD; Owner: WCBM MARYLAND, INC.)
- WKCW (1420 AM; 50 kW; WARRENTON, VA; Owner: WAY BROADCASTING, INC.)
- WKIK (1560 AM; daytime; 1 kW; LA PLATA, MD)
- WBAL (1090 AM; 50 kW; BALTIMORE, MD; Owner: HEARST RADIO, INC.)
- WABS (780 AM; daytime; 5 kW; ARLINGTON, VA; Owner: SALEM MEDIA OF VIRGINIA, INC.)
Strongest FM radio stations in Bennsville:
- WWZZ (104.1 FM; WALDORF, MD; Owner: BONNEVILLE HOLDING COMPANY)
- WJFK-FM (106.7 FM; MANASSAS, VA; Owner: INFINITY BROADCASTING CORP. OF WASHINGTON, DC)
- WRQX (107.3 FM; WASHINGTON, DC; Owner: WMAL, INC.)
- WHUR-FM (96.3 FM; WASHINGTON, DC; Owner: THE HOWARD UNIVERSITY)
- WPGC-FM (95.5 FM; MORNINGSIDE, MD; Owner: INFINITY BROADCASTING CORPORATION OF MARYLAND)
- WASH (97.1 FM; WASHINGTON, DC; Owner: AMFM RADIO LICENSES, L.L.C.)
- WETA (90.9 FM; WASHINGTON, DC; Owner: GREATER WASHINGTON EDUCATIONAL TELECOMMUNICATIONS ASSN.)
- WJZW (105.9 FM; WOODBRIDGE, VA; Owner: WMAL, INC.)
- WKYS (93.9 FM; WASHINGTON, DC; Owner: RADIO ONE LICENSES, LLC)
- WGTS (91.9 FM; TAKOMA PARK, MD; Owner: COLUMBIA UNION COLLEGE BROADCASTING, INC.)
- WARW (94.7 FM; BETHESDA, MD; Owner: INFINITY BROADCASTING OPERATIONS, INC.)
- WHFS (99.1 FM; ANNAPOLIS, MD; Owner: INFINITY BROADCASTING OPERATIONS, INC.)
- WIHT (99.5 FM; WASHINGTON, DC; Owner: AMFM RADIO LICENSES, L.L.C.)
- WMZQ-FM (98.7 FM; WASHINGTON, DC; Owner: AMFM RADIO LICENSES, L.L.C.)
- WAVA (105.1 FM; ARLINGTON, VA; Owner: SALEM MEDIA OF VIRGINIA, INC.)
- WWDC-FM (101.1 FM; WASHINGTON, DC; Owner: AMFM RADIO LICENSES, L.L.C.)
- WBIG-FM (100.3 FM; WASHINGTON, DC; Owner: AMFM RADIO LICENSES, L.L.C.)
- WBZS-FM (92.7 FM; PRINCE FREDERICK, MD; Owner: MEGA COMMUNICATIONS OF PRINCE FREDERICK LICENSEE, LLC)
- WCSP-FM (90.1 FM; WASHINGTON, DC; Owner: NATIONAL CABLE SATELLITE CORPORATION)
- WGMS-FM (103.5 FM; WASHINGTON, DC; Owner: BONNEVILLE HOLDING COMPANY)
TV broadcast stations around Bennsville:
- WIAV-LP (Channel 58; WASHINGTON, DC; Owner: ASIAVISION, INC.)
- WJLA-TV (Channel 7; WASHINGTON, DC; Owner: ACC LICENSEE, INC.)
- WUSA (Channel 9; WASHINGTON, DC; Owner: THE DETROIT NEWS, INC.)
- WTTG (Channel 5; WASHINGTON, DC; Owner: FOX TELEVISION STATIONS, INC.)
- WETA-TV (Channel 26; WASHINGTON, DC; Owner: THE GREATER WASHINGTON ED TELECOMM. ASSOC)
- WHUT-TV (Channel 32; WASHINGTON, DC; Owner: HOWARD UNIVERSITY)
- WBDC-TV (Channel 50; WASHINGTON, DC; Owner: WBDC BROADCASTING, INC.)
- WNVC (Channel 56; FAIRFAX, VA; Owner: COMMONWEALTH PUBLIC BROADCASTING CORPORATION)
- WDCA (Channel 20; WASHINGTON, DC; Owner: FOX TELEVISION STATIONS, INC.)
- WRC-TV (Channel 4; WASHINGTON, DC; Owner: NBC SUBSIDIARY (WRC-TV), INC.)
- WNVT (Channel 53; GOLDVEIN, VA; Owner: COMMONWEALTH PUBLIC BROADCASTING CORPORATION)
- WMPT (Channel 22; ANNAPOLIS, MD; Owner: MARYLAND PUBLIC BROADCASTING COMMISSION)
- WPXW (Channel 66; MANASSAS, VA; Owner: PAXSON WASHINGTON LICENSE, INC.)
- W28BY (Channel 63; BALTIMORE, MD; Owner: INFORMATION SUPER STATION, L.L.C.)
- WZDC-LP (Channel 64; WASHINGTON, DC; Owner: ONDA CAPITAL, INC.)
- WMDO-CA (Channel 30; WASHINGTON, DC; Owner: ENTRAVISION HOLDINGS, LLC)
- National Bridge Inventory (NBI) Statistics
- 9Number of bridges
- 75ft / 22.8mTotal length
- $103,000Total costs
- 129,740Total average daily traffic
- 6,556Total average daily truck traffic
- 106,359Total future (year 2010) average daily traffic
FCC Registered Microwave Towers:
2- WA54XC694, 2811 Knotweed (Lat: 38.639889 Lon: -76.998111), Type: Tank, Structure height: 50.3 m, Call Sign: WQPV428,
Assigned Frequencies: 11305.0 MHz, 11305.0 MHz, 11305.0 MHz, Grant Date: 08/23/2012, Expiration Date: 08/23/2022, Cancellation Date: 08/19/2022, Certifier: David Werblow, Registrant: Dla Piper LLP, 500 8th Street, Nw, Washington, DC 20004, Phone: (202) 799-4216, Fax: (202) 799-5616, Email:
- WA54XC756, 6980 Bensville Rd (Md46742-A) (Lat: 38.599194 Lon: -77.020056), Type: Mtower, Structure height: 57 m, Overall height: 60.7 m, Call Sign: WQPV504,
Assigned Frequencies: 11465.0 MHz, 11545.0 MHz, 11465.0 MHz, 11545.0 MHz, 11465.0 MHz, 11545.0 MHz, 11585.0 MHz, 11585.0 MHz, 11585.0 MHz, 11225.0 MHz... (+5 more), Grant Date: 10/13/2022, Expiration Date: 08/23/2032, Certifier: David Werblow, Registrant: T-Mobile Usa, Inc., 12920 Se 38th St, Bellevue, WA 98006, Phone: (425) 383-8401, Fax: (425) 383-4040, Email:
| Home Mortgage Disclosure Act Aggregated Statistics For Year 2009 (Based on 1 partial tract) | ||||||||||||
| A) FHA, FSA/RHS & VA Home Purchase Loans | B) Conventional Home Purchase Loans | C) Refinancings | D) Home Improvement Loans | F) Non-occupant Loans on < 5 Family Dwellings (A B C & D) | G) Loans On Manufactured Home Dwelling (A B C & D) | |||||||
|---|---|---|---|---|---|---|---|---|---|---|---|---|
| Number | Average Value | Number | Average Value | Number | Average Value | Number | Average Value | Number | Average Value | Number | Average Value | |
| LOANS ORIGINATED | 139 | $353,266 | 27 | $306,014 | 278 | $288,089 | 19 | $84,684 | 5 | $235,308 | 0 | $0 |
| APPLICATIONS APPROVED, NOT ACCEPTED | 9 | $360,506 | 4 | $311,650 | 23 | $301,462 | 4 | $66,840 | 3 | $229,243 | 0 | $0 |
| APPLICATIONS DENIED | 13 | $303,598 | 4 | $224,275 | 121 | $320,017 | 14 | $30,429 | 9 | $157,749 | 1 | $38,650 |
| APPLICATIONS WITHDRAWN | 32 | $349,400 | 6 | $237,967 | 111 | $299,383 | 6 | $114,085 | 6 | $150,188 | 0 | $0 |
| FILES CLOSED FOR INCOMPLETENESS | 0 | $0 | 1 | $215,820 | 19 | $309,447 | 2 | $82,140 | 1 | $161,060 | 0 | $0 |
Detailed HMDA statistics for the following Tracts: 8507.01
| Private Mortgage Insurance Companies Aggregated Statistics For Year 2009 (Based on 1 partial tract) | ||||
| A) Conventional Home Purchase Loans | B) Refinancings | |||
|---|---|---|---|---|
| Number | Average Value | Number | Average Value | |
| LOANS ORIGINATED | 4 | $355,942 | 6 | $297,827 |
| APPLICATIONS APPROVED, NOT ACCEPTED | 3 | $332,590 | 2 | $465,865 |
| APPLICATIONS DENIED | 0 | $0 | 2 | $234,745 |
| APPLICATIONS WITHDRAWN | 0 | $0 | 2 | $226,290 |
| FILES CLOSED FOR INCOMPLETENESS | 0 | $0 | 1 | $453,380 |
Detailed PMIC statistics for the following Tracts: 8507.01
- 43.9%Electricity
- 32.3%Fuel oil, kerosene, etc.
- 18.9%Utility gas
- 3.1%Bottled, tank, or LP gas
- 1.2%Wood
- 0.7%Other fuel
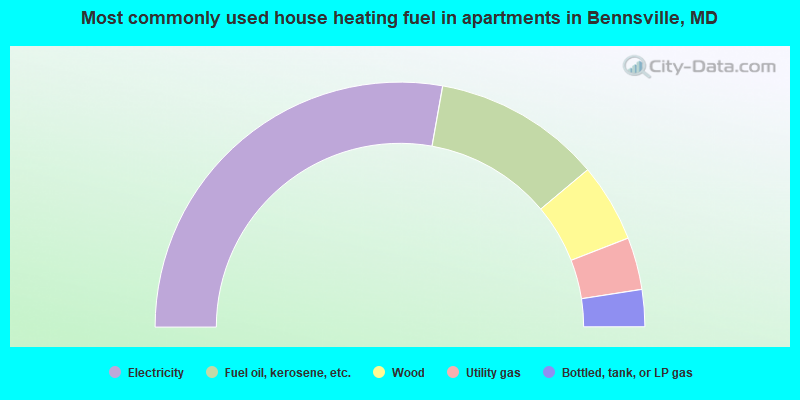
- 55.6%Electricity
- 22.2%Fuel oil, kerosene, etc.
- 10.4%Wood
- 6.9%Utility gas
- 4.9%Bottled, tank, or LP gas
Bennsville compared to Maryland state average:
- Median household income above state average.
- Unemployed percentage significantly below state average.
- Black race population percentage above state average.
- Foreign-born population percentage significantly below state average.
- Renting percentage significantly below state average.
- Length of stay since moving in significantly above state average.
- Number of rooms per house significantly below state average.
- House age significantly below state average.
Bennsville on our top lists:
- #3 on the list of "Top 101 cities with largest percentage of females in occupations: computer specialists (population 5,000+)"
- #8 on the list of "Top 101 cities with largest percentage of females in occupations: business operations specialists (population 5,000+)"
- #10 on the list of "Top 101 cities that people commute from (largest negative percentage daily daytime population change due to commuting) (population 5,000+)"
- #11 on the list of "Top 101 cities with largest percentage of females in occupations: legal support workers (population 5,000+)"
- #11 on the list of "Top 101 cities with largest percentage of females in occupations: mathematical science occupations (population 5,000+)"
- #13 on the list of "Top 101 cities with largest percentage of males in occupations: plant and system operators (population 5,000+)"
- #16 on the list of "Top 101 cities with largest percentage of males in occupations: mathematical science occupations (population 5,000+)"
- #16 on the list of "Top 101 cities with largest percentage of females in industries: religious, grantmaking, civic, professional, and similar organizations (population 5,000+)"
- #23 on the list of "Top 101 cities with the smallest household incomes disparities (population 5,000+)"
- #24 on the list of "Top 101 cities with largest percentage of females in industries: radio, tv, and computer stores (population 5,000+)"
- #32 on the list of "Top 101 cities with largest percentage of males in industries: broadcasting and telecommunications (population 5,000+)"
- #33 on the list of "Top 101 cities with largest percentage of females in industries: public administration (population 5,000+)"
- #33 on the list of "Top 100 cities with longest commuting times (pop. 5,000+)"
- #36 on the list of "Top 101 cities with largest percentage of males in industries: data processing, libraries, and other information services (population 5,000+)"
- #42 on the list of "Top 101 cities with the most cars per house, population 5,000+"
- #45 on the list of "Top 101 cities with largest percentage of females in industries: sporting goods, camera, and hobby and toy stores (population 5,000+)"
- #46 on the list of "Top 101 cities with largest percentage of males in industries: air transportation (population 5,000+)"
- #66 on the list of "Top 100 low-educated but high-earning cities"
- #69 on the list of "Top 101 cities with largest percentage of males in industries: jewelry, luggage, and leather goods stores (population 5,000+)"
- #79 on the list of "Top 101 cities with largest percentage of males in industries: other transportation, and support activities, and couriers (population 5,000+)"
- #59 (20675) on the list of "Top 101 zip codes with the lowest 2012 average net capital gain/loss (pop 1,000+)"
- #84 (20603) on the list of "Top 101 zip codes with the lowest 2012 average reported profit/loss from business (pop 5,000+)"
- #85 on the list of "Top 101 counties with the highest percentage of residents relocating from foreign countries between 2010 and 2011 (pop. 50,000+)"
- #86 on the list of "Top 101 counties with highest percentage of residents voting for Obama (Democrat) in the 2012 Presidential Election (pop. 50,000+)"
- #90 on the list of "Top 101 counties with the best general health status score of residents (1-5), 3 years of data"
- #92 on the list of "Top 101 counties with the highest percentage of residents that visited a dentist within the past year"
- #96 on the list of "Top 101 counties with the lowest number of deaths per 1000 residents 2007-2013 (pop. 50,000+)"