Cherryland, California Submit your own pictures of this place and show them to the world
OSM Map
General Map
Google Map
MSN Map
OSM Map
General Map
Google Map
MSN Map
OSM Map
General Map
Google Map
MSN Map
OSM Map
General Map
Google Map
MSN Map
Please wait while loading the map...
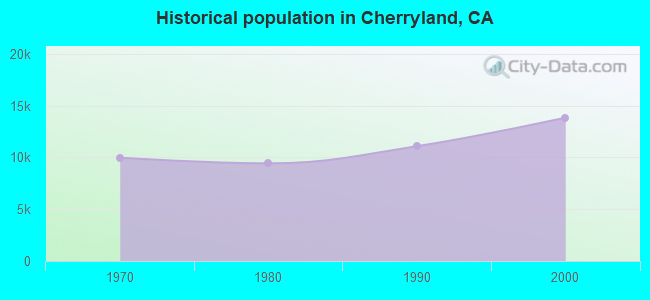
Population in 2010: 14,728. Population change since 2000: +6.4%Males: 7,575 Females: 7,153
March 2022 cost of living index in Cherryland: 125.1 (high, U.S. average is 100) Percentage of residents living in poverty in 2022: 11.7%for White Non-Hispanic residents , 26.2% for Black residents , 10.5% for Hispanic or Latino residents , 2.4% for American Indian residents , 1.1% for Native Hawaiian and other Pacific Islander residents , 13.4% for other race residents , 5.1% for two or more races residents )Business Search - 14 Million verified businesses
Data:
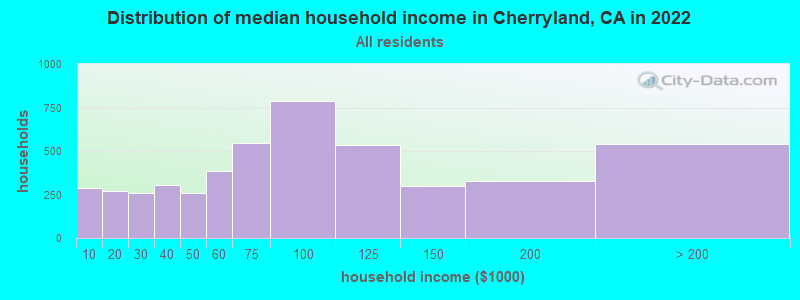
Median household income ($)
Median household income (% change since 2000)
Household income diversity
Ratio of average income to average house value (%)
Ratio of average income to average rent
Median household income ($) - White
Median household income ($) - Black or African American
Median household income ($) - Asian
Median household income ($) - Hispanic or Latino
Median household income ($) - American Indian and Alaska Native
Median household income ($) - Multirace
Median household income ($) - Other Race
Median household income for houses/condos with a mortgage ($)
Median household income for apartments without a mortgage ($)
Races - White alone (%)
Races - White alone (% change since 2000)
Races - Black alone (%)
Races - Black alone (% change since 2000)
Races - American Indian alone (%)
Races - American Indian alone (% change since 2000)
Races - Asian alone (%)
Races - Asian alone (% change since 2000)
Races - Hispanic (%)
Races - Hispanic (% change since 2000)
Races - Native Hawaiian and Other Pacific Islander alone (%)
Races - Native Hawaiian and Other Pacific Islander alone (% change since 2000)
Races - Two or more races (%)
Races - Two or more races (% change since 2000)
Races - Other race alone (%)
Races - Other race alone (% change since 2000)
Racial diversity
Unemployment (%)
Unemployment (% change since 2000)
Unemployment (%) - White
Unemployment (%) - Black or African American
Unemployment (%) - Asian
Unemployment (%) - Hispanic or Latino
Unemployment (%) - American Indian and Alaska Native
Unemployment (%) - Multirace
Unemployment (%) - Other Race
Population density (people per square mile)
Population - Males (%)
Population - Females (%)
Population - Males (%) - White
Population - Males (%) - Black or African American
Population - Males (%) - Asian
Population - Males (%) - Hispanic or Latino
Population - Males (%) - American Indian and Alaska Native
Population - Males (%) - Multirace
Population - Males (%) - Other Race
Population - Females (%) - White
Population - Females (%) - Black or African American
Population - Females (%) - Asian
Population - Females (%) - Hispanic or Latino
Population - Females (%) - American Indian and Alaska Native
Population - Females (%) - Multirace
Population - Females (%) - Other Race
Coronavirus confirmed cases (Apr 30, 2024)
Deaths caused by coronavirus (Apr 30, 2024)
Coronavirus confirmed cases (per 100k population) (Apr 30, 2024)
Deaths caused by coronavirus (per 100k population) (Apr 30, 2024)
Daily increase in number of cases (Apr 30, 2024)
Weekly increase in number of cases (Apr 30, 2024)
Cases doubled (in days) (Apr 30, 2024)
Hospitalized patients (Apr 18, 2022)
Negative test results (Apr 18, 2022)
Total test results (Apr 18, 2022)
COVID Vaccine doses distributed (per 100k population) (Sep 19, 2023)
COVID Vaccine doses administered (per 100k population) (Sep 19, 2023)
COVID Vaccine doses distributed (Sep 19, 2023)
COVID Vaccine doses administered (Sep 19, 2023)
Likely homosexual households (%)
Likely homosexual households (% change since 2000)
Likely homosexual households - Lesbian couples (%)
Likely homosexual households - Lesbian couples (% change since 2000)
Likely homosexual households - Gay men (%)
Likely homosexual households - Gay men (% change since 2000)
Cost of living index
Median gross rent ($)
Median contract rent ($)
Median monthly housing costs ($)
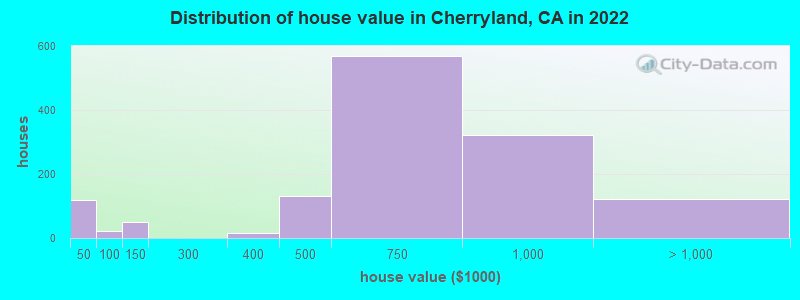
Median house or condo value ($)
Median house or condo value ($ change since 2000)
Mean house or condo value by units in structure - 1, detached ($)
Mean house or condo value by units in structure - 1, attached ($)
Mean house or condo value by units in structure - 2 ($)
Mean house or condo value by units in structure by units in structure - 3 or 4 ($)
Mean house or condo value by units in structure - 5 or more ($)
Mean house or condo value by units in structure - Boat, RV, van, etc. ($)
Mean house or condo value by units in structure - Mobile home ($)
Median house or condo value ($) - White
Median house or condo value ($) - Black or African American
Median house or condo value ($) - Asian
Median house or condo value ($) - Hispanic or Latino
Median house or condo value ($) - American Indian and Alaska Native
Median house or condo value ($) - Multirace
Median house or condo value ($) - Other Race
Median resident age
Resident age diversity
Median resident age - Males
Median resident age - Females
Median resident age - White
Median resident age - Black or African American
Median resident age - Asian
Median resident age - Hispanic or Latino
Median resident age - American Indian and Alaska Native
Median resident age - Multirace
Median resident age - Other Race
Median resident age - Males - White
Median resident age - Males - Black or African American
Median resident age - Males - Asian
Median resident age - Males - Hispanic or Latino
Median resident age - Males - American Indian and Alaska Native
Median resident age - Males - Multirace
Median resident age - Males - Other Race
Median resident age - Females - White
Median resident age - Females - Black or African American
Median resident age - Females - Asian
Median resident age - Females - Hispanic or Latino
Median resident age - Females - American Indian and Alaska Native
Median resident age - Females - Multirace
Median resident age - Females - Other Race
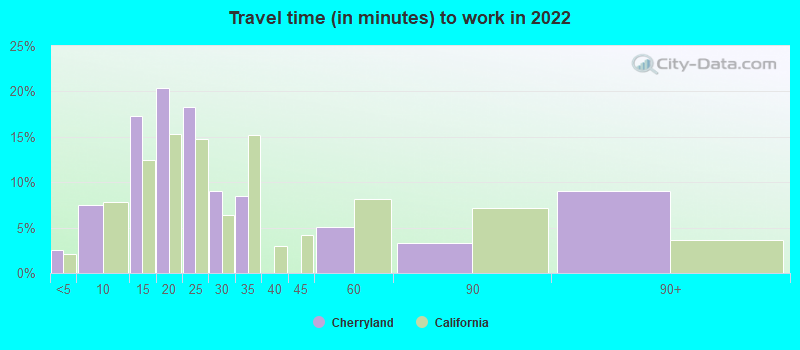
Commute - mean travel time to work (minutes)
Travel time to work - Less than 5 minutes (%)
Travel time to work - Less than 5 minutes (% change since 2000)
Travel time to work - 5 to 9 minutes (%)
Travel time to work - 5 to 9 minutes (% change since 2000)
Travel time to work - 10 to 19 minutes (%)
Travel time to work - 10 to 19 minutes (% change since 2000)
Travel time to work - 20 to 29 minutes (%)
Travel time to work - 20 to 29 minutes (% change since 2000)
Travel time to work - 30 to 39 minutes (%)
Travel time to work - 30 to 39 minutes (% change since 2000)
Travel time to work - 40 to 59 minutes (%)
Travel time to work - 40 to 59 minutes (% change since 2000)
Travel time to work - 60 to 89 minutes (%)
Travel time to work - 60 to 89 minutes (% change since 2000)
Travel time to work - 90 or more minutes (%)
Travel time to work - 90 or more minutes (% change since 2000)
Marital status - Never married (%)
Marital status - Now married (%)
Marital status - Separated (%)
Marital status - Widowed (%)
Marital status - Divorced (%)
Median family income ($)
Median family income (% change since 2000)
Median non-family income ($)
Median non-family income (% change since 2000)
Median per capita income ($)
Median per capita income (% change since 2000)
Median family income ($) - White
Median family income ($) - Black or African American
Median family income ($) - Asian
Median family income ($) - Hispanic or Latino
Median family income ($) - American Indian and Alaska Native
Median family income ($) - Multirace
Median family income ($) - Other Race
Median year house/condo built
Median year apartment built
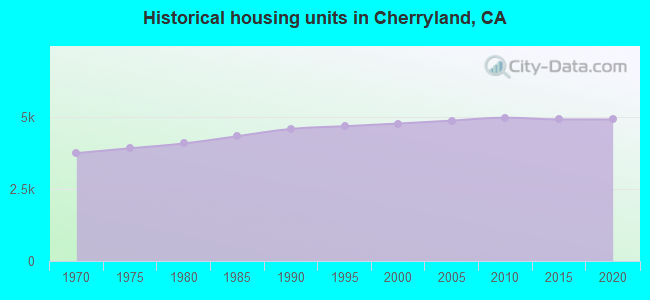
Year house built - Built 2005 or later (%)
Year house built - Built 2000 to 2004 (%)
Year house built - Built 1990 to 1999 (%)
Year house built - Built 1980 to 1989 (%)
Year house built - Built 1970 to 1979 (%)
Year house built - Built 1960 to 1969 (%)
Year house built - Built 1950 to 1959 (%)
Year house built - Built 1940 to 1949 (%)
Year house built - Built 1939 or earlier (%)
Average household size
Household density (households per square mile)
Average household size - White
Average household size - Black or African American
Average household size - Asian
Average household size - Hispanic or Latino
Average household size - American Indian and Alaska Native
Average household size - Multirace
Average household size - Other Race
Occupied housing units (%)
Vacant housing units (%)
Owner occupied housing units (%)
Renter occupied housing units (%)
Vacancy status - For rent (%)
Vacancy status - For sale only (%)
Vacancy status - Rented or sold, not occupied (%)
Vacancy status - For seasonal, recreational, or occasional use (%)
Vacancy status - For migrant workers (%)
Vacancy status - Other vacant (%)
Residents with income below the poverty level (%)
Residents with income below 50% of the poverty level (%)
Children below poverty level (%)
Poor families by family type - Married-couple family (%)
Poor families by family type - Male, no wife present (%)
Poor families by family type - Female, no husband present (%)
Poverty status for native-born residents (%)
Poverty status for foreign-born residents (%)
Poverty among high school graduates not in families (%)
Poverty among people who did not graduate high school not in families (%)
Residents with income below the poverty level (%) - White
Residents with income below the poverty level (%) - Black or African American
Residents with income below the poverty level (%) - Asian
Residents with income below the poverty level (%) - Hispanic or Latino
Residents with income below the poverty level (%) - American Indian and Alaska Native
Residents with income below the poverty level (%) - Multirace
Residents with income below the poverty level (%) - Other Race
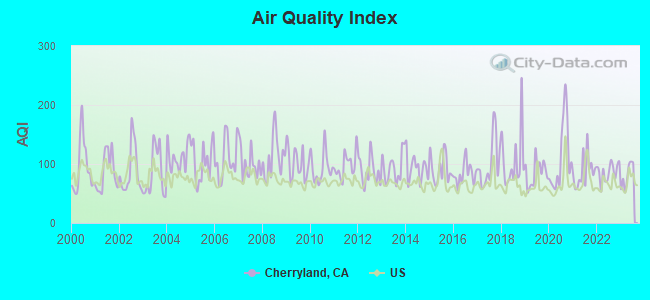
Air pollution - Air Quality Index (AQI)
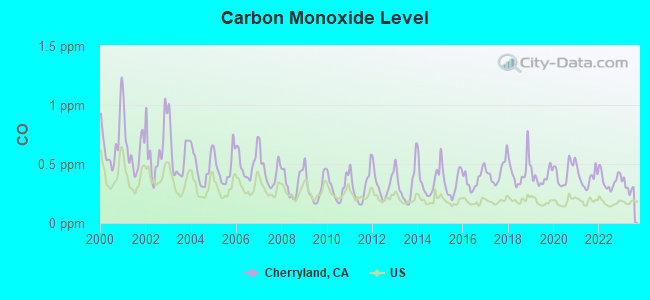
Air pollution - CO
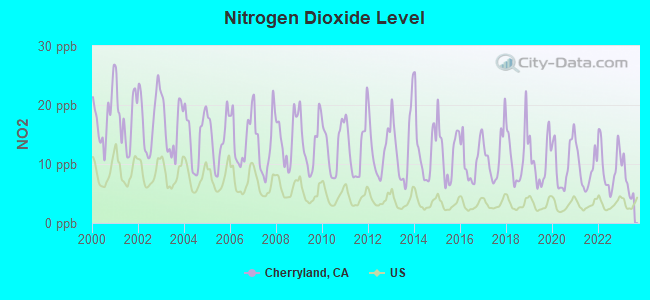
Air pollution - NO2
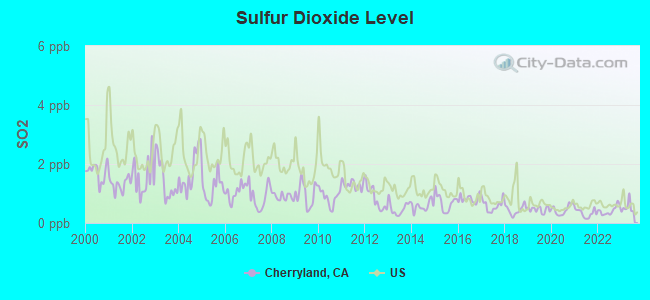
Air pollution - SO2
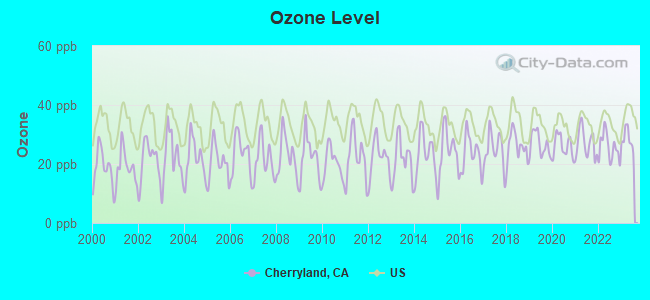
Air pollution - Ozone
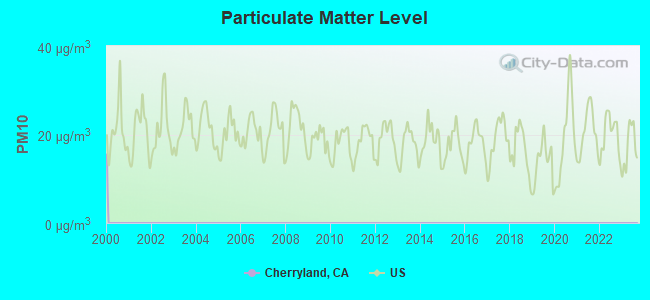
Air pollution - PM10
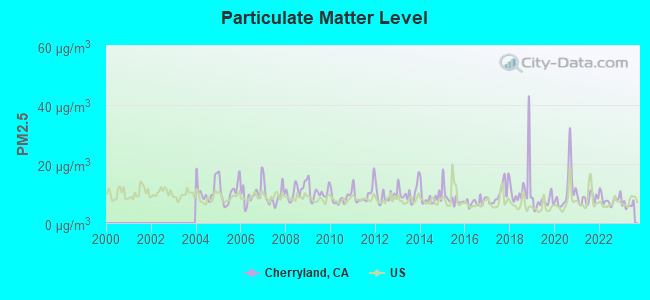
Air pollution - PM25
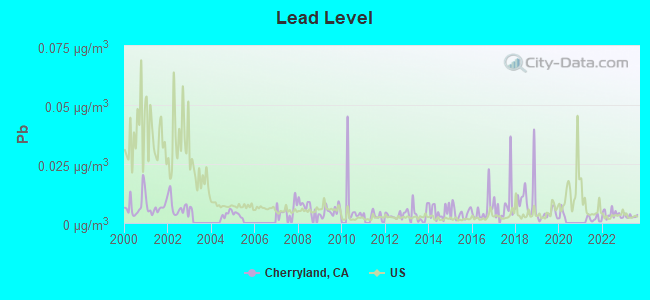
Air pollution - Pb
Crime - Murders per 100,000 population
Crime - Rapes per 100,000 population
Crime - Robberies per 100,000 population
Crime - Assaults per 100,000 population
Crime - Burglaries per 100,000 population
Crime - Thefts per 100,000 population
Crime - Auto thefts per 100,000 population
Crime - Arson per 100,000 population
Crime - City-data.com crime index
Crime - Violent crime index
Crime - Property crime index
Crime - Murders per 100,000 population (5 year average)
Crime - Rapes per 100,000 population (5 year average)
Crime - Robberies per 100,000 population (5 year average)
Crime - Assaults per 100,000 population (5 year average)
Crime - Burglaries per 100,000 population (5 year average)
Crime - Thefts per 100,000 population (5 year average)
Crime - Auto thefts per 100,000 population (5 year average)
Crime - Arson per 100,000 population (5 year average)
Crime - City-data.com crime index (5 year average)
Crime - Violent crime index (5 year average)
Crime - Property crime index (5 year average)
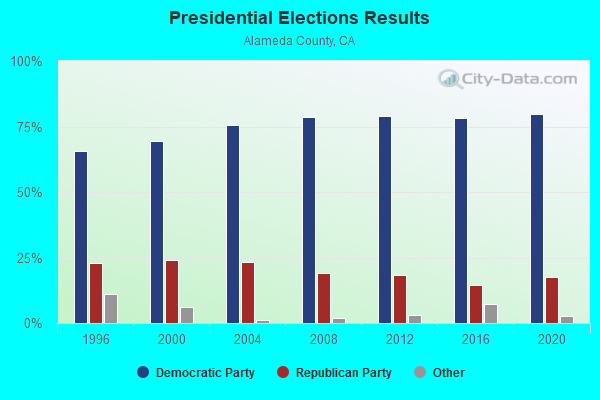
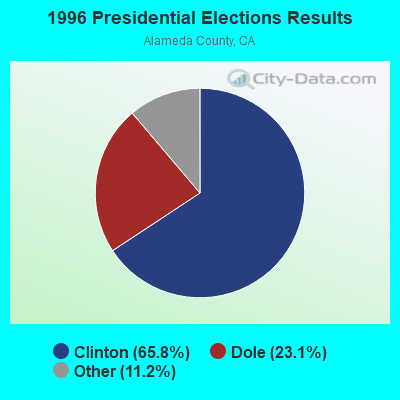
1996 Presidential Elections Results (%) - Democratic Party (Clinton)
1996 Presidential Elections Results (%) - Republican Party (Dole)
1996 Presidential Elections Results (%) - Other
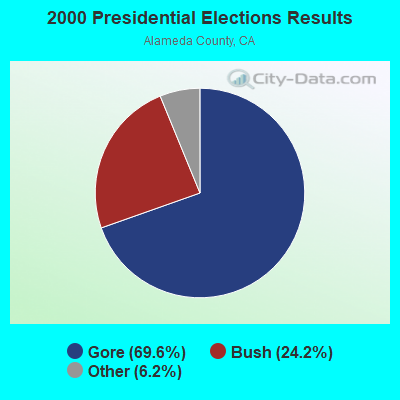
2000 Presidential Elections Results (%) - Democratic Party (Gore)
2000 Presidential Elections Results (%) - Republican Party (Bush)
2000 Presidential Elections Results (%) - Other
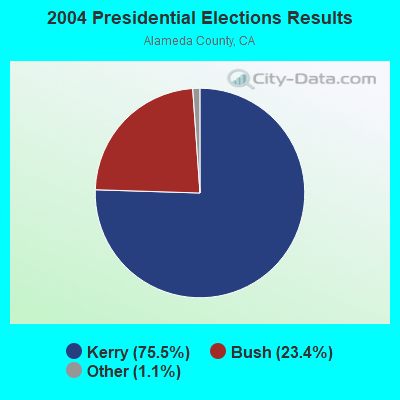
2004 Presidential Elections Results (%) - Democratic Party (Kerry)
2004 Presidential Elections Results (%) - Republican Party (Bush)
2004 Presidential Elections Results (%) - Other
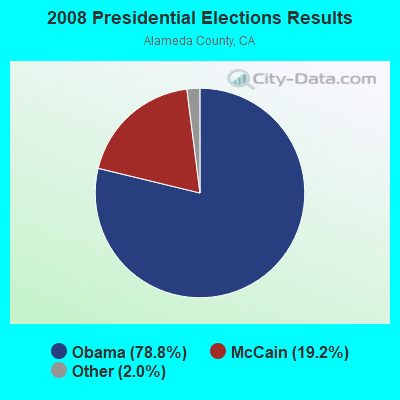
2008 Presidential Elections Results (%) - Democratic Party (Obama)
2008 Presidential Elections Results (%) - Republican Party (McCain)
2008 Presidential Elections Results (%) - Other
2012 Presidential Elections Results (%) - Democratic Party (Obama)
2012 Presidential Elections Results (%) - Republican Party (Romney)
2012 Presidential Elections Results (%) - Other
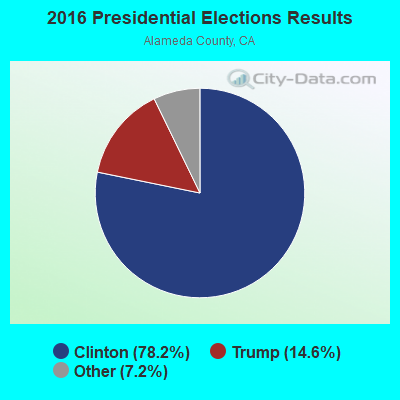
2016 Presidential Elections Results (%) - Democratic Party (Clinton)
2016 Presidential Elections Results (%) - Republican Party (Trump)
2016 Presidential Elections Results (%) - Other
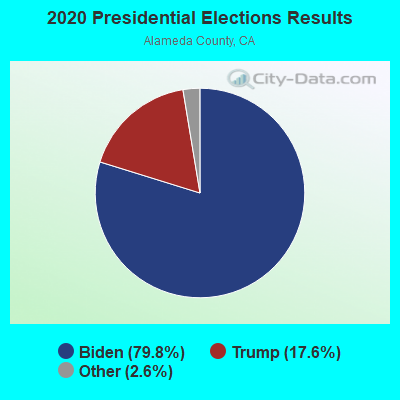
2020 Presidential Elections Results (%) - Democratic Party (Biden)
2020 Presidential Elections Results (%) - Republican Party (Trump)
2020 Presidential Elections Results (%) - Other
Ancestries Reported - Arab (%)
Ancestries Reported - Czech (%)
Ancestries Reported - Danish (%)
Ancestries Reported - Dutch (%)
Ancestries Reported - English (%)
Ancestries Reported - French (%)
Ancestries Reported - French Canadian (%)
Ancestries Reported - German (%)
Ancestries Reported - Greek (%)
Ancestries Reported - Hungarian (%)
Ancestries Reported - Irish (%)
Ancestries Reported - Italian (%)
Ancestries Reported - Lithuanian (%)
Ancestries Reported - Norwegian (%)
Ancestries Reported - Polish (%)
Ancestries Reported - Portuguese (%)
Ancestries Reported - Russian (%)
Ancestries Reported - Scotch-Irish (%)
Ancestries Reported - Scottish (%)
Ancestries Reported - Slovak (%)
Ancestries Reported - Subsaharan African (%)
Ancestries Reported - Swedish (%)
Ancestries Reported - Swiss (%)
Ancestries Reported - Ukrainian (%)
Ancestries Reported - United States (%)
Ancestries Reported - Welsh (%)
Ancestries Reported - West Indian (%)
Ancestries Reported - Other (%)
Educational Attainment - No schooling completed (%)
Educational Attainment - Less than high school (%)
Educational Attainment - High school or equivalent (%)
Educational Attainment - Less than 1 year of college (%)
Educational Attainment - 1 or more years of college (%)
Educational Attainment - Associate degree (%)
Educational Attainment - Bachelor's degree (%)
Educational Attainment - Master's degree (%)
Educational Attainment - Professional school degree (%)
Educational Attainment - Doctorate degree (%)
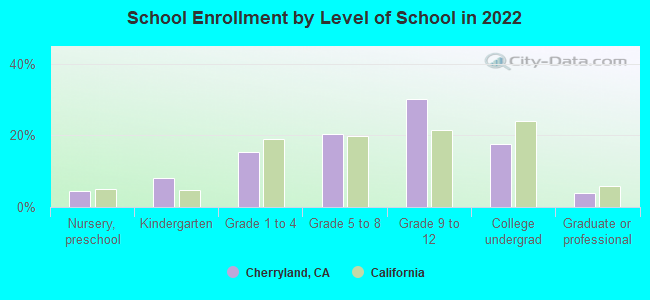
School Enrollment - Nursery, preschool (%)
School Enrollment - Kindergarten (%)
School Enrollment - Grade 1 to 4 (%)
School Enrollment - Grade 5 to 8 (%)
School Enrollment - Grade 9 to 12 (%)
School Enrollment - College undergrad (%)
School Enrollment - Graduate or professional (%)
School Enrollment - Not enrolled in school (%)
School enrollment - Public schools (%)
School enrollment - Private schools (%)
School enrollment - Not enrolled (%)
Median number of rooms in houses and condos
Median number of rooms in apartments
Housing units lacking complete plumbing facilities (%)
Housing units lacking complete kitchen facilities (%)
Density of houses
Urban houses (%)
Rural houses (%)
Households with people 60 years and over (%)
Households with people 65 years and over (%)
Households with people 75 years and over (%)
Households with one or more nonrelatives (%)
Households with no nonrelatives (%)
Population in households (%)
Family households (%)
Nonfamily households (%)
Population in families (%)
Family households with own children (%)
Median number of bedrooms in owner occupied houses
Mean number of bedrooms in owner occupied houses
Median number of bedrooms in renter occupied houses
Mean number of bedrooms in renter occupied houses
Median number of vehichles in owner occupied houses
Mean number of vehichles in owner occupied houses
Median number of vehichles in renter occupied houses
Mean number of vehichles in renter occupied houses
Mortgage status - with mortgage (%)
Mortgage status - with second mortgage (%)
Mortgage status - with home equity loan (%)
Mortgage status - with both second mortgage and home equity loan (%)
Mortgage status - without a mortgage (%)
Average family size
Average family size - White
Average family size - Black or African American
Average family size - Asian
Average family size - Hispanic or Latino
Average family size - American Indian and Alaska Native
Average family size - Multirace
Average family size - Other Race
Geographical mobility - Same house 1 year ago (%)
Geographical mobility - Moved within same county (%)
Geographical mobility - Moved from different county within same state (%)
Geographical mobility - Moved from different state (%)
Geographical mobility - Moved from abroad (%)
Place of birth - Born in state of residence (%)
Place of birth - Born in other state (%)
Place of birth - Native, outside of US (%)
Place of birth - Foreign born (%)
Housing units in structures - 1, detached (%)
Housing units in structures - 1, attached (%)
Housing units in structures - 2 (%)
Housing units in structures - 3 or 4 (%)
Housing units in structures - 5 to 9 (%)
Housing units in structures - 10 to 19 (%)
Housing units in structures - 20 to 49 (%)
Housing units in structures - 50 or more (%)
Housing units in structures - Mobile home (%)
Housing units in structures - Boat, RV, van, etc. (%)
House/condo owner moved in on average (years ago)
Renter moved in on average (years ago)
Year householder moved into unit - Moved in 1999 to March 2000 (%)
Year householder moved into unit - Moved in 1995 to 1998 (%)
Year householder moved into unit - Moved in 1990 to 1994 (%)
Year householder moved into unit - Moved in 1980 to 1989 (%)
Year householder moved into unit - Moved in 1970 to 1979 (%)
Year householder moved into unit - Moved in 1969 or earlier (%)
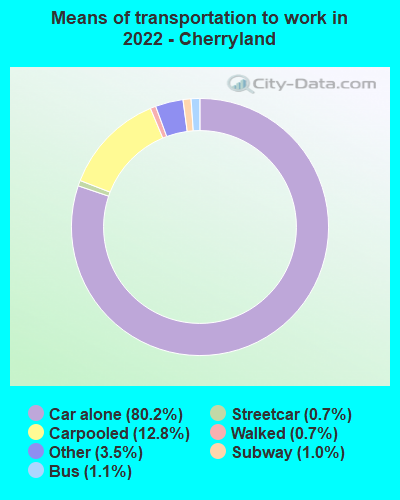
Means of transportation to work - Drove car alone (%)
Means of transportation to work - Carpooled (%)
Means of transportation to work - Public transportation (%)
Means of transportation to work - Bus or trolley bus (%)
Means of transportation to work - Streetcar or trolley car (%)
Means of transportation to work - Subway or elevated (%)
Means of transportation to work - Railroad (%)
Means of transportation to work - Ferryboat (%)
Means of transportation to work - Taxicab (%)
Means of transportation to work - Motorcycle (%)
Means of transportation to work - Bicycle (%)
Means of transportation to work - Walked (%)
Means of transportation to work - Other means (%)
Working at home (%)
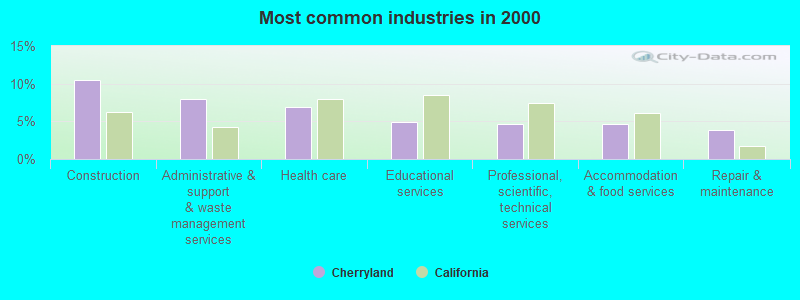
Industry diversity
Most Common Industries - Agriculture, forestry, fishing and hunting, and mining (%)
Most Common Industries - Agriculture, forestry, fishing and hunting (%)
Most Common Industries - Mining, quarrying, and oil and gas extraction (%)
Most Common Industries - Construction (%)
Most Common Industries - Manufacturing (%)
Most Common Industries - Wholesale trade (%)
Most Common Industries - Retail trade (%)
Most Common Industries - Transportation and warehousing, and utilities (%)
Most Common Industries - Transportation and warehousing (%)
Most Common Industries - Utilities (%)
Most Common Industries - Information (%)
Most Common Industries - Finance and insurance, and real estate and rental and leasing (%)
Most Common Industries - Finance and insurance (%)
Most Common Industries - Real estate and rental and leasing (%)
Most Common Industries - Professional, scientific, and management, and administrative and waste management services (%)
Most Common Industries - Professional, scientific, and technical services (%)
Most Common Industries - Management of companies and enterprises (%)
Most Common Industries - Administrative and support and waste management services (%)
Most Common Industries - Educational services, and health care and social assistance (%)
Most Common Industries - Educational services (%)
Most Common Industries - Health care and social assistance (%)
Most Common Industries - Arts, entertainment, and recreation, and accommodation and food services (%)
Most Common Industries - Arts, entertainment, and recreation (%)
Most Common Industries - Accommodation and food services (%)
Most Common Industries - Other services, except public administration (%)
Most Common Industries - Public administration (%)
Occupation diversity
Most Common Occupations - Management, business, science, and arts occupations (%)
Most Common Occupations - Management, business, and financial occupations (%)
Most Common Occupations - Management occupations (%)
Most Common Occupations - Business and financial operations occupations (%)
Most Common Occupations - Computer, engineering, and science occupations (%)
Most Common Occupations - Computer and mathematical occupations (%)
Most Common Occupations - Architecture and engineering occupations (%)
Most Common Occupations - Life, physical, and social science occupations (%)
Most Common Occupations - Education, legal, community service, arts, and media occupations (%)
Most Common Occupations - Community and social service occupations (%)
Most Common Occupations - Legal occupations (%)
Most Common Occupations - Education, training, and library occupations (%)
Most Common Occupations - Arts, design, entertainment, sports, and media occupations (%)
Most Common Occupations - Healthcare practitioners and technical occupations (%)
Most Common Occupations - Health diagnosing and treating practitioners and other technical occupations (%)
Most Common Occupations - Health technologists and technicians (%)
Most Common Occupations - Service occupations (%)
Most Common Occupations - Healthcare support occupations (%)
Most Common Occupations - Protective service occupations (%)
Most Common Occupations - Fire fighting and prevention, and other protective service workers including supervisors (%)
Most Common Occupations - Law enforcement workers including supervisors (%)
Most Common Occupations - Food preparation and serving related occupations (%)
Most Common Occupations - Building and grounds cleaning and maintenance occupations (%)
Most Common Occupations - Personal care and service occupations (%)
Most Common Occupations - Sales and office occupations (%)
Most Common Occupations - Sales and related occupations (%)
Most Common Occupations - Office and administrative support occupations (%)
Most Common Occupations - Natural resources, construction, and maintenance occupations (%)
Most Common Occupations - Farming, fishing, and forestry occupations (%)
Most Common Occupations - Construction and extraction occupations (%)
Most Common Occupations - Installation, maintenance, and repair occupations (%)
Most Common Occupations - Production, transportation, and material moving occupations (%)
Most Common Occupations - Production occupations (%)
Most Common Occupations - Transportation occupations (%)
Most Common Occupations - Material moving occupations (%)
People in Group quarters - Institutionalized population (%)
People in Group quarters - Correctional institutions (%)
People in Group quarters - Federal prisons and detention centers (%)
People in Group quarters - Halfway houses (%)
People in Group quarters - Local jails and other confinement facilities (including police lockups) (%)
People in Group quarters - Military disciplinary barracks (%)
People in Group quarters - State prisons (%)
People in Group quarters - Other types of correctional institutions (%)
People in Group quarters - Nursing homes (%)
People in Group quarters - Hospitals/wards, hospices, and schools for the handicapped (%)
People in Group quarters - Hospitals/wards and hospices for chronically ill (%)
People in Group quarters - Hospices or homes for chronically ill (%)
People in Group quarters - Military hospitals or wards for chronically ill (%)
People in Group quarters - Other hospitals or wards for chronically ill (%)
People in Group quarters - Hospitals or wards for drug/alcohol abuse (%)
People in Group quarters - Mental (Psychiatric) hospitals or wards (%)
People in Group quarters - Schools, hospitals, or wards for the mentally retarded (%)
People in Group quarters - Schools, hospitals, or wards for the physically handicapped (%)
People in Group quarters - Institutions for the deaf (%)
People in Group quarters - Institutions for the blind (%)
People in Group quarters - Orthopedic wards and institutions for the physically handicapped (%)
People in Group quarters - Wards in general hospitals for patients who have no usual home elsewhere (%)
People in Group quarters - Wards in military hospitals for patients who have no usual home elsewhere (%)
People in Group quarters - Juvenile institutions (%)
People in Group quarters - Long-term care (%)
People in Group quarters - Homes for abused, dependent, and neglected children (%)
People in Group quarters - Residential treatment centers for emotionally disturbed children (%)
People in Group quarters - Training schools for juvenile delinquents (%)
People in Group quarters - Short-term care, detention or diagnostic centers for delinquent children (%)
People in Group quarters - Type of juvenile institution unknown (%)
People in Group quarters - Noninstitutionalized population (%)
People in Group quarters - College dormitories (includes college quarters off campus) (%)
People in Group quarters - Military quarters (%)
People in Group quarters - On base (%)
People in Group quarters - Barracks, unaccompanied personnel housing (UPH), (Enlisted/Officer), ;and similar group living quarters for military personnel (%)
People in Group quarters - Transient quarters for temporary residents (%)
People in Group quarters - Military ships (%)
People in Group quarters - Group homes (%)
People in Group quarters - Homes or halfway houses for drug/alcohol abuse (%)
People in Group quarters - Homes for the mentally ill (%)
People in Group quarters - Homes for the mentally retarded (%)
People in Group quarters - Homes for the physically handicapped (%)
People in Group quarters - Other group homes (%)
People in Group quarters - Religious group quarters (%)
People in Group quarters - Dormitories (%)
People in Group quarters - Agriculture workers' dormitories on farms (%)
People in Group quarters - Job Corps and vocational training facilities (%)
People in Group quarters - Other workers' dormitories (%)
People in Group quarters - Crews of maritime vessels (%)
People in Group quarters - Other nonhousehold living situations (%)
People in Group quarters - Other noninstitutional group quarters (%)
Residents speaking English at home (%)
Residents speaking English at home - Born in the United States (%)
Residents speaking English at home - Native, born elsewhere (%)
Residents speaking English at home - Foreign born (%)
Residents speaking Spanish at home (%)
Residents speaking Spanish at home - Born in the United States (%)
Residents speaking Spanish at home - Native, born elsewhere (%)
Residents speaking Spanish at home - Foreign born (%)
Residents speaking other language at home (%)
Residents speaking other language at home - Born in the United States (%)
Residents speaking other language at home - Native, born elsewhere (%)
Residents speaking other language at home - Foreign born (%)
Class of Workers - Employee of private company (%)
Class of Workers - Self-employed in own incorporated business (%)
Class of Workers - Private not-for-profit wage and salary workers (%)
Class of Workers - Local government workers (%)
Class of Workers - State government workers (%)
Class of Workers - Federal government workers (%)
Class of Workers - Self-employed workers in own not incorporated business and Unpaid family workers (%)
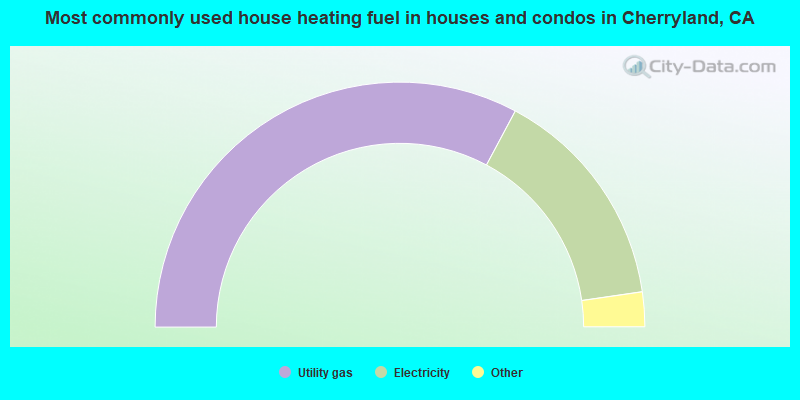
House heating fuel used in houses and condos - Utility gas (%)
House heating fuel used in houses and condos - Bottled, tank, or LP gas (%)
House heating fuel used in houses and condos - Electricity (%)
House heating fuel used in houses and condos - Fuel oil, kerosene, etc. (%)
House heating fuel used in houses and condos - Coal or coke (%)
House heating fuel used in houses and condos - Wood (%)
House heating fuel used in houses and condos - Solar energy (%)
House heating fuel used in houses and condos - Other fuel (%)
House heating fuel used in houses and condos - No fuel used (%)
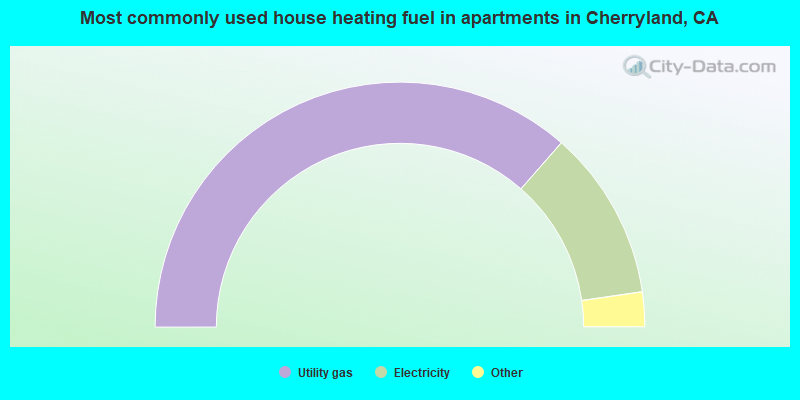
House heating fuel used in apartments - Utility gas (%)
House heating fuel used in apartments - Bottled, tank, or LP gas (%)
House heating fuel used in apartments - Electricity (%)
House heating fuel used in apartments - Fuel oil, kerosene, etc. (%)
House heating fuel used in apartments - Coal or coke (%)
House heating fuel used in apartments - Wood (%)
House heating fuel used in apartments - Solar energy (%)
House heating fuel used in apartments - Other fuel (%)
House heating fuel used in apartments - No fuel used (%)
Armed forces status - In Armed Forces (%)
Armed forces status - Civilian (%)
Armed forces status - Civilian - Veteran (%)
Armed forces status - Civilian - Nonveteran (%)
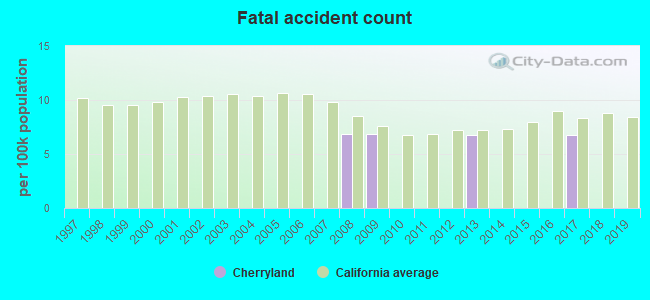
Fatal accidents locations in years 2005-2021
Fatal accidents locations in 2005
Fatal accidents locations in 2006
Fatal accidents locations in 2007
Fatal accidents locations in 2008
Fatal accidents locations in 2009
Fatal accidents locations in 2010
Fatal accidents locations in 2011
Fatal accidents locations in 2012
Fatal accidents locations in 2013
Fatal accidents locations in 2014
Fatal accidents locations in 2015
Fatal accidents locations in 2016
Fatal accidents locations in 2017
Fatal accidents locations in 2018
Fatal accidents locations in 2019
Fatal accidents locations in 2020
Fatal accidents locations in 2021
Alcohol use - People drinking some alcohol every month (%)
Alcohol use - People not drinking at all (%)
Alcohol use - Average days/month drinking alcohol
Alcohol use - Average drinks/week
Alcohol use - Average days/year people drink much
Audiometry - Average condition of hearing (%)
Audiometry - People that can hear a whisper from across a quiet room (%)
Audiometry - People that can hear normal voice from across a quiet room (%)
Audiometry - Ears ringing, roaring, buzzing (%)
Audiometry - Had a job exposure to loud noise (%)
Audiometry - Had off-work exposure to loud noise (%)
Blood Pressure & Cholesterol - Has high blood pressure (%)
Blood Pressure & Cholesterol - Checking blood pressure at home (%)
Blood Pressure & Cholesterol - Frequently checking blood cholesterol (%)
Blood Pressure & Cholesterol - Has high cholesterol level (%)
Consumer Behavior - Money monthly spent on food at supermarket/grocery store
Consumer Behavior - Money monthly spent on food at other stores
Consumer Behavior - Money monthly spent on eating out
Consumer Behavior - Money monthly spent on carryout/delivered foods
Consumer Behavior - Income spent on food at supermarket/grocery store (%)
Consumer Behavior - Income spent on food at other stores (%)
Consumer Behavior - Income spent on eating out (%)
Consumer Behavior - Income spent on carryout/delivered foods (%)
Current Health Status - General health condition (%)
Current Health Status - Blood donors (%)
Current Health Status - Has blood ever tested for HIV virus (%)
Current Health Status - Left-handed people (%)
Dermatology - People using sunscreen (%)
Diabetes - Diabetics (%)
Diabetes - Had a blood test for high blood sugar (%)
Diabetes - People taking insulin (%)
Diet Behavior & Nutrition - Diet health (%)
Diet Behavior & Nutrition - Milk product consumption (# of products/month)
Diet Behavior & Nutrition - Meals not home prepared (#/week)
Diet Behavior & Nutrition - Meals from fast food or pizza place (#/week)
Diet Behavior & Nutrition - Ready-to-eat foods (#/month)
Diet Behavior & Nutrition - Frozen meals/pizza (#/month)
Drug Use - People that ever used marijuana or hashish (%)
Drug Use - Ever used hard drugs (%)
Drug Use - Ever used any form of cocaine (%)
Drug Use - Ever used heroin (%)
Drug Use - Ever used methamphetamine (%)
Health Insurance - People covered by health insurance (%)
Kidney Conditions-Urology - Avg. # of times urinating at night
Medical Conditions - People with asthma (%)
Medical Conditions - People with anemia (%)
Medical Conditions - People with psoriasis (%)
Medical Conditions - People with overweight (%)
Medical Conditions - Elderly people having difficulties in thinking or remembering (%)
Medical Conditions - People who ever received blood transfusion (%)
Medical Conditions - People having trouble seeing even with glass/contacts (%)
Medical Conditions - People with arthritis (%)
Medical Conditions - People with gout (%)
Medical Conditions - People with congestive heart failure (%)
Medical Conditions - People with coronary heart disease (%)
Medical Conditions - People with angina pectoris (%)
Medical Conditions - People who ever had heart attack (%)
Medical Conditions - People who ever had stroke (%)
Medical Conditions - People with emphysema (%)
Medical Conditions - People with thyroid problem (%)
Medical Conditions - People with chronic bronchitis (%)
Medical Conditions - People with any liver condition (%)
Medical Conditions - People who ever had cancer or malignancy (%)
Mental Health - People who have little interest in doing things (%)
Mental Health - People feeling down, depressed, or hopeless (%)
Mental Health - People who have trouble sleeping or sleeping too much (%)
Mental Health - People feeling tired or having little energy (%)
Mental Health - People with poor appetite or overeating (%)
Mental Health - People feeling bad about themself (%)
Mental Health - People who have trouble concentrating on things (%)
Mental Health - People moving or speaking slowly or too fast (%)
Mental Health - People having thoughts they would be better off dead (%)
Oral Health - Average years since last visit a dentist
Oral Health - People embarrassed because of mouth (%)
Oral Health - People with gum disease (%)
Oral Health - General health of teeth and gums (%)
Oral Health - Average days a week using dental floss/device
Oral Health - Average days a week using mouthwash for dental problem
Oral Health - Average number of teeth
Pesticide Use - Households using pesticides to control insects (%)
Pesticide Use - Households using pesticides to kill weeds (%)
Physical Activity - People doing vigorous-intensity work activities (%)
Physical Activity - People doing moderate-intensity work activities (%)
Physical Activity - People walking or bicycling (%)
Physical Activity - People doing vigorous-intensity recreational activities (%)
Physical Activity - People doing moderate-intensity recreational activities (%)
Physical Activity - Average hours a day doing sedentary activities
Physical Activity - Average hours a day watching TV or videos
Physical Activity - Average hours a day using computer
Physical Functioning - People having limitations keeping them from working (%)
Physical Functioning - People limited in amount of work they can do (%)
Physical Functioning - People that need special equipment to walk (%)
Physical Functioning - People experiencing confusion/memory problems (%)
Physical Functioning - People requiring special healthcare equipment (%)
Prescription Medications - Average number of prescription medicines taking
Preventive Aspirin Use - Adults 40+ taking low-dose aspirin (%)
Reproductive Health - Vaginal deliveries (%)
Reproductive Health - Cesarean deliveries (%)
Reproductive Health - Deliveries resulted in a live birth (%)
Reproductive Health - Pregnancies resulted in a delivery (%)
Reproductive Health - Women breastfeeding newborns (%)
Reproductive Health - Women that had a hysterectomy (%)
Reproductive Health - Women that had both ovaries removed (%)
Reproductive Health - Women that have ever taken birth control pills (%)
Reproductive Health - Women taking birth control pills (%)
Reproductive Health - Women that have ever used Depo-Provera or injectables (%)
Reproductive Health - Women that have ever used female hormones (%)
Sexual Behavior - People 18+ that ever had sex (vaginal, anal, or oral) (%)
Sexual Behavior - Males 18+ that ever had vaginal sex with a woman (%)
Sexual Behavior - Males 18+ that ever performed oral sex on a woman (%)
Sexual Behavior - Males 18+ that ever had anal sex with a woman (%)
Sexual Behavior - Males 18+ that ever had any sex with a man (%)
Sexual Behavior - Females 18+ that ever had vaginal sex with a man (%)
Sexual Behavior - Females 18+ that ever performed oral sex on a man (%)
Sexual Behavior - Females 18+ that ever had anal sex with a man (%)
Sexual Behavior - Females 18+ that ever had any kind of sex with a woman (%)
Sexual Behavior - Average age people first had sex
Sexual Behavior - Average number of female sex partners in lifetime (males 18+)
Sexual Behavior - Average number of female vaginal sex partners in lifetime (males 18+)
Sexual Behavior - Average age people first performed oral sex on a woman (18+)
Sexual Behavior - Average number of woman performed oral sex on in lifetime (18+)
Sexual Behavior - Average number of male sex partners in lifetime (males 18+)
Sexual Behavior - Average number of male anal sex partners in lifetime (males 18+)
Sexual Behavior - Average age people first performed oral sex on a man (18+)
Sexual Behavior - Average number of male oral sex partners in lifetime (18+)
Sexual Behavior - People using protection when performing oral sex (%)
Sexual Behavior - Average number of times people have vaginal or anal sex a year
Sexual Behavior - People having sex without condom (%)
Sexual Behavior - Average number of male sex partners in lifetime (females 18+)
Sexual Behavior - Average number of male vaginal sex partners in lifetime (females 18+)
Sexual Behavior - Average number of female sex partners in lifetime (females 18+)
Sexual Behavior - Circumcised males 18+ (%)
Sleep Disorders - Average hours sleeping at night
Sleep Disorders - People that has trouble sleeping (%)
Smoking-Cigarette Use - People smoking cigarettes (%)
Taste & Smell - People 40+ having problems with smell (%)
Taste & Smell - People 40+ having problems with taste (%)
Taste & Smell - People 40+ that ever had wisdom teeth removed (%)
Taste & Smell - People 40+ that ever had tonsils teeth removed (%)
Taste & Smell - People 40+ that ever had a loss of consciousness because of a head injury (%)
Taste & Smell - People 40+ that ever had a broken nose or other serious injury to face or skull (%)
Taste & Smell - People 40+ that ever had two or more sinus infections (%)
Weight - Average height (inches)
Weight - Average weight (pounds)
Weight - Average BMI
Weight - People that are obese (%)
Weight - People that ever were obese (%)
Weight - People trying to lose weight (%)
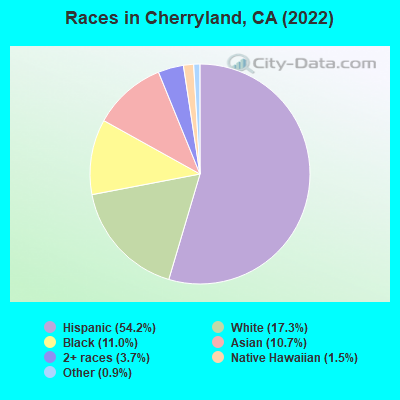
8,225 54.2% Hispanic 2,624 17.3% White alone 1,674 11.0% Black alone 1,630 10.7% Asian alone 554 3.7% Two or more races 225 1.5% Native Hawaiian and Other 140 0.9% Other race alone 3 0.02% American Indian alone
Latest news from Cherryland, CA collected exclusively by city-data.com from local newspapers, TV, and radio stations
Ancestries: Portuguese (2.8%), German (2.7%), Irish (1.8%), Italian (1.6%).
Current Local Time:
Land area: 1.17 square miles.
Population density: 12,623 people per square mile (very high).
5,190 residents are foreign born (21.8% Latin America , 8.8% Asia ).
This place:
34.2%California:
26.5%
Median real estate property taxes paid for housing units with mortgages in 2022: $5,470 (0.8%)Median real estate property taxes paid for housing units with no mortgage in 2022: $3,103 (0.4%)
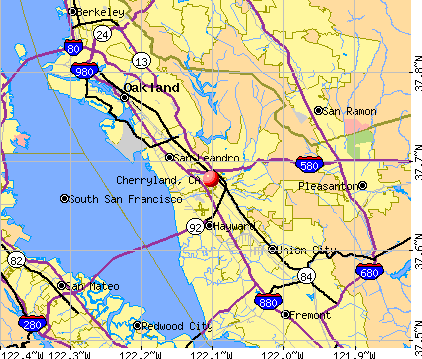
Nearest city with pop. 50,000+: Castro Valley, CA
Nearest city with pop. 200,000+: Oakland, CA
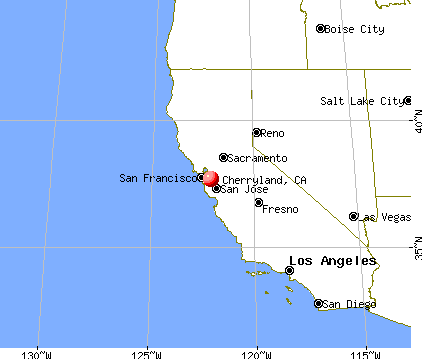
Nearest city with pop. 1,000,000+: Los Angeles, CA
Nearest cities:
Latitude: 37.68 N, Longitude: 122.10 W
Daytime population change due to commuting: -4,864 (-32.1%)Workers who live and work in this place: 748 (11.7%)
Area code commonly used in this area: 510
Unemployment in December 2023:
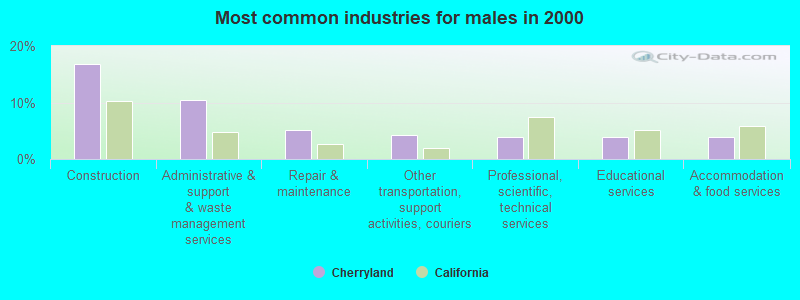
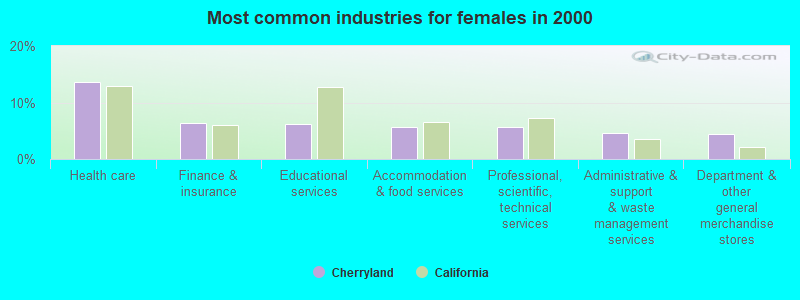
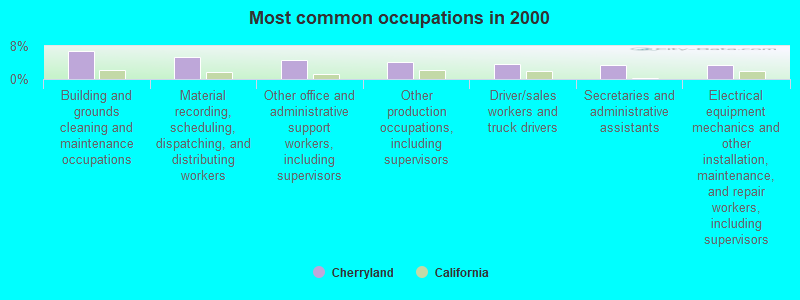
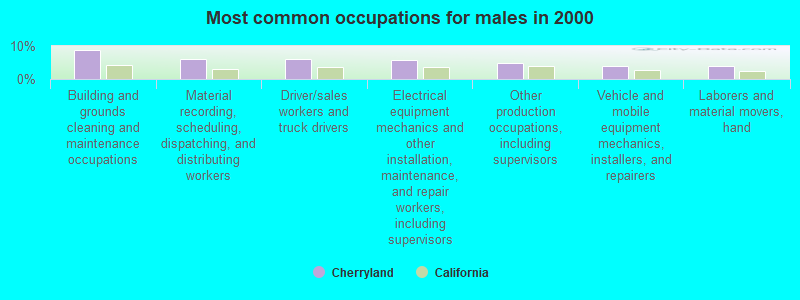
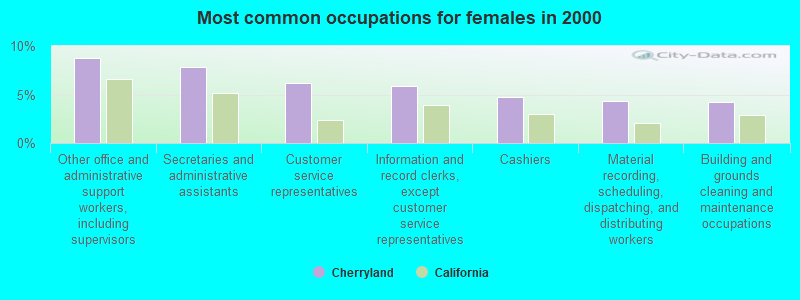
Most common occupations in Cherryland, CA (%)
Both Males Females
Building and grounds cleaning and maintenance occupations (6.8%)
Material recording, scheduling, dispatching, and distributing workers (5.4%)
Other office and administrative support workers, including supervisors (4.5%)
Other production occupations, including supervisors (4.2%)
Driver/sales workers and truck drivers (3.8%)
Secretaries and administrative assistants (3.5%)
Electrical equipment mechanics and other installation, maintenance, and repair workers, including supervisors (3.4%)
Building and grounds cleaning and maintenance occupations (8.7%)
Material recording, scheduling, dispatching, and distributing workers (6.1%)
Driver/sales workers and truck drivers (6.0%)
Electrical equipment mechanics and other installation, maintenance, and repair workers, including supervisors (5.8%)
Other production occupations, including supervisors (4.7%)
Vehicle and mobile equipment mechanics, installers, and repairers (4.0%)
Laborers and material movers, hand (3.9%)
Other office and administrative support workers, including supervisors (8.7%)
Secretaries and administrative assistants (7.8%)
Customer service representatives (6.2%)
Information and record clerks, except customer service representatives (5.9%)
Cashiers (4.7%)
Material recording, scheduling, dispatching, and distributing workers (4.3%)
Building and grounds cleaning and maintenance occupations (4.2%)
Earthquake activity:
Cherryland-area historical earthquake activity is significantly above California state average. It is 7613% greater than the overall U.S. average. On 4/18/1906 at 13:12:21, a magnitude 7.9 (7.9 UK, Class: Major, Intensity: VIII - XII) earthquake occurred 53.8 miles away from Cherryland center, causing $524,000,000 total damage On 10/18/1989 at 00:04:15, a magnitude 7.1 (6.5 MB, 7.1 MS, 6.9 MW, 7.0 ML) earthquake occurred 43.4 miles away from the city center, causing 62 deaths ( 62 shaking deaths) and 3757 injuries, causing $1,305,032,704 total damage On 11/4/1927 at 13:51:53, a magnitude 7.5 (7.5 UK) earthquake occurred 200.3 miles away from Cherryland center On 7/21/1952 at 11:52:14, a magnitude 7.7 (7.7 UK) earthquake occurred 253.4 miles away from the city center, causing $50,000,000 total damage On 1/31/1922 at 13:17:28, a magnitude 7.6 (7.6 UK) earthquake occurred 279.0 miles away from the city center On 4/25/1992 at 18:06:04, a magnitude 7.2 (6.3 MB, 7.1 MS, 7.2 MW, 7.1 MW, Depth: 9.4 mi) earthquake occurred 212.8 miles away from the city center, causing $75,000,000 total damage Magnitude types: body-wave magnitude (MB), local magnitude (ML), surface-wave magnitude (MS), moment magnitude (MW) Natural disasters: The number of natural disasters in Alameda County (20) is greater than the US average (15).Major Disasters (Presidential) Declared: 14Emergencies Declared: 2Floods: 13, Storms: 7, Mudslides: 6, Winter Storms: 6, Landslides: 4, Fires: 2, Drought: 1, Earthquake: 1, Freeze: 1, Hurricane: 1, Tornado: 1, Other: 1 (Note: some incidents may be assigned to more than one category). Hospitals and medical centers near Cherryland: MORTON BAKAR CENTER (Nursing Home, about 1 miles away; HAYWARD, CA)
GLEN ELLEN CONV HOSP (Nursing Home, about 1 miles away; HAYWARD, CA)
CREEKSIDE TERRACE (Nursing Home, about 1 miles away; HAYWARD, CA)
ST MARYS NURSING CENTER (Nursing Home, about 1 miles away; HAYWARD, CA)
MEEKLAND ICF-DDH (Hospital, about 1 miles away; HAYWARD, CA)
HAYWARD SPRINGS CARE CENTER (Nursing Home, about 1 miles away; HAYWARD, CA)
GENESIS DEVELOPMENTAL SVS-MAIN (Hospital, about 1 miles away; HAYWARD, CA)
Amtrak stations near Cherryland: 1 miles: HAYWARD (22555 MEEKLAND AVE.) Services: fully wheelchair accessible, public payphones, free short-term parking.
10 miles: FREMONT (CENTERVILLE, FREMONT & PERALTA BLVDS.) Services: fully wheelchair accessible, enclosed waiting area, public restrooms, public payphones, snack bar, free short-term parking, free long-term parking, call for car rental service, call for taxi service, public transit connection.
12 miles: EAST DUBLIN-PLEASANTON (PLEASANTON, OWENS DR. AT BART WAY) - Bus Station Colleges/universities with over 2000 students nearest to Cherryland:
Chabot College (about 3 miles; Hayward, CA ; Full-time enrollment: 7,610)
California State University-East Bay (about 3 miles; Hayward, CA ; FT enrollment: 12,956)
Merritt College (about 9 miles; Oakland, CA ; FT enrollment: 2,842)
Saint Mary's College of California (about 12 miles; Moraga, CA ; FT enrollment: 4,200)
Laney College (about 12 miles; Oakland, CA ; FT enrollment: 5,668)
College of Alameda (about 13 miles; Alameda, CA ; FT enrollment: 3,071)
Ohlone College (about 15 miles; Fremont, CA ; FT enrollment: 6,153)
Alameda County has a predicted average indoor radon screening level between 2 and 4 pCi/L (pico curies per liter) - Moderate Potential Average household size: This place:
3.1 peopleCalifornia:
2.9 people
Percentage of family households: This place:
66.4%Whole state:
68.7%
Percentage of households with unmarried partners: This place:
10.7%Whole state:
7.2%
Likely homosexual households (counted as self-reported same-sex unmarried-partner households)
Lesbian couples: 0.6% of all households Gay men: 0.5% of all households
People in group quarters in Cherryland in 2010:
179 people in nursing facilities/skilled-nursing facilities
145 people in group homes intended for adults
66 people in workers' group living quarters and job corps centers
40 people in residential treatment centers for adults
26 people in emergency and transitional shelters (with sleeping facilities) for people experiencing homelessness
People in group quarters in Cherryland in 2000:
170 people in nursing homes
127 people in other noninstitutional group quarters
60 people in homes for the mentally retarded
35 people in mental (psychiatric) hospitals or wards
22 people in homes or halfway houses for drug/alcohol abuse
21 people in other nonhousehold living situations
20 people in homes for the mentally ill
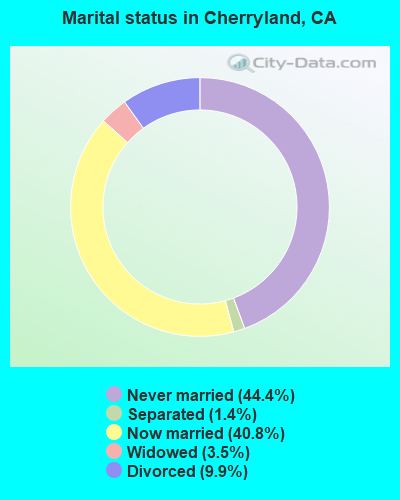
For population 15 years and over in Cherryland:
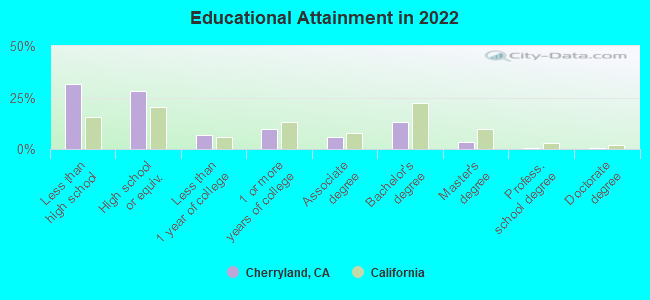
Never married: 44.4%Now married: 40.8%Separated: 1.4%Widowed: 3.5%Divorced: 9.9% For population 25 years and over in Cherryland:
High school or higher: 69.6%Bachelor's degree or higher: 16.6%Graduate or professional degree: 4.1%Unemployed: 9.0%Mean travel time to work (commute): 22.2 minutes
Education Gini index (Inequality in education) Here:
19.9California average:
15.5
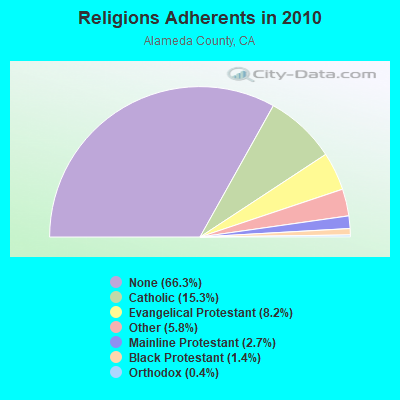
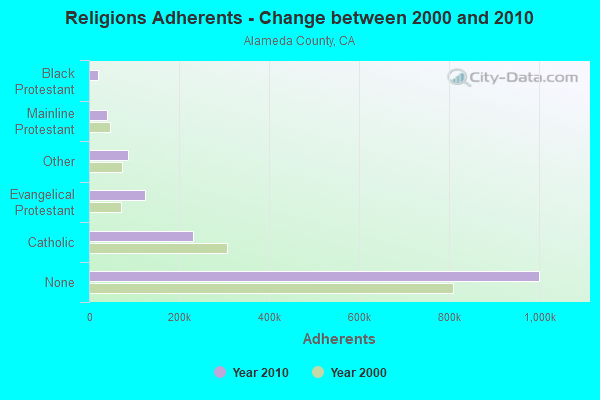
Religion statistics for Cherryland, CA (based on Alameda County data)
Religion Adherents Congregations Catholic 231,500 53 Evangelical Protestant 123,422 538 Other 87,110 227 Mainline Protestant 40,185 181 Black Protestant 20,716 76 Orthodox 6,640 16 None 1,000,698 -
Source: Clifford Grammich, Kirk Hadaway, Richard Houseal, Dale E.Jones, Alexei Krindatch, Richie Stanley and Richard H.Taylor. 2012. 2010 U.S.Religion Census: Religious Congregations & Membership Study. Association of Statisticians of American Religious Bodies. Jones, Dale E., et al. 2002. Congregations and Membership in the United States 2000. Nashville, TN: Glenmary Research Center. Graphs represent county-level data
Food Environment Statistics: Number of grocery stores : 364This county :
2.50 / 10,000 pop.California :
2.14 / 10,000 pop.
Number of supercenters and club stores : 5Here :
0.03 / 10,000 pop.California :
0.04 / 10,000 pop.
Number of convenience stores (no gas) : 97Alameda County :
0.67 / 10,000 pop.State :
0.62 / 10,000 pop.
Number of convenience stores (with gas) : 232Alameda County :
1.60 / 10,000 pop.California :
1.49 / 10,000 pop.
Number of full-service restaurants : 1,299Here :
8.94 / 10,000 pop.California :
7.42 / 10,000 pop.
Adult diabetes rate : Alameda County :
6.9%California :
7.3%
Adult obesity rate : Here :
19.3%California :
21.3%
Low-income preschool obesity rate : Health and Nutrition: Healthy diet rate : This city:
47.2%California:
49.4%
Average overall health of teeth and gums : Cherryland:
45.8%California:
48.0%
Average BMI : This city:
28.4California:
28.1
People feeling badly about themselves : Cherryland:
20.6%State:
20.2%
People not drinking alcohol at all : This city:
11.4%State:
11.2%
Average hours sleeping at night : Cherryland:
6.8California:
6.8
Overweight people : This city:
30.7%California:
31.5%
General health condition : This city:
55.3%State:
56.4%
Average condition of hearing : Cherryland:
81.2%California:
80.9%
More about Health and Nutrition of Cherryland, CA Residents
6.77% of this county's 2021 resident taxpayers lived in other counties in 2020 ($121,106 average adjusted gross income )
Here:
6.77%California average:
5.19%
0.01% of residents moved from foreign countries ($76 average AGI )Alameda County:
0.01%California average:
0.03%
Top counties from which taxpayers relocated into this county between 2020 and 2021:
8.96% of this county's 2020 resident taxpayers moved to other counties in 2021 ($131,786 average adjusted gross income )
Here:
8.96%California average:
6.14%
0.01% of residents moved to foreign countries ($103 average AGI )Alameda County:
0.01%California average:
0.02%
Top counties to which taxpayers relocated from this county between 2020 and 2021: Strongest AM radio stations in Cherryland:
KFAX (1100 AM; 50 kW; SAN FRANCISCO, CA; Owner: GOLDEN GATE BROADCASTING CO, INC.)
KTCT (1050 AM; 50 kW; SAN MATEO, CA; Owner: SUSQUEHANNA RADIO CORP.)
KGO (810 AM; 50 kW; SAN FRANCISCO, CA; Owner: KGO-AM RADIO, INC.)
KNBR (680 AM; 50 kW; SAN FRANCISCO, CA; Owner: KNBR LICO, INC.)
KTRB (860 AM; 50 kW; MODESTO, CA; Owner: PAPPAS RADIO OF CALIFORNIA, A CALIFORNIA LIMITED PARTNERSHIP)
KYCY (1550 AM; 50 kW; SAN FRANCISCO, CA; Owner: INFINITY BROADCASTING OPERATIONS, INC.)
KIQI (1010 AM; 35 kW; SAN FRANCISCO, CA; Owner: RADIO UNICA OF SAN FRANCISCO LICENSE CORP.)
KNEW (910 AM; 20 kW; OAKLAND, CA; Owner: AMFM RADIO LICENSES, L.L.C.)
KLOK (1170 AM; 50 kW; SAN JOSE, CA; Owner: ENTRAVISION HOLDINGS, LLC)
KCBS (740 AM; 50 kW; SAN FRANCISCO, CA; Owner: INFINITY BROADCASTING OPERATIONS, INC.)
KSFO (560 AM; 5 kW; SAN FRANCISCO, CA; Owner: KGO-AM RADIO, INC.)
KFRC (610 AM; 5 kW; SAN FRANCISCO, CA; Owner: INFINITY BROADCASTING CORPORATION OF LOS ANGELES)
KMZT (1510 AM; 8 kW; SAN RAFAEL, CA; Owner: MOUNT WILSON FM BROADCASTERS, INC.)
Strongest FM radio stations in Cherryland:
KKSF-FM1 (103.7 FM; PLEASANTON, ETC., CA; Owner: AMFM RADIO LICENSES, L.L.C.)
KZBR-FM2 (95.7 FM; LIVERMORE, ETC., CA; Owner: BONNEVILLE HOLDING COMPANY)
KFRC-FM3 (99.7 FM; WALNUT CREEK, CA; Owner: INFINITY KFRC-FM, INC.)
KZBR-FM1 (95.7 FM; WALNUT CREEK, CA; Owner: BONNEVILLE HOLDING COMPANY)
KBLX-FM2 (102.9 FM; PLEASANTON, CA; Owner: ICBC BROADCAST HOLDINGS -CA, INC.)
KSOL-FM3 (98.9 FM; PLEASANTON, CA; Owner: TMS LICENSE CALIFORNIA, INC)
KISQ-FM3 (98.1 FM; CONCORD, CA; Owner: AMFM RADIO LICENSES, L.L.C.)
KMEL-FM1 (106.1 FM; CONCORD, CA; Owner: AMFM RADIO LICENSES, L.L.C.)
KLLC (97.3 FM; SAN FRANCISCO, CA; Owner: INFINITY BROADCASTING OPERATIONS, INC.)
KOIT-FM (96.5 FM; SAN FRANCISCO, CA; Owner: BONNEVILLE HOLDING COMPANY)
KFJO (92.1 FM; WALNUT CREEK, CA; Owner: CHASE RADIO PROPERTIES, L.L.C.)
KKSF (103.7 FM; SAN FRANCISCO, CA; Owner: AMFM RADIO LICENSES, L.L.C.)
KFOG (104.5 FM; SAN FRANCISCO, CA; Owner: KFFG LICO, INC)
KYLD (94.9 FM; SAN FRANCISCO, CA; Owner: AMFM RADIO LICENSES, L.L.C.)
KFRC-FM (99.7 FM; SAN FRANCISCO, CA; Owner: INFINITY KFRC-FM, INC.)
KBLX-FM (102.9 FM; BERKELEY, CA; Owner: ICBC BROADCAST HOLDINGS - CA, INC.)
KZBR (95.7 FM; SAN FRANCISCO, CA; Owner: BONNEVILLE HOLDING COMPANY)
KMEL (106.1 FM; SAN FRANCISCO, CA; Owner: AMFM RADIO LICENSES, L.L.C.)
KSAN (107.7 FM; SAN MATEO, CA; Owner: SUSQUEHANNA RADIO CORP.)
KQED-FM (88.5 FM; SAN FRANCISCO, CA; Owner: KQED, INC.)
TV broadcast stations around Cherryland:
KQED (Channel 9; SAN FRANCISCO, CA; Owner: KQED, INC.)
KGO-TV (Channel 7; SAN FRANCISCO, CA; Owner: KGO TELEVISION, INC.)
KPIX-TV (Channel 5; SAN FRANCISCO, CA; Owner: CBS BROADCASTING INC.)
KTVU (Channel 2; OAKLAND, CA; Owner: KTVU PARTNERSHIP)
KRON-TV (Channel 4; SAN FRANCISCO, CA; Owner: YOUNG BROADCASTING OF SAN FRANCISCO, INC.)
KMTP-TV (Channel 32; SAN FRANCISCO, CA; Owner: MINORITY TELEVISION PROJECT)
KBHK-TV (Channel 44; SAN FRANCISCO, CA; Owner: VIACOM TELEVISION STATIONS GROUP OF SAN FRANCISCO INC.)
KBWB (Channel 20; SAN FRANCISCO, CA; Owner: KBWB LICENSE, INC.)
KFSF (Channel 66; VALLEJO, CA; Owner: TELEFUTURA SAN FRANCISCO LLC)
KCSM-TV (Channel 60; SAN MATEO, CA; Owner: SAN MATEO COUNTY COMMUNITY COLLEGE DISTRICT)
KCNS (Channel 38; SAN FRANCISCO, CA; Owner: WRAY, INC.)
KBIT-CA (Channel 28; SAN FRANCISCO, ETC., CA; Owner: POLAR BROADCASTING, INC.)
KICU-TV (Channel 36; SAN JOSE, CA; Owner: KTVU PARTNERSHIP)
KOVR (Channel 13; STOCKTON, CA; Owner: SCI - SACRAMENTO LICENSEE, LLC)
KXTV (Channel 10; SACRAMENTO, CA; Owner: KXTV, INC.)
KCRA-TV (Channel 3; SACRAMENTO, CA; Owner: KCRA HEARST-ARGYLE TELEVISION, INC.)
KSPX (Channel 29; SACRAMENTO, CA; Owner: PAXSON SACRAMENTO LICENSE, INC.)
KUVS (Channel 19; MODESTO, CA; Owner: KUVS LICENSE PARTNERSHIP, G.P.)
KTXL (Channel 40; SACRAMENTO, CA; Owner: CHANNEL 40, INC.)
KQCA (Channel 58; STOCKTON, CA; Owner: KCRA HEARST-ARGYLE TELEVISION, INC.)
KTEH (Channel 54; SAN JOSE, CA; Owner: KTEH FOUNDATION)
KVIE (Channel 6; SACRAMENTO, CA; Owner: KVIE, INC.)
KMAX-TV (Channel 31; SACRAMENTO, CA; Owner: UPN STATIONS GROUP INC.)
KDTV (Channel 14; SAN FRANCISCO, CA; Owner: KDTV LICENSE PARTNERSHIP, G.P.)
KSTS (Channel 48; SAN JOSE, CA; Owner: TELEMUNDO OF NORTHERN CALIFORNIA LICENSE CORP.)
Cherryland fatal accident list:
Feb 14, 2017 06:55 AM, Cr-Hampton Rd, Boston Rd, Lat: 37.683797, Lon: -122.113511, Vehicles: 1, Persons: 1, Pedestrians: 1, Fatalities: 1Lat: 37.683064, Lon: -122.097397, Vehicles: 2, Persons: 1, Pedestrians: 2, Fatalities: 1Lat: 37.684669, Lon: -122.099306, Vehicles: 1, Persons: 2, Pedestrians: 1, Fatalities: 1Lat: 37.680910, Lon: -122.102070, Vehicles: 1, Persons: 4, Pedestrians: 1, Fatalities: 1, Drunk persons involved: 1
National Bridge Inventory (NBI) Statistics 2 Number of bridges10ft / 3.2m Total length21,500 Total average daily traffic610 Total average daily truck traffic52,629 Total future (year 2037) average daily traffic
FCC Registered Microwave Towers: 1
CA-SFO0942A, 21144 Mission Blvd. (Lat: 37.682917 Lon: -122.096889), Type: Bant, Structure height: 9.1 m, Overall height: 10.5 m, Call Sign: WQND272, Assigned Frequencies: 17965.0 MHz, 18065.0 MHz, 17965.0 MHz, 18065.0 MHz, 17965.0 MHz, 18065.0 MHz, 17965.0 MHz, 18065.0 MHz, 17965.0 MHz, 18065.0 MHz... (+4 more), Grant Date: 03/12/2021, Expiration Date: 12/27/2030, Cancellation Date: 05/11/2023, Certifier: Nadja S Sodos-Wallace, Registrant: T-Mobile Usa, Inc., 12920 Se 38th Street, Bellevue, WA 98006, Phone: (425) 383-8401, Email:
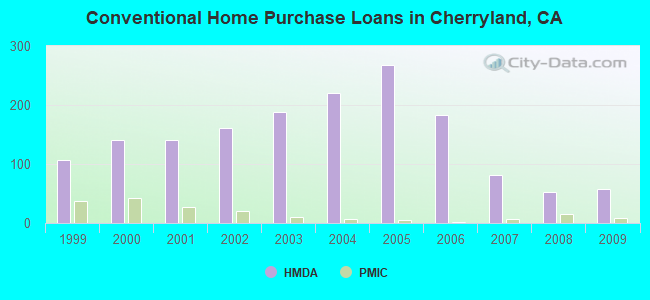
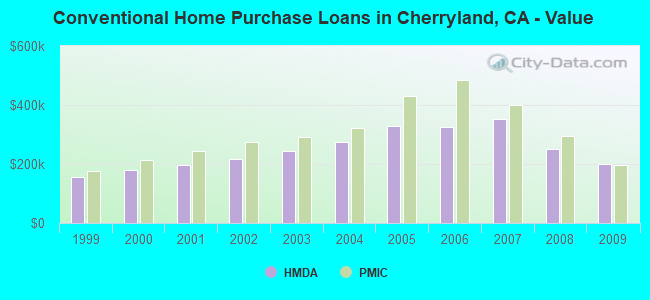
Home Mortgage Disclosure Act Aggregated Statistics For Year 2009(Based on 1 full and 2 partial tracts) A) FHA, FSA/RHS & VA B) Conventional C) Refinancings D) Home Improvement Loans E) Loans on Dwellings For 5+ Families F) Non-occupant Loans on Number Average Value Number Average Value Number Average Value Number Average Value Number Average Value Number Average Value
LOANS ORIGINATED 38 $223,376 57 $199,876 75 $228,460 0 $0 2 $738,100 24 $209,311 APPLICATIONS APPROVED, NOT ACCEPTED 5 $217,450 10 $160,347 10 $248,604 1 $5,000 0 $0 0 $0 APPLICATIONS DENIED 14 $274,852 23 $184,443 46 $279,696 5 $151,796 1 $434,980 9 $220,527 APPLICATIONS WITHDRAWN 8 $236,564 13 $210,738 24 $247,201 3 $193,913 0 $0 5 $266,282 FILES CLOSED FOR INCOMPLETENESS 5 $257,046 3 $150,637 8 $225,818 2 $244,855 0 $0 2 $237,355
Aggregated Statistics For Year 2008(Based on 1 full and 2 partial tracts) A) FHA, FSA/RHS & VA B) Conventional C) Refinancings D) Home Improvement Loans E) Loans on Dwellings For 5+ Families F) Non-occupant Loans on G) Loans On Manufactured Number Average Value Number Average Value Number Average Value Number Average Value Number Average Value Number Average Value Number Average Value
LOANS ORIGINATED 21 $280,824 53 $250,481 76 $287,726 8 $178,981 3 $1,026,050 30 $262,268 0 $0 APPLICATIONS APPROVED, NOT ACCEPTED 2 $348,565 12 $229,036 21 $304,404 1 $11,810 0 $0 6 $215,155 5 $92,744 APPLICATIONS DENIED 9 $275,948 28 $279,793 66 $339,439 17 $224,218 2 $744,555 14 $218,789 1 $32,980 APPLICATIONS WITHDRAWN 1 $350,730 7 $220,776 19 $302,044 3 $92,600 1 $1,324,200 5 $226,506 0 $0 FILES CLOSED FOR INCOMPLETENESS 1 $212,450 12 $278,042 13 $391,603 1 $257,880 0 $0 5 $255,760 0 $0
Aggregated Statistics For Year 2007(Based on 1 full and 2 partial tracts) B) Conventional C) Refinancings D) Home Improvement Loans E) Loans on Dwellings For 5+ Families F) Non-occupant Loans on G) Loans On Manufactured Number Average Value Number Average Value Number Average Value Number Average Value Number Average Value Number Average Value
LOANS ORIGINATED 81 $353,652 203 $368,824 20 $272,940 10 $925,171 49 $406,655 0 $0 APPLICATIONS APPROVED, NOT ACCEPTED 22 $342,000 72 $355,589 6 $179,903 0 $0 8 $349,632 0 $0 APPLICATIONS DENIED 90 $354,766 222 $399,058 19 $280,647 2 $429,740 47 $381,671 3 $252,847 APPLICATIONS WITHDRAWN 20 $309,609 78 $378,101 6 $195,737 3 $1,053,607 11 $355,342 1 $369,780 FILES CLOSED FOR INCOMPLETENESS 8 $353,096 38 $410,231 3 $386,863 0 $0 10 $413,136 0 $0
Aggregated Statistics For Year 2006(Based on 1 full and 2 partial tracts) B) Conventional C) Refinancings D) Home Improvement Loans E) Loans on Dwellings For 5+ Families F) Non-occupant Loans on G) Loans On Manufactured Number Average Value Number Average Value Number Average Value Number Average Value Number Average Value Number Average Value
LOANS ORIGINATED 183 $326,009 281 $369,714 51 $284,049 8 $961,531 67 $369,388 0 $0 APPLICATIONS APPROVED, NOT ACCEPTED 52 $309,372 69 $358,075 12 $209,142 2 $344,795 10 $317,123 1 $22,990 APPLICATIONS DENIED 105 $327,647 161 $394,309 34 $299,824 2 $977,775 31 $415,247 0 $0 APPLICATIONS WITHDRAWN 34 $341,621 89 $389,986 13 $340,472 1 $453,730 18 $367,236 0 $0 FILES CLOSED FOR INCOMPLETENESS 9 $315,607 24 $375,043 6 $267,678 1 $584,650 2 $354,785 0 $0
Aggregated Statistics For Year 2005(Based on 1 full and 2 partial tracts) B) Conventional C) Refinancings D) Home Improvement Loans E) Loans on Dwellings For 5+ Families F) Non-occupant Loans on G) Loans On Manufactured Number Average Value Number Average Value Number Average Value Number Average Value Number Average Value Number Average Value
LOANS ORIGINATED 267 $327,124 344 $336,749 47 $280,449 11 $700,114 84 $373,668 0 $0 APPLICATIONS APPROVED, NOT ACCEPTED 46 $321,518 85 $341,944 2 $394,465 0 $0 16 $430,826 1 $84,950 APPLICATIONS DENIED 91 $319,317 183 $375,869 36 $266,999 3 $443,207 18 $423,117 2 $61,465 APPLICATIONS WITHDRAWN 43 $318,989 94 $340,307 13 $329,985 0 $0 12 $415,408 0 $0 FILES CLOSED FOR INCOMPLETENESS 16 $267,657 41 $373,142 3 $200,060 1 $466,050 6 $410,505 1 $355,790
Aggregated Statistics For Year 2004(Based on 1 full and 2 partial tracts) B) Conventional C) Refinancings D) Home Improvement Loans E) Loans on Dwellings For 5+ Families F) Non-occupant Loans on G) Loans On Manufactured Number Average Value Number Average Value Number Average Value Number Average Value Number Average Value Number Average Value
LOANS ORIGINATED 220 $273,923 352 $270,665 30 $199,693 9 $989,759 78 $298,450 1 $335,800 APPLICATIONS APPROVED, NOT ACCEPTED 43 $307,168 80 $265,871 9 $133,171 0 $0 14 $299,601 0 $0 APPLICATIONS DENIED 70 $276,541 169 $289,176 25 $177,164 1 $599,640 22 $340,623 1 $244,850 APPLICATIONS WITHDRAWN 28 $289,686 118 $275,903 15 $184,601 1 $1,284,230 10 $298,899 0 $0 FILES CLOSED FOR INCOMPLETENESS 10 $313,870 41 $284,450 3 $120,290 0 $0 5 $261,900 0 $0
Aggregated Statistics For Year 2003(Based on 1 full and 2 partial tracts) A) FHA, FSA/RHS & VA B) Conventional C) Refinancings D) Home Improvement Loans E) Loans on Dwellings For 5+ Families F) Non-occupant Loans on Number Average Value Number Average Value Number Average Value Number Average Value Number Average Value Number Average Value
LOANS ORIGINATED 0 $0 188 $243,581 560 $215,061 10 $113,827 9 $675,774 93 $237,427 APPLICATIONS APPROVED, NOT ACCEPTED 1 $39,770 35 $251,001 109 $240,188 2 $51,565 1 $93,210 14 $227,470 APPLICATIONS DENIED 0 $0 85 $232,202 172 $248,058 19 $52,932 1 $449,730 37 $246,974 APPLICATIONS WITHDRAWN 0 $0 18 $266,686 157 $243,388 2 $116,290 0 $0 11 $258,311 FILES CLOSED FOR INCOMPLETENESS 0 $0 8 $244,529 23 $244,683 1 $238,860 0 $0 4 $279,810
Aggregated Statistics For Year 2002(Based on 1 full and 2 partial tracts) A) FHA, FSA/RHS & VA B) Conventional C) Refinancings D) Home Improvement Loans E) Loans on Dwellings For 5+ Families F) Non-occupant Loans on Number Average Value Number Average Value Number Average Value Number Average Value Number Average Value Number Average Value
LOANS ORIGINATED 4 $160,028 161 $218,342 433 $202,919 9 $34,442 11 $573,984 72 $220,154 APPLICATIONS APPROVED, NOT ACCEPTED 2 $157,890 25 $224,575 79 $209,989 3 $41,510 0 $0 11 $190,632 APPLICATIONS DENIED 0 $0 45 $220,287 112 $223,539 12 $48,930 3 $446,400 13 $256,367 APPLICATIONS WITHDRAWN 0 $0 28 $221,151 121 $220,290 6 $57,075 0 $0 6 $195,007 FILES CLOSED FOR INCOMPLETENESS 0 $0 10 $168,141 35 $194,221 0 $0 0 $0 4 $237,202
Aggregated Statistics For Year 2001(Based on 1 full and 2 partial tracts) A) FHA, FSA/RHS & VA B) Conventional C) Refinancings D) Home Improvement Loans E) Loans on Dwellings For 5+ Families F) Non-occupant Loans on Number Average Value Number Average Value Number Average Value Number Average Value Number Average Value Number Average Value
LOANS ORIGINATED 7 $233,421 141 $196,850 369 $191,962 24 $43,592 2 $1,097,770 58 $191,686 APPLICATIONS APPROVED, NOT ACCEPTED 1 $236,800 16 $190,996 56 $194,508 2 $163,540 0 $0 8 $198,144 APPLICATIONS DENIED 1 $256,850 58 $195,757 103 $191,620 10 $64,628 0 $0 22 $219,675 APPLICATIONS WITHDRAWN 0 $0 23 $224,578 126 $196,093 9 $105,294 1 $466,050 13 $222,620 FILES CLOSED FOR INCOMPLETENESS 0 $0 9 $222,083 31 $197,885 1 $93,210 0 $0 6 $227,198
Aggregated Statistics For Year 2000(Based on 1 full and 2 partial tracts) A) FHA, FSA/RHS & VA B) Conventional C) Refinancings D) Home Improvement Loans E) Loans on Dwellings For 5+ Families F) Non-occupant Loans on Number Average Value Number Average Value Number Average Value Number Average Value Number Average Value Number Average Value
LOANS ORIGINATED 11 $208,465 140 $179,057 100 $147,658 14 $32,236 6 $597,735 35 $179,581 APPLICATIONS APPROVED, NOT ACCEPTED 1 $271,840 18 $145,411 19 $143,304 12 $48,587 0 $0 6 $182,987 APPLICATIONS DENIED 3 $100,013 59 $173,048 65 $156,784 18 $36,540 0 $0 7 $235,173 APPLICATIONS WITHDRAWN 0 $0 32 $158,323 63 $172,636 4 $26,932 0 $0 4 $151,270 FILES CLOSED FOR INCOMPLETENESS 0 $0 2 $180,725 22 $183,040 0 $0 0 $0 2 $192,015
Aggregated Statistics For Year 1999(Based on 3 partial tracts) A) FHA, FSA/RHS & VA B) Conventional C) Refinancings D) Home Improvement Loans E) Loans on Dwellings For 5+ Families F) Non-occupant Loans on Number Average Value Number Average Value Number Average Value Number Average Value Number Average Value Number Average Value
LOANS ORIGINATED 14 $163,891 107 $155,059 155 $136,544 27 $20,261 8 $553,315 31 $157,739 APPLICATIONS APPROVED, NOT ACCEPTED 0 $0 18 $134,504 41 $139,749 7 $31,649 0 $0 3 $195,203 APPLICATIONS DENIED 3 $140,283 39 $155,203 80 $134,106 21 $23,064 0 $0 7 $176,583 APPLICATIONS WITHDRAWN 2 $196,320 19 $137,184 58 $141,752 1 $34,790 0 $0 3 $196,453 FILES CLOSED FOR INCOMPLETENESS 0 $0 9 $167,462 27 $153,058 0 $0 0 $0 4 $149,032
Detailed HMDA statistics for the following Tracts:
4355.00
, 4356.00 , 4357.00
Private Mortgage Insurance Companies Aggregated Statistics For Year 2009(Based on 1 full and 2 partial tracts) A) Conventional B) Refinancings Number Average Value Number Average Value
LOANS ORIGINATED 8 $195,532 0 $0 APPLICATIONS APPROVED, NOT ACCEPTED 5 $256,340 1 $169,640 APPLICATIONS DENIED 0 $0 0 $0 APPLICATIONS WITHDRAWN 0 $0 1 $716,570 FILES CLOSED FOR INCOMPLETENESS 0 $0 0 $0
Aggregated Statistics For Year 2008(Based on 1 full and 2 partial tracts) A) Conventional B) Refinancings Number Average Value Number Average Value
LOANS ORIGINATED 16 $293,793 3 $366,190 APPLICATIONS APPROVED, NOT ACCEPTED 10 $378,614 4 $368,185 APPLICATIONS DENIED 4 $303,895 0 $0 APPLICATIONS WITHDRAWN 2 $401,400 1 $369,780 FILES CLOSED FOR INCOMPLETENESS 2 $642,645 0 $0
Aggregated Statistics For Year 2007(Based on 1 full and 2 partial tracts) A) Conventional B) Refinancings C) Non-occupant Loans on Number Average Value Number Average Value Number Average Value
LOANS ORIGINATED 7 $401,369 5 $450,468 1 $521,350 APPLICATIONS APPROVED, NOT ACCEPTED 1 $377,770 4 $483,005 0 $0 APPLICATIONS DENIED 0 $0 1 $391,480 0 $0 APPLICATIONS WITHDRAWN 0 $0 1 $441,730 0 $0 FILES CLOSED FOR INCOMPLETENESS 0 $0 0 $0 0 $0
Aggregated Statistics For Year 2006(Based on 1 full and 1 partial tracts) A) Conventional B) Refinancings Number Average Value Number Average Value
LOANS ORIGINATED 1 $485,710 3 $484,493 APPLICATIONS APPROVED, NOT ACCEPTED 0 $0 1 $380,770 APPLICATIONS DENIED 0 $0 0 $0 APPLICATIONS WITHDRAWN 0 $0 0 $0 FILES CLOSED FOR INCOMPLETENESS 0 $0 0 $0
Aggregated Statistics For Year 2005(Based on 1 full and 1 partial tracts) A) Conventional B) Refinancings Number Average Value Number Average Value
LOANS ORIGINATED 5 $432,162 4 $335,402 APPLICATIONS APPROVED, NOT ACCEPTED 0 $0 0 $0 APPLICATIONS DENIED 0 $0 0 $0 APPLICATIONS WITHDRAWN 0 $0 0 $0 FILES CLOSED FOR INCOMPLETENESS 0 $0 0 $0
Aggregated Statistics For Year 2004(Based on 1 full and 2 partial tracts) A) Conventional B) Refinancings C) Non-occupant Loans on Number Average Value Number Average Value Number Average Value
LOANS ORIGINATED 6 $323,360 6 $288,687 1 $259,840 APPLICATIONS APPROVED, NOT ACCEPTED 2 $248,915 1 $382,040 0 $0 APPLICATIONS DENIED 0 $0 0 $0 0 $0 APPLICATIONS WITHDRAWN 0 $0 0 $0 0 $0 FILES CLOSED FOR INCOMPLETENESS 0 $0 0 $0 0 $0
Aggregated Statistics For Year 2003(Based on 1 full and 2 partial tracts) A) Conventional B) Refinancings C) Non-occupant Loans on Number Average Value Number Average Value Number Average Value
LOANS ORIGINATED 11 $291,072 10 $285,459 0 $0 APPLICATIONS APPROVED, NOT ACCEPTED 1 $470,620 7 $325,249 1 $165,290 APPLICATIONS DENIED 0 $0 2 $274,335 0 $0 APPLICATIONS WITHDRAWN 2 $233,110 0 $0 0 $0 FILES CLOSED FOR INCOMPLETENESS 0 $0 1 $177,100 0 $0
Aggregated Statistics For Year 2002(Based on 1 full and 2 partial tracts) A) Conventional B) Refinancings C) Non-occupant Loans on Number Average Value Number Average Value Number Average Value
LOANS ORIGINATED 21 $275,000 6 $253,192 2 $275,915 APPLICATIONS APPROVED, NOT ACCEPTED 6 $257,992 6 $275,592 1 $260,840 APPLICATIONS DENIED 1 $341,790 0 $0 1 $341,790 APPLICATIONS WITHDRAWN 1 $124,280 0 $0 0 $0 FILES CLOSED FOR INCOMPLETENESS 0 $0 0 $0 0 $0
Aggregated Statistics For Year 2001(Based on 1 full and 2 partial tracts) A) Conventional B) Refinancings C) Non-occupant Loans on Number Average Value Number Average Value Number Average Value
LOANS ORIGINATED 27 $245,574 8 $232,360 0 $0 APPLICATIONS APPROVED, NOT ACCEPTED 11 $209,695 6 $236,488 1 $207,880 APPLICATIONS DENIED 2 $277,335 0 $0 0 $0 APPLICATIONS WITHDRAWN 0 $0 1 $66,960 0 $0 FILES CLOSED FOR INCOMPLETENESS 0 $0 1 $191,880 0 $0
Aggregated Statistics For Year 2000(Based on 1 full and 2 partial tracts) A) Conventional B) Refinancings C) Non-occupant Loans on Number Average Value Number Average Value Number Average Value
LOANS ORIGINATED 42 $214,699 7 $217,754 3 $226,317 APPLICATIONS APPROVED, NOT ACCEPTED 11 $192,750 3 $272,327 0 $0 APPLICATIONS DENIED 3 $146,730 1 $292,560 0 $0 APPLICATIONS WITHDRAWN 1 $196,880 0 $0 0 $0 FILES CLOSED FOR INCOMPLETENESS 0 $0 0 $0 0 $0
Aggregated Statistics For Year 1999(Based on 3 partial tracts) A) Conventional B) Refinancings C) Non-occupant Loans on Number Average Value Number Average Value Number Average Value
LOANS ORIGINATED 37 $176,098 12 $145,947 1 $90,380 APPLICATIONS APPROVED, NOT ACCEPTED 2 $237,745 6 $168,747 0 $0 APPLICATIONS DENIED 5 $162,764 1 $298,610 0 $0 APPLICATIONS WITHDRAWN 0 $0 1 $255,940 0 $0 FILES CLOSED FOR INCOMPLETENESS 0 $0 2 $129,880 0 $0
Detailed PMIC statistics for the following Tracts:
4355.00
, 4356.00 , 4357.00 Cherryland compared to California state average:
Unemployed percentage below state average. Black race population percentage above state average. Renting percentage above state average. Length of stay since moving in significantly above state average. Number of rooms per house below state average. Percentage of population with a bachelor's degree or higher below state average. Cherryland on our top lists :
#75 on the list of "Top 101 cities with the most residents born in Portugal (population 500+)"
#76 on the list of "Top 101 cities with the most people taking subway or elevated to work (population 5,000+)"
#84 on the list of "Top 101 cities with the most residents born in Oceania (population 500+)"
#86 on the list of "Top 101 cities with largest percentage of females in industries: other services, except public administration (population 5,000+)"
#98 on the list of "Top 100 cities with smallest houses (pop. 5,000+)"
#79 (94541) on the list of "Top 101 zip codes with the largest percentage of Portuguese first ancestries (pop 5,000+)"
#11 on the list of "Top 101 counties with the lowest Ozone (1-hour) air pollution readings in 2012 (ppm)"
#17 on the list of "Top 101 counties with highest percentage of residents voting for Obama (Democrat) in the 2012 Presidential Election (pop. 50,000+)"
#18 on the list of "Top 101 counties with the most Other congregations"
#21 on the list of "Top 101 counties with the highest surface withdrawal of fresh water for public supply (pop. 50,000+)"
#22 on the list of "Top 101 counties with the highest percentage of residents that exercised in the past month"


 Recent articles from our blog. Our writers, many of them Ph.D. graduates or candidates, create easy-to-read articles on a wide variety of topics.


 (2.1 miles