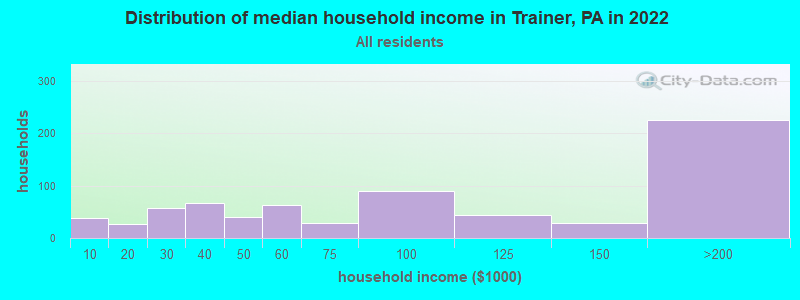
Percentage of residents living in poverty in 2022: 19.9%
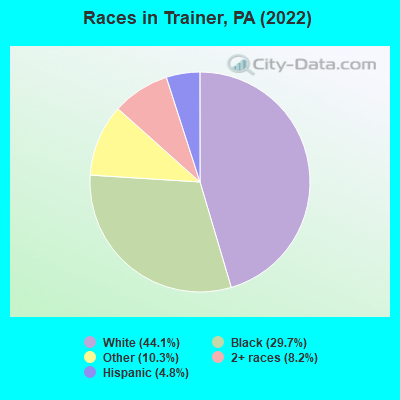
(12.8% for White Non-Hispanic residents, 37.9% for Black residents, 45.9% for Hispanic or Latino residents, 2.0% for other race residents, 26.1% for two or more races residents)
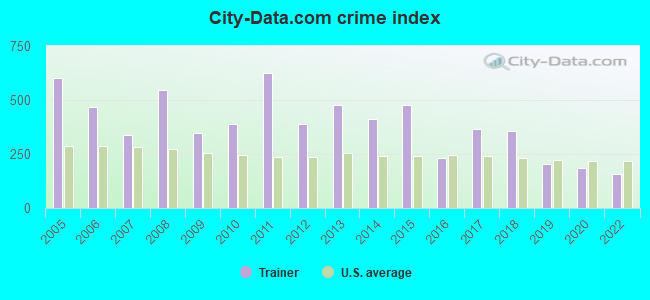
The City-Data.com crime index weighs serious crimes and violent crimes more heavily. Higher means more crime, U.S. average is 246.1. It adjusts for the number of visitors and daily workers commuting into cities.
Latest news from Trainer, PA collected exclusively by city-data.com from local newspapers, TV, and radio stations
Ancestries: American (12.4%), Irish (10.1%), Italian (5.4%), Polish (4.8%), German (2.2%), English (1.5%).
Current Local Time: EST time zone
Incorporated on 03/02/1919
Elevation: 60 feet
Land area: 1.06 square miles.
Population density: 1,852 people per square mile (low).
54 residents are foreign born (2.4% Africa, 0.6% Europe).
This borough:
3.3%
Pennsylvania:
7.3%
Median real estate property taxes paid for housing units with mortgages in 2022: $3,618 (2.8%) Median real estate property taxes paid for housing units with no mortgage in 2022: $3,827 (2.5%)
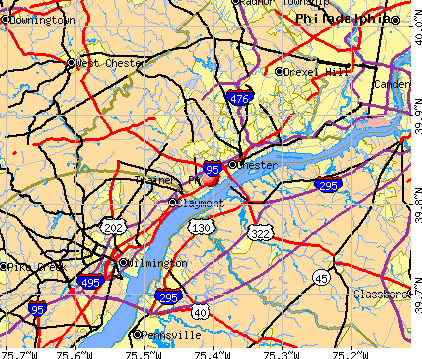
Nearest city with pop. 50,000+: Brandywine, DE (5.8 miles , pop. 78,620).
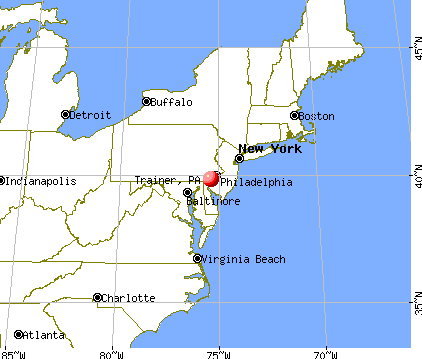
Nearest city with pop. 200,000+: Philadelphia, PA (18.1 miles , pop. 1,517,550).
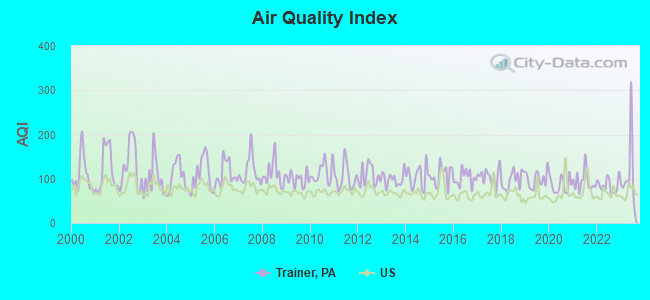
Air Quality Index (AQI) level in 2023 was 110. This is significantly worse than average.
City:
110
U.S.:
73
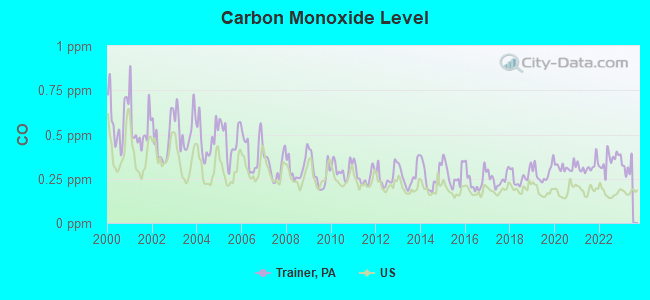
Carbon Monoxide (CO) [ppm] level in 2022 was 0.356. This is significantly worse than average.Closest monitor was 1.7 miles away from the city center.
City:
0.356
U.S.:
0.251
Nitrogen Dioxide (NO2) [ppb] level in 2023 was 9.04. This is significantly worse than average.Closest monitor was 1.7 miles away from the city center.
City:
9.04
U.S.:
5.11
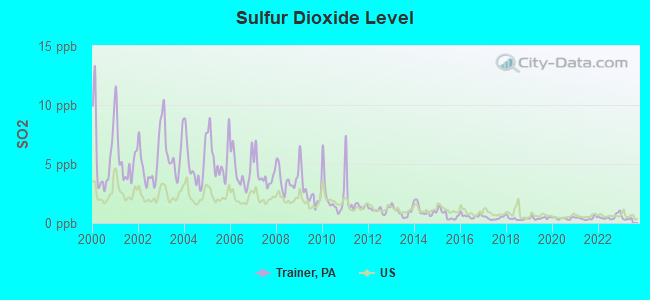
Sulfur Dioxide (SO2) [ppb] level in 2022 was 0.529. This is significantly better than average.Closest monitor was 0.9 miles away from the city center.
City:
0.529
U.S.:
1.515
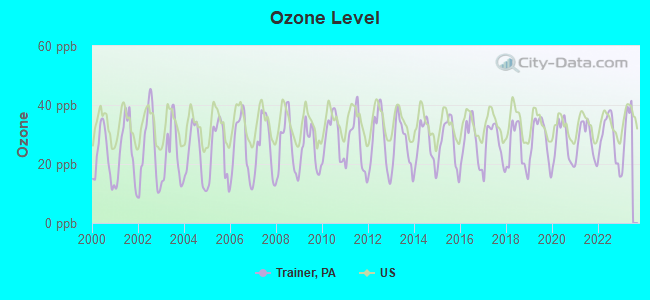
Ozone [ppb] level in 2022 was 28.8. This is about average.Closest monitor was 1.7 miles away from the city center.
City:
28.8
U.S.:
33.3
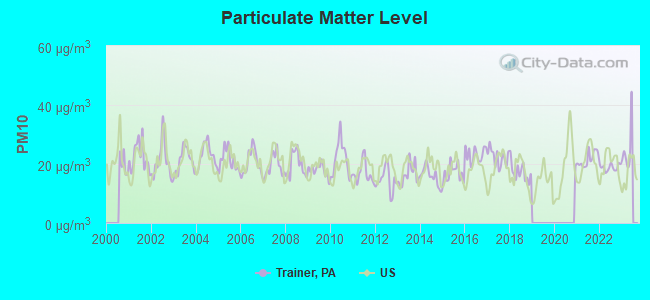
Particulate Matter (PM10) [µg/m3] level in 2022 was 18.9. This is about average.Closest monitor was 1.7 miles away from the city center.
City:
18.9
U.S.:
19.2
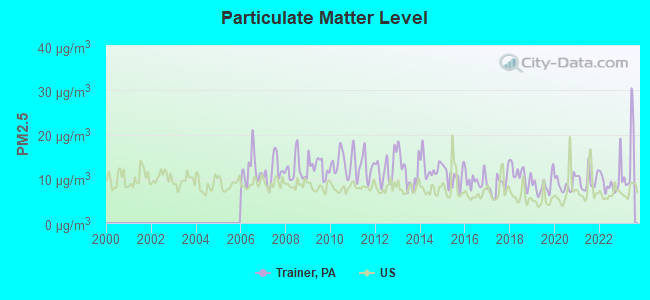
Particulate Matter (PM2.5) [µg/m3] level in 2023 was 14.2. This is significantly worse than average.Closest monitor was 0.9 miles away from the city center.
City:
14.2
U.S.:
8.1
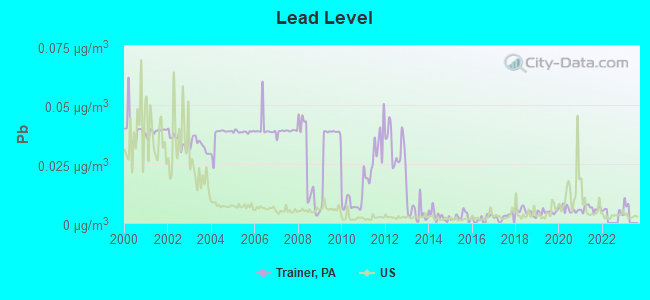
Lead (Pb) [µg/m3] level in 2021 was 0.00621. This is significantly better than average.Closest monitor was 0.9 miles away from the city center.
City:
0.00621
U.S.:
0.00931
Tornado activity:
Trainer-area historical tornado activity is slightly above Pennsylvania state average. It is 4% greater than the overall U.S. average.
On 4/28/1961, a category F3 (max. wind speeds 158-206 mph) tornado 14.1 miles away from the Trainer borough center causedbetween $5000 and $50,000 in damages.
On 3/22/1955, a category F3 tornado 15.1 miles away from the borough center killed one personand causedbetween $50,000 and $500,000 in damages.
Earthquake activity:
Trainer-area historical earthquake activity is significantly above Pennsylvania state average. It is 65% smaller than the overall U.S. average.
On 8/23/2011 at 17:51:04, a magnitude 5.8 (5.8 MW, Depth: 3.7 mi, Class: Moderate, Intensity: VI - VII) earthquake occurred 190.3 miles away from the city center On 1/16/1994 at 01:49:16, a magnitude 4.6 (4.6 MB, 4.6 LG, Depth: 3.1 mi, Class: Light, Intensity: IV - V) earthquake occurred 48.2 miles away from Trainer center On 1/16/1994 at 00:42:43, a magnitude 4.2 (4.2 MB, 4.0 LG, Depth: 3.1 mi) earthquake occurred 47.0 miles away from the city center On 11/30/2017 at 21:47:31, a magnitude 4.1 (4.1 MW, Depth: 6.1 mi) earthquake occurred 43.7 miles away from the city center On 10/7/1983 at 10:18:46, a magnitude 5.3 (5.1 MB, 5.3 LG, 5.1 ML) earthquake occurred 290.5 miles away from Trainer center On 9/25/1998 at 19:52:52, a magnitude 5.2 (4.8 MB, 4.3 MS, 5.2 LG, 4.5 MW, Depth: 3.1 mi) earthquake occurred 286.0 miles away from Trainer center Magnitude types: regional Lg-wave magnitude (LG), body-wave magnitude (MB), local magnitude (ML), surface-wave magnitude (MS), moment magnitude (MW)
Natural disasters:
The number of natural disasters in Delaware County (21) is greater than the US average (15). Major Disasters (Presidential) Declared: 15 Emergencies Declared: 6
Causes of natural disasters: Hurricanes: 5, Floods: 4, Winter Storms: 4, Storms: 3, Tropical Storms: 3, Snowstorms: 2, Blizzard: 1, Snowfall: 1, Tropical Depression: 1, Water Shortage: 1, Other: 1 (Note: some incidents may be assigned to more than one category).
Hospitals and medical centers near Trainer:
COMMUNITY HOSPITAL OF CHESTER (Hospital, about 1 miles away; CHESTER, PA)
DEVEREUX FOUNDATION BEESON (Hospital, about 2 miles away; BOOTHWYN, PA)
CHESTER CARE CENTER (Nursing Home, about 3 miles away; CHESTER, PA)
THE BELVEDERE CENTER, GENESIS HEALTHCARE (Nursing Home, about 4 miles away; CHESTER, PA)
ELWYN NETHER PROVIDENCE (Hospital, about 4 miles away; WALLINGFORD, PA)
ELWYN INC/WOODLYN (Hospital, about 5 miles away; WOODLYN, PA)
FRESENIUS MEDICAL CARE SWARTHMORE (Dialysis Facility, about 5 miles away; SWARTHMORE, PA)
Amtrak stations near Trainer:
11 miles: WILMINGTON (M. L. KING BLVD, & FRENCH ST.) . Services: ticket office, partially wheelchair accessible, enclosed waiting area, public restrooms, public payphones, snack bar, ATM, paid short-term parking, paid long-term parking, car rental agency, taxi stand, intercity bus service, public transit connection.
14 miles: ARDMORE (STATION RD. & LANCASTER AVE.) . Services: enclosed waiting area, public restrooms, public payphones, paid short-term parking, call for car rental service, call for taxi service, public transit connection.
15 miles: PHILADELPHIA (30TH & MARKET STS.) . Services: ticket office, fully wheelchair accessible, enclosed waiting area, public restrooms, public payphones, snack bar, ATM, paid short-term parking, paid long-term parking, car rental agency, taxi stand, public transit connection.
Operable nuclear power plants near Trainer:
19 miles: Salem 2 in Salem, NJ.
19 miles: Hope Creek in Salem, NJ.
19 miles: Salem 1 in Salem, NJ.
Colleges/universities with over 2000 students nearest to Trainer:
Notable locations in Trainer: Trainer Station (A), Lennox Park Company 1 Fire Station (B), Trainer Borough Hall (C), Stoney Creek Technologies Emergency Response (D), Trainer Police Department (E). Display/hide their locations on the map
MCL, Monthly (TCR) - In SEP-2011, Contaminant: Coliform. Follow-up actions: St Violation/Reminder Notice (SEP-13-2011), St Public Notif requested (SEP-13-2011), St Public Notif received (SEP-29-2011), St Compliance achieved (OCT-25-2011)
Past monitoring violations:
Follow-up Or Routine LCR Tap M/R - In OCT-01-2009, Contaminant: Lead and Copper Rule. Follow-up actions: St Public Notif requested (OCT-27-2009), St Violation/Reminder Notice (OCT-27-2009), St Public Notif received (NOV-30-2009), St Compliance achieved (NOV-15-2010)
One routine major monitoring violation
Average household size:
This borough:
2.9 people
Pennsylvania:
2.5 people
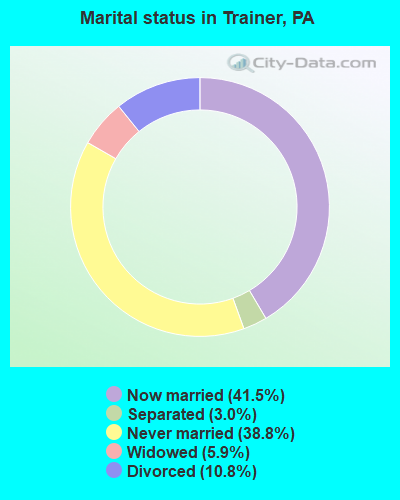
Percentage of family households:
This borough:
74.6%
Whole state:
65.0%
Percentage of households with unmarried partners:
This borough:
10.9%
Whole state:
6.6%
Likely homosexual households (counted as self-reported same-sex unmarried-partner households)
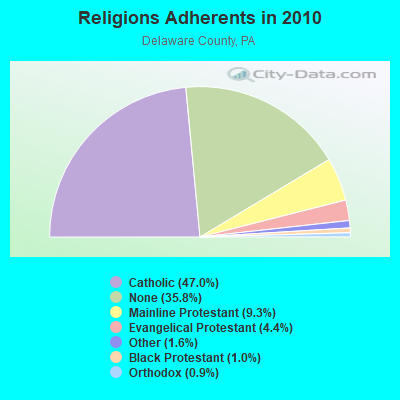
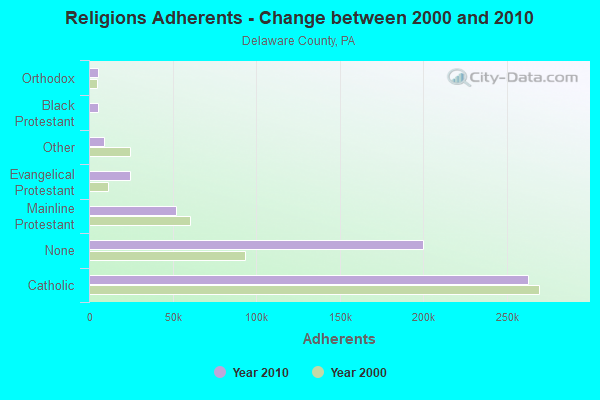
Religion statistics for Trainer, PA (based on Delaware County data)
Religion
Adherents
Congregations
Catholic
262,506
50
Mainline Protestant
52,224
169
Evangelical Protestant
24,456
136
Other
9,009
27
Black Protestant
5,617
39
Orthodox
5,096
8
None
200,071
-
Source: Clifford Grammich, Kirk Hadaway, Richard Houseal, Dale E.Jones, Alexei Krindatch, Richie Stanley and Richard H.Taylor. 2012. 2010 U.S.Religion Census: Religious Congregations & Membership Study. Association of Statisticians of American Religious Bodies. Jones, Dale E., et al. 2002. Congregations and Membership in the United States 2000. Nashville, TN: Glenmary Research Center. Graphs represent county-level data
Nov 13, 2002 06:26 PM, Third St, Vehicles: 1, Persons: 5, Fatalities: 1, Drunk persons involved: 1
Dec 19, 1983 03:99 PM, 01249, Vehicles: 1, Persons: 3, Fatalities: 1
Jun 30, 1980 11:00 PM, Vehicles: 2, Persons: 4, Fatalities: 2
Oct 12, 1980 11:00 PM, Persons: 1, Fatalities: 1
Jun 28, 1977 02:20 PM, Vehicles: 2, Persons: 2, Fatalities: 1
National Bridge Inventory (NBI) Statistics
2Number of bridges
10ft / 2.7mTotal length
$987,000Total costs
9,924Total average daily traffic
536Total average daily truck traffic
11,594Total future (year 2032) average daily traffic
FCC Registered Broadcast Land Mobile Towers:
1
3rd & Price Sts (Lat: 39.827889 Lon: -75.399083), Call Sign: KNIR581, Assigned Frequencies: 46.3800 MHz, 46.4200 MHz, Grant Date: 01/12/1999, Expiration Date: 03/28/2004, Cancellation Date: 11/20/2003, Registrant: Trainer Fire Company 1, 3rd Price Sts, Trainer, PA 19061, Phone: (215) 497-5443
FCC Registered Amateur Radio Licenses:
4
Call Sign: N3UXP, Grant Date: 04/03/1995, Expiration Date: 04/03/2005, Cancellation Date: 04/04/2007, Registrant: Mark D Bireley Sr, 3700 W 9th St, Trainer, PA 19061
Call Sign: KB3ERY, Licensee ID: L00220699, Grant Date: 03/22/2000, Expiration Date: 03/22/2010, Cancellation Date: 05/23/2000, Certifier: Joseph A Rzucidlo, Registrant: Joseph A Rzucidlo, 1013 Anderson St, Trainer, PA 19061-5233
Call Sign: K3CGA, Previous Call Sign: KB3ERY, Licensee ID: L00220699, Grant Date: 05/23/2000, Expiration Date: 05/23/2010, Cancellation Date: 03/17/2009, Certifier: Joseph A Rzucidlo, Registrant: Joseph A Rzucidlo, 1013 Anderson St, Trainer, PA 19061-5233
Call Sign: KB3YHD, Licensee ID: L01696624, Grant Date: 02/28/2022, Expiration Date: 03/16/2032, Certifier: James W Shahadi, Registrant: James W Shahadi, 1354 Forrest St, Trainer, PA 19061
Home Mortgage Disclosure Act Aggregated Statistics For Year 2009 (Based on 1 full tract)
A) FHA, FSA/RHS & VA Home Purchase Loans
B) Conventional Home Purchase Loans
C) Refinancings
D) Home Improvement Loans
F) Non-occupant Loans on < 5 Family Dwellings (A B C & D)
Number
Average Value
Number
Average Value
Number
Average Value
Number
Average Value
Number
Average Value
LOANS ORIGINATED
7
$115,429
4
$52,250
18
$89,000
4
$16,750
0
$0
APPLICATIONS APPROVED, NOT ACCEPTED
2
$114,000
0
$0
2
$76,500
1
$3,000
0
$0
APPLICATIONS DENIED
0
$0
1
$135,000
16
$100,125
13
$53,538
4
$83,000
APPLICATIONS WITHDRAWN
0
$0
0
$0
11
$125,091
0
$0
0
$0
FILES CLOSED FOR INCOMPLETENESS
0
$0
1
$23,000
0
$0
1
$140,000
0
$0
Aggregated Statistics For Year 2008 (Based on 1 full tract)
A) FHA, FSA/RHS & VA Home Purchase Loans
B) Conventional Home Purchase Loans
C) Refinancings
D) Home Improvement Loans
F) Non-occupant Loans on < 5 Family Dwellings (A B C & D)
Number
Average Value
Number
Average Value
Number
Average Value
Number
Average Value
Number
Average Value
LOANS ORIGINATED
10
$118,800
10
$88,100
29
$100,207
10
$34,300
7
$79,143
APPLICATIONS APPROVED, NOT ACCEPTED
1
$97,000
0
$0
3
$109,000
3
$52,667
1
$75,000
APPLICATIONS DENIED
1
$98,000
2
$52,500
19
$92,316
12
$12,333
4
$28,000
APPLICATIONS WITHDRAWN
1
$98,000
2
$73,500
7
$125,714
1
$78,000
1
$90,000
FILES CLOSED FOR INCOMPLETENESS
0
$0
1
$140,000
2
$67,000
4
$85,250
0
$0
Aggregated Statistics For Year 2007 (Based on 1 full tract)
A) FHA, FSA/RHS & VA Home Purchase Loans
B) Conventional Home Purchase Loans
C) Refinancings
D) Home Improvement Loans
F) Non-occupant Loans on < 5 Family Dwellings (A B C & D)
Number
Average Value
Number
Average Value
Number
Average Value
Number
Average Value
Number
Average Value
LOANS ORIGINATED
6
$124,667
23
$86,826
47
$97,638
10
$29,200
14
$85,714
APPLICATIONS APPROVED, NOT ACCEPTED
1
$91,000
4
$63,750
6
$79,500
1
$2,000
3
$62,333
APPLICATIONS DENIED
0
$0
3
$70,333
52
$108,596
17
$42,118
8
$48,750
APPLICATIONS WITHDRAWN
0
$0
5
$94,200
16
$95,062
2
$81,500
3
$56,667
FILES CLOSED FOR INCOMPLETENESS
0
$0
3
$149,333
8
$80,875
1
$99,000
1
$88,000
Aggregated Statistics For Year 2006 (Based on 1 full tract)
A) FHA, FSA/RHS & VA Home Purchase Loans
B) Conventional Home Purchase Loans
C) Refinancings
D) Home Improvement Loans
F) Non-occupant Loans on < 5 Family Dwellings (A B C & D)
Number
Average Value
Number
Average Value
Number
Average Value
Number
Average Value
Number
Average Value
LOANS ORIGINATED
3
$101,667
41
$84,366
48
$84,312
5
$29,200
19
$87,211
APPLICATIONS APPROVED, NOT ACCEPTED
0
$0
6
$76,500
7
$75,286
1
$50,000
4
$59,000
APPLICATIONS DENIED
0
$0
11
$78,000
44
$82,068
21
$53,619
4
$55,000
APPLICATIONS WITHDRAWN
1
$146,000
7
$62,143
28
$119,714
1
$150,000
5
$76,000
FILES CLOSED FOR INCOMPLETENESS
0
$0
1
$225,000
4
$109,000
0
$0
0
$0
Aggregated Statistics For Year 2005 (Based on 1 full tract)
A) FHA, FSA/RHS & VA Home Purchase Loans
B) Conventional Home Purchase Loans
C) Refinancings
D) Home Improvement Loans
F) Non-occupant Loans on < 5 Family Dwellings (A B C & D)
Number
Average Value
Number
Average Value
Number
Average Value
Number
Average Value
Number
Average Value
LOANS ORIGINATED
3
$94,667
35
$67,829
39
$86,256
14
$77,786
16
$71,188
APPLICATIONS APPROVED, NOT ACCEPTED
0
$0
2
$47,000
14
$81,643
2
$30,000
1
$42,000
APPLICATIONS DENIED
1
$94,000
12
$69,833
45
$81,111
21
$41,000
8
$57,500
APPLICATIONS WITHDRAWN
0
$0
2
$74,000
27
$91,704
7
$81,857
2
$72,000
FILES CLOSED FOR INCOMPLETENESS
1
$119,000
2
$74,500
14
$86,429
1
$15,000
1
$111,000
Aggregated Statistics For Year 2004 (Based on 1 full tract)
A) FHA, FSA/RHS & VA Home Purchase Loans
B) Conventional Home Purchase Loans
C) Refinancings
D) Home Improvement Loans
F) Non-occupant Loans on < 5 Family Dwellings (A B C & D)
G) Loans On Manufactured Home Dwelling (A B C & D)
Number
Average Value
Number
Average Value
Number
Average Value
Number
Average Value
Number
Average Value
Number
Average Value
LOANS ORIGINATED
2
$106,500
24
$76,833
46
$76,652
9
$38,111
13
$67,231
0
$0
APPLICATIONS APPROVED, NOT ACCEPTED
0
$0
6
$71,000
24
$81,667
2
$51,000
3
$59,667
1
$38,000
APPLICATIONS DENIED
1
$60,000
10
$68,000
52
$79,135
6
$26,000
5
$55,600
1
$138,000
APPLICATIONS WITHDRAWN
0
$0
3
$67,667
29
$80,552
5
$46,200
3
$79,667
0
$0
FILES CLOSED FOR INCOMPLETENESS
0
$0
2
$61,000
14
$81,786
1
$92,000
2
$68,000
0
$0
Aggregated Statistics For Year 2003 (Based on 1 full tract)
A) FHA, FSA/RHS & VA Home Purchase Loans
B) Conventional Home Purchase Loans
C) Refinancings
D) Home Improvement Loans
F) Non-occupant Loans on < 5 Family Dwellings (A B C & D)
Number
Average Value
Number
Average Value
Number
Average Value
Number
Average Value
Number
Average Value
LOANS ORIGINATED
6
$89,167
20
$62,250
47
$62,830
1
$10,000
15
$45,533
APPLICATIONS APPROVED, NOT ACCEPTED
0
$0
1
$51,000
22
$65,500
1
$15,000
3
$53,000
APPLICATIONS DENIED
0
$0
4
$57,500
67
$75,149
11
$24,636
2
$78,000
APPLICATIONS WITHDRAWN
0
$0
3
$82,667
21
$58,333
0
$0
2
$74,500
FILES CLOSED FOR INCOMPLETENESS
0
$0
0
$0
5
$58,200
0
$0
0
$0
Aggregated Statistics For Year 2002 (Based on 1 full tract)
A) FHA, FSA/RHS & VA Home Purchase Loans
B) Conventional Home Purchase Loans
C) Refinancings
D) Home Improvement Loans
F) Non-occupant Loans on < 5 Family Dwellings (A B C & D)
Number
Average Value
Number
Average Value
Number
Average Value
Number
Average Value
Number
Average Value
LOANS ORIGINATED
9
$78,000
17
$54,000
34
$59,353
6
$32,167
14
$49,071
APPLICATIONS APPROVED, NOT ACCEPTED
0
$0
2
$64,000
7
$79,714
0
$0
0
$0
APPLICATIONS DENIED
0
$0
5
$49,400
35
$77,600
10
$12,100
1
$22,000
APPLICATIONS WITHDRAWN
0
$0
1
$42,000
21
$80,429
2
$19,500
3
$53,000
FILES CLOSED FOR INCOMPLETENESS
0
$0
0
$0
11
$62,545
0
$0
0
$0
Aggregated Statistics For Year 2001 (Based on 1 full tract)
A) FHA, FSA/RHS & VA Home Purchase Loans
B) Conventional Home Purchase Loans
C) Refinancings
D) Home Improvement Loans
F) Non-occupant Loans on < 5 Family Dwellings (A B C & D)
Number
Average Value
Number
Average Value
Number
Average Value
Number
Average Value
Number
Average Value
LOANS ORIGINATED
14
$75,214
7
$55,000
25
$54,040
11
$22,818
6
$55,167
APPLICATIONS APPROVED, NOT ACCEPTED
1
$78,000
4
$27,000
7
$56,286
0
$0
1
$22,000
APPLICATIONS DENIED
1
$50,000
1
$25,000
25
$62,040
8
$20,000
1
$63,000
APPLICATIONS WITHDRAWN
0
$0
0
$0
25
$60,800
3
$65,000
1
$33,000
FILES CLOSED FOR INCOMPLETENESS
0
$0
0
$0
3
$74,333
0
$0
1
$64,000
Aggregated Statistics For Year 2000 (Based on 1 full tract)
A) FHA, FSA/RHS & VA Home Purchase Loans
B) Conventional Home Purchase Loans
C) Refinancings
D) Home Improvement Loans
F) Non-occupant Loans on < 5 Family Dwellings (A B C & D)
Number
Average Value
Number
Average Value
Number
Average Value
Number
Average Value
Number
Average Value
LOANS ORIGINATED
7
$74,571
12
$48,500
14
$48,643
9
$21,333
6
$49,500
APPLICATIONS APPROVED, NOT ACCEPTED
0
$0
1
$64,000
2
$67,500
4
$31,250
0
$0
APPLICATIONS DENIED
0
$0
1
$64,000
30
$61,133
16
$19,250
3
$47,333
APPLICATIONS WITHDRAWN
0
$0
1
$54,000
9
$59,111
4
$34,750
0
$0
FILES CLOSED FOR INCOMPLETENESS
0
$0
1
$77,000
2
$43,500
0
$0
0
$0
Aggregated Statistics For Year 1999 (Based on 1 full tract)
A) FHA, FSA/RHS & VA Home Purchase Loans
B) Conventional Home Purchase Loans
C) Refinancings
D) Home Improvement Loans
F) Non-occupant Loans on < 5 Family Dwellings (A B C & D)


 Recent articles from our blog. Our writers, many of them Ph.D. graduates or candidates, create easy-to-read articles on a wide variety of topics.


 , pop. 78,620).