Downtown (Downtown Historic District) neighborhood in Ossining, New York (NY), 10562 detailed profile
Settings
X


Business Search - 14 Million verified businesses
Area: 0.059 square miles
Population: 662
Population density:
| Downtown (Downtown Historic District): | 11,184 people per square mile |
| Ossining: | 8,418 people per square mile |

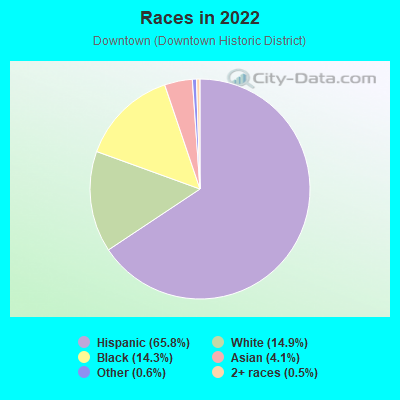
- 43865.8%Hispanic or Latino
- 9914.9%White
- 9514.3%Black
- 274.1%Asian
- 40.6%Some other race
- 30.5%Two or more races
Median household income in 2022:
| Downtown (Downtown Historic District): | $96,994 |
| Ossining: | $99,678 |
Distribution of median household income
![Distribution of median household income]()
- 3Less than $10,000
- 8$10,000 to $19,999
- 3$20,000 to $29,999
- 4$30,000 to $39,999
- 7$40,000 to $49,999
- 6$50,000 to $59,999
- 9$60,000 to $74,999
- 40$75,000 to $99,999
- 57$100,000 to $124,999
- 44$125,000 to $149,999
- 40$150,000 to $199,999
- 35$200,000 or more

Distribution of owner-occupied house/condo value
![Distribution of owner-occupied house/condo value]()
- 6Less than $50,000
- 23$50,000 to $99,999
- 1$100,000 to $149,999
- 8$150,000 to $199,999
- 21$200,000 to $249,999
- 29$250,000 to $299,999
- 25$300,000 to $399,999
- 12$400,000 to $499,999
- 22$500,000 to $749,999
- 3$750,000 to $999,999
- 1$1,000,000 or more

Distribution of rent paid by renters
![Distribution of rent paid by renters]()
- 2$200 to $299
- 1$400 to $499
- 10$500 to $599
- 2$600 to $699
- 1$700 to $799
- 6$800 to $899
- 10$1,000 to $1,249
- 4$1,250 to $1,499
- 31$1,500 to $1,999
- 175$2,000 or more

Median rent in 2022:
| Downtown (Downtown Historic District): | $2,189 |
| Ossining: | $1,892 |
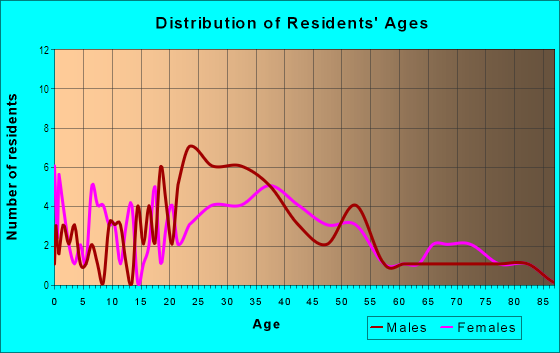
| Males: | 323 |
| Females: | 339 |
Males:
| This neighborhood: | 30.2 years |
| Whole city: | 40.6 years |
| This neighborhood: | 36.3 years |
| Whole city: | 42.3 years |
Average household size:
| Downtown (Downtown Historic District): | 19.3 people |
| Ossining: | 2.6 people |
Percentage of family households:
| Downtown (Downtown Historic District): | 65.7% |
| Ossining: | 47.5% |
| Here: | 31.6% |
| Ossining: | 49.3% |
Percentage of married-couple families with children (among all households):
| Downtown (Downtown Historic District): | 13.6% |
| Ossining: | 26.5% |
Percentage of single-mother households (among all households):
| Downtown (Downtown Historic District): | 16.0% |
| Ossining: | 7.8% |
Percentage of never married males 15 years old and over:
Percentage of never married females 15 years old and over:
| Downtown (Downtown Historic District): | 24.6% |
| Ossining: | 21.0% |
Percentage of never married females 15 years old and over:
| Downtown (Downtown Historic District): | 16.9% |
| village: | 16.0% |
Percentage of people that speak English not well or not at all:
| Downtown (Downtown Historic District): | 23.7% |
| Ossining: | 12.9% |
Percentage of people born in this state:
Percentage of people born in another U.S. state:
Percentage of native residents but born outside the U.S.:
Percentage of foreign born residents:
| Here: | 47.9% |
| Ossining: | 55.3% |
Percentage of people born in another U.S. state:
| Downtown (Downtown Historic District): | 9.2% |
| Ossining: | 7.9% |
Percentage of native residents but born outside the U.S.:
| Here: | 8.7% |
| village: | 3.8% |
Percentage of foreign born residents:
| Here: | 34.2% |
| Ossining: | 33.1% |
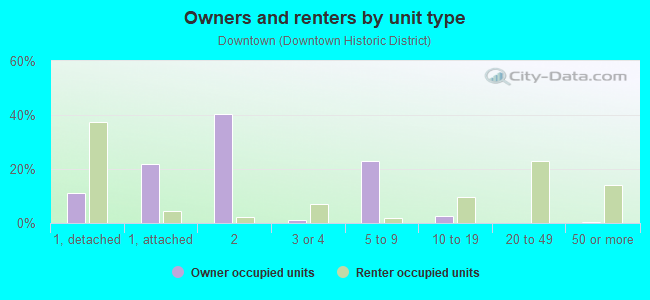
Owner-occupied
Renter-occupied

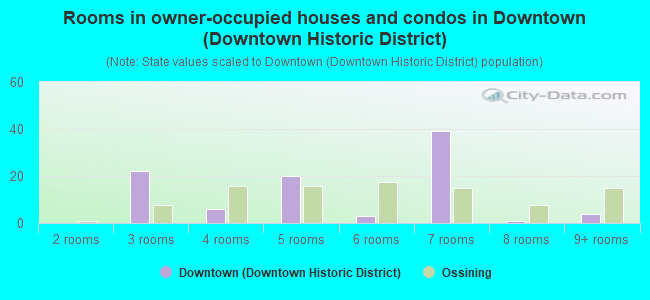
- Rooms in owner-occupied houses and condos in Downtown <
> - 01 room
- 02 rooms
- 223 rooms
- 64 rooms
- 205 rooms
- 36 rooms
- 397 rooms
- 18 rooms
- 49+ rooms
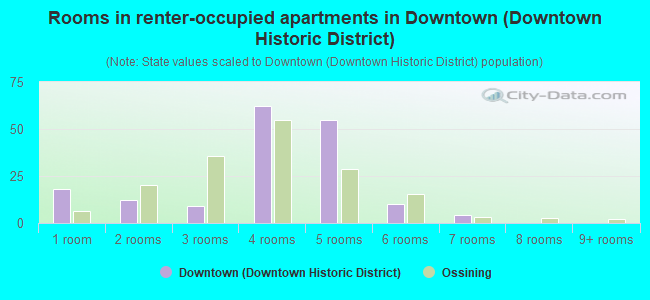
- Rooms in renter-occupied apartments in Downtown <
> - 181 room
- 122 rooms
- 93 rooms
- 624 rooms
- 555 rooms
- 106 rooms
- 47 rooms
- 08 rooms
- 09+ rooms
Owner-occupied
Renter-occupied
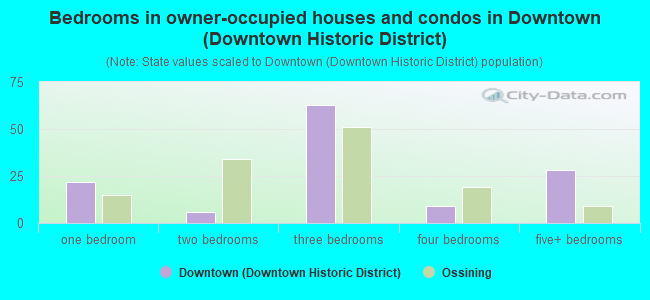
- Bedrooms in owner-occupied houses and condos in Downtown <
> - 0no bedroom
- 221 bedroom
- 62 bedrooms
- 633 bedrooms
- 94 bedrooms
- 285+ bedrooms
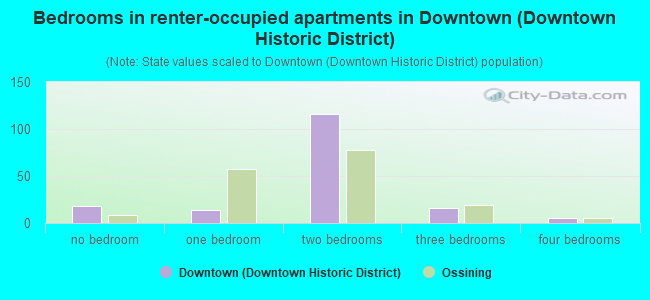
- Bedrooms in renter-occupied apartments in Downtown <
> - 18no bedroom
- 141 bedroom
- 1162 bedrooms
- 163 bedrooms
- 54 bedrooms
- 05+ bedrooms
Average number of cars or other vehicles available in houses/condos:
Average number of cars or other vehicles available in apartments:
| This neighborhood: | 1.4 |
| Ossining: | 1.8 |
Average number of cars or other vehicles available in apartments:
| Here: | 1.9 |
| village: | 1.3 |
Percentage of units with a mortgage:
| Downtown (Downtown Historic District): | 88.1% |
| Ossining: | 67.1% |
Housing prices:
- Average estimated value of detached houses in 2022 (29.5% of all units):
Downtown (Downtown Historic District): $509,288 Ossining: $463,587
- Average estimated value of townhouses or other attached units in 2022 (12.3% of all units):
This neighborhood: $613,235 village: $414,509
- Average estimated value of housing units in 2-unit structures in 2022 (17.2% of all units):
This neighborhood: $441,437 Ossining: $518,730
- Average estimated '22 value of housing units in 3-to-4-unit structures (8.4% of all units):
Downtown (Downtown Historic District): $422,163 village: $350,162
- Average estimated '22 value of housing units in 5-or-more-unit structures (16.3% of all units):
Downtown (Downtown Historic District): $307,610 Ossining: $304,976
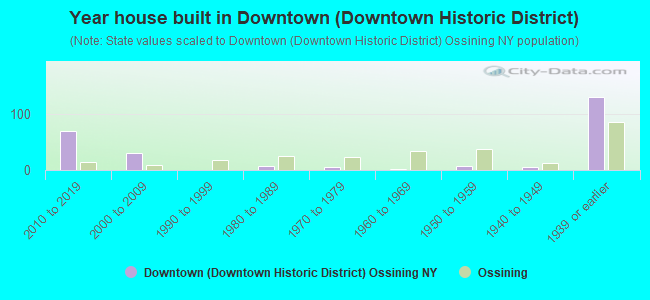
- Year house built in Downtown <
> - 02020 or later
- 702010 to 2019
- 302000 to 2009
- 01990 to 1999
- 71980 to 1989
- 61970 to 1979
- 11960 to 1969
- 81950 to 1959
- 51940 to 1949
- 1301939 or earlier
City-data.com crime index for village in 2020 (higher means more crime):
| City: | 50.8 |
| U.S. average: | 219.5 |
Travel time to work (commute)
![Travel time to work (commute)]()
- 3Less than 5 minutes
- 125 to 9 minutes
- 1410 to 14 minutes
- 1715 to 19 minutes
- 2420 to 24 minutes
- 1225 to 29 minutes
- 2630 to 34 minutes
- 235 to 39 minutes
- 440 to 44 minutes
- 5245 to 59 minutes
- 960 to 89 minutes
- 2190 or more minutes

Means of transportation to work
![Means of transportation to work]()
- 49.4%182Drove a car alone
- 14.1%52Carpooled
- 10.3%38Bus
- 7.1%26Subway or elevated rail
- 7.1%26Long-distance train or commuter rail
- 0.3%1Taxi
- 24.7%91Worked at home

Time leaving home to go to work
![Time leaving home to go to work]()
- 55:00 a.m. to 5:29 a.m.
- 15:30 a.m. to 5:59 a.m.
- 36:00 a.m. to 6:29 a.m.
- 106:30 a.m. to 6:59 a.m.
- 337:00 a.m. to 7:29 a.m.
- 197:30 a.m. to 7:59 a.m.
- 248:00 a.m. to 8:29 a.m.
- 258:30 a.m. to 8:59 a.m.
- 319:00 a.m. to 9:59 a.m.
- 411:00 a.m. to 11:59 a.m.
- 512:00 p.m. to 3:59 p.m.
- 104:00 p.m. to 11:59 p.m.

Occupations of males:
- Percentage of males in management occupations (except farmers):
Here: 23.7% village: 11.6%
- Percentage of males in business and financial operations occupations:
Here: 2.4% village: 7.5%
- Percentage of males in community and social services occupations:
Here: 1.1% village: 2.0%
- Percentage of males in legal occupations:
Here: 4.1% village: 0.7%
- Percentage of males in arts, design, entertainment, sports, and media occupations:
Here: 3.5% village: 5.1%
- Percentage of males in service occupations:
Here: 12.0% village: 18.6%
- Percentage of males in sales and office occupations:
Here: 8.2% village: 8.6%
- Percentage of males in construction, extraction, and maintenance occupations:
Here: 41.1% village: 16.7%
- Percentage of males in transportation occupations:
Here: 2.1% village: 3.2%
Occupations of females:
- Percentage of females in management occupations (except farmers):
Here: 11.8% village: 10.4%
- Percentage of females in business and financial operations occupations:
Here: 3.1% village: 5.9%
- Percentage of females in life, physical, and social science occupations:
Here: 11.2% village: 2.4%
- Percentage of females in community and social services occupations:
Here: 2.4% village: 3.2%
- Percentage of females in education, training, and library occupations:
Here: 31.9% village: 17.8%
- Percentage of females in arts, design, entertainment, sports, and media occupations:
Here: 4.0% village: 2.5%
- Percentage of females in healthcare practitioners and technical occupations:
Here: 1.3% village: 6.7%
- Percentage of females in service occupations:
Here: 9.1% village: 17.9%
- Percentage of females in sales and office occupations:
Here: 9.6% village: 23.4%
- Percentage of females in production occupations:
Here: 14.9% village: 3.2%
Percentage of people 16-64 in Armed Forces:
| Downtown (Downtown Historic District): | 0.0% |
| Ossining: | 0.2% |
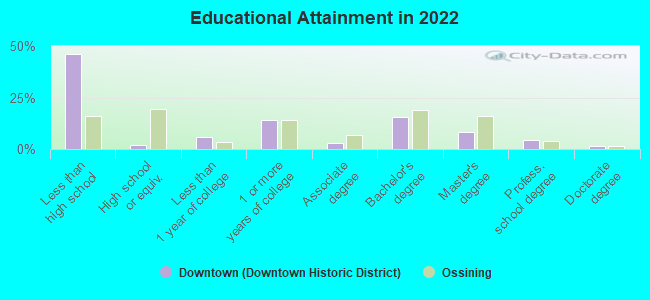
Education in this neighborhood (subdivision or community):
- Percentage of people 3 years and older in K-12 schools:
Downtown (Downtown Historic District): 23.3% Ossining: 14.4%
- Percentage of people 3 years and older in undergraduate colleges:
Downtown (Downtown Historic District): 2.6% Ossining: 3.9%
- Percentage of people 3 years and older in grad. or professional schools:
Downtown (Downtown Historic District): 1.2% Ossining: 2.4%
- Percentage of students K-12 enrolled in private schools:
Downtown (Downtown Historic District): 0.7% Ossining: 7.1%
Percentage of population below poverty level:
| Downtown (Downtown Historic District): | 10.4% |
| Ossining: | 7.4% |
Median year owner moved in (as recorded in 2022):
Median year renter moved in (as recorded in 2022):
| Downtown (Downtown Historic District): | 2007 |
| Ossining: | 2008 |
Median year renter moved in (as recorded in 2022):
| Downtown (Downtown Historic District): | 2013 |
| Ossining: | 2015 |
Percentage of married-couple families with both working:
| Downtown (Downtown Historic District): | 65.6% |
| Ossining: | 79.5% |
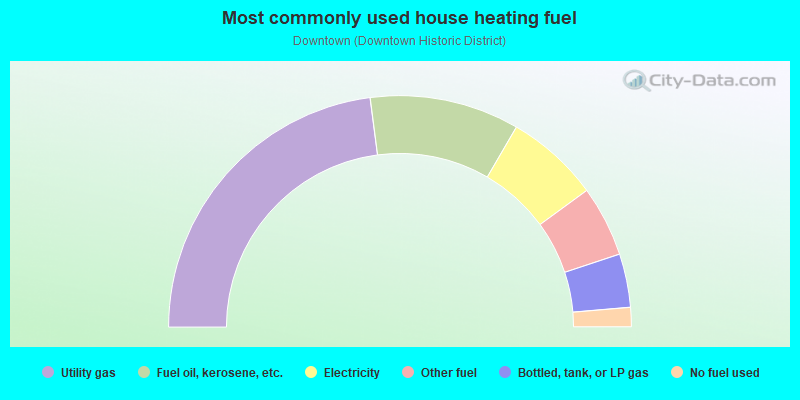
- 45.9%Utility gas
- 20.9%Fuel oil, kerosene, etc.
- 13.1%Electricity
- 9.9%Other fuel
- 7.5%Bottled, tank, or LP gas
- 2.7%No fuel used
Highways in this neighborhood:
S Highland Ave (US Hwy 9, Albany Post Rd)
Length: 0.12 miles
Direction: N-S
Address range: 2 to 23
Direction: N-S
Address range: 2 to 23
Upper Croton Ave (State Hwy 133)
Length: 0.10 miles
Direction: SW-NE
Address range: 1 to 18
Direction: SW-NE
Address range: 1 to 18
Roads and streets:
Main St
Length: 0.30 miles
Directions: E-W, SW-NE
Address range: 100 to 299
Directions: E-W, SW-NE
Address range: 100 to 299
Leonard St
Length: 0.14 miles
Directions: E-W, N-S, SE-NW, SW-NE
Address range: 1 to 199
Directions: E-W, N-S, SE-NW, SW-NE
Address range: 1 to 199
Eastern Ave
Length: 0.10 miles
Direction: E-W
Address range: 1 to 22
Direction: E-W
Address range: 1 to 22
Church St
Length: 0.10 miles
Direction: E-W
Address range: 1 to 99
Direction: E-W
Address range: 1 to 99
Prospect Pl
Length: 0.08 miles
Direction: N-S
Address range: 1 to 99
Direction: N-S
Address range: 1 to 99
Broadway
Length: 0.08 miles
Directions: E-W, SE-NW
Directions: E-W, SE-NW
Elizabeth St
Length: 0.05 miles
Direction: E-W
Direction: E-W
Brandreth St
Length: 0.04 miles
Direction: N-S
Address range: 2 to 99
Direction: N-S
Address range: 2 to 99
Other features:
Old Croton Trailway State Park
Length: 0.09 miles
Directions: N-S, SE-NW
Directions: N-S, SE-NW