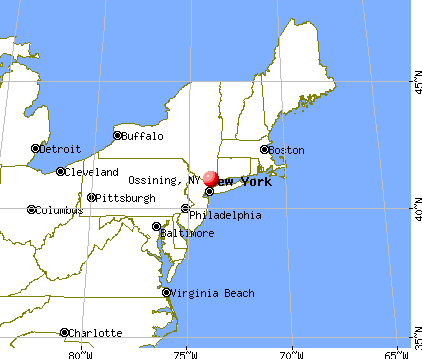
Ossining, New York

Ossining: Road To Ceder Lane Park
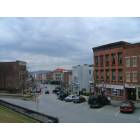
Ossining: Looking Down At Maine St

Ossining: sunset over the Hudson River, Ossining, NY

Ossining: Ossining waterfront
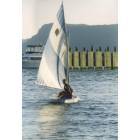
Ossining: Sailing out of Shattemuc
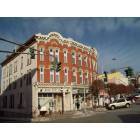
Ossining: Town Square
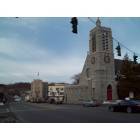
Ossining: Main Street
Ossining: Ceder Lane Park Ossining, N.Y.
- add
your


Submit your own pictures of this village and show them to the world
- OSM Map
- General Map
- Google Map
- MSN Map
Population change since 2000: +10.9%
 |
| Males: 13,877 | |
| Females: 12,756 |
| Median resident age: | 42.0 years |
| New York median age: | 40.0 years |
Zip codes: 10562.
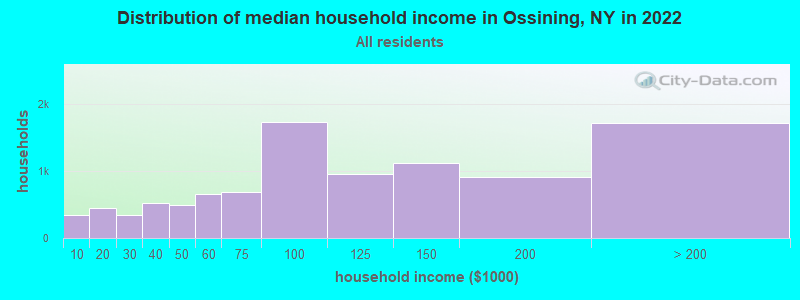
| Ossining: | $94,021 |
| NY: | $79,557 |
Estimated per capita income in 2022: $49,724 (it was $25,036 in 2000)
Ossining village income, earnings, and wages data
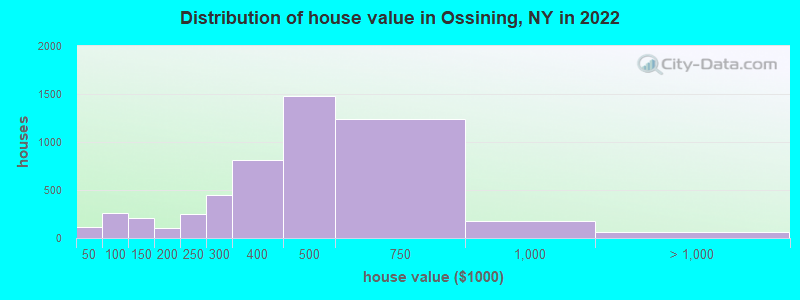
Estimated median house or condo value in 2022: $439,130 (it was $200,900 in 2000)
| Ossining: | $439,130 |
| NY: | $400,400 |
Mean prices in 2022: all housing units: $413,466; detached houses: $456,828; townhouses or other attached units: $398,002; in 2-unit structures: $525,546; in 3-to-4-unit structures: $261,118; in 5-or-more-unit structures: $298,720
Median gross rent in 2022: $1,966.
(5.0% for White Non-Hispanic residents, 15.9% for Black residents, 9.2% for Hispanic or Latino residents, 7.7% for other race residents, 1.6% for two or more races residents)
Detailed information about poverty and poor residents in Ossining, NY


Compare current foreclosures in Ossining, NY:
| Photo | Address | Area | Beds / Baths | Price | Details |
|---|---|---|---|---|---|

|
#1
Ellis Pl
Ossining, NY 10562
|
1,432 sq. feet
|
2 baths 3 beds |
show details | |

|
#2
Kitchawan Rd
Ossining, NY 10562
|
7,000 sq. feet
|
5 baths 8 beds |
show details | |

|
#3
William St
Ossining, NY 10562
|
1,160 sq. feet
|
2 baths 3 beds |
show details | |

|
#4
Maple Pl
Ossining, NY 10562
|
2,128 sq. feet
|
3 baths 5 beds |
show details | |

|
#5
Highview Rd
Ossining, NY 10562
|
3,004 sq. feet
|
2 baths 4 beds |
show details | |

|
#6
Marble Pl
Ossining, NY 10562
|
2,022 sq. feet
|
2 baths 5 beds |
show details | |

|
#7
Linden Ave
Ossining, NY 10562
|
1,589 sq. feet
|
1 baths 4 beds |
show details | |

|
#8
Ann St # B
Ossining, NY 10562
|
1,960 sq. feet
|
2 baths 4 beds |
show details | |

|
#9
Minkel Rd
Ossining, NY 10562
|
1,712 sq. feet
|
1 baths 3 beds |
show details | |

|
#10
Van Cortlandt Ave
Ossining, NY 10562
|
2,032 sq. feet
|
3 baths 4 beds |
show details |
| Photo | Address | Area | Beds / Baths | Price | Details |
|---|---|---|---|---|---|

|
#11
Illington Rd
Ossining, NY 10562
|
1,622 sq. feet
|
2 baths 3 beds |
show details | |

|
#12
Maple Pl
Ossining, NY 10562
|
2,720 sq. feet
|
4 baths 5 beds |
show details | |

|
#13
N Malcolm St
Ossining, NY 10562
|
1,984 sq. feet
|
4 baths 7 beds |
show details | |

|
#14
State St # 2
Ossining, NY 10562
|
2,732 sq. feet
|
2 baths 8 beds |
show details | |

|
#15
S Highland Ave
Ossining, NY 10562
|
- sq. feet
|
4 baths 5 beds |
show details | |

|
#16
Spring St Apt 4a
Ossining, NY 10562
|
- sq. feet
|
- baths - beds |
show details | |

|
#17
Belle Ave # 2
Ossining, NY 10562
|
- sq. feet
|
- baths - beds |
show details | |

|
#18
Main 203
Ossining, NY 10562
|
- sq. feet
|
- baths - beds |
show details | |

|
#19
Gualtiere Ln
Ossining, NY 10562
|
- sq. feet
|
- baths - beds |
show details | |

|
#20
Stone Ave
Ossining, NY 10562
|
- sq. feet
|
- baths - beds |
show details |
| Photo | Address | Area | Beds / Baths | Price | Details |
|---|---|---|---|---|---|

|
#21
John St
Ossining, NY 10562
|
- sq. feet
|
- baths - beds |
show details | |

|
#22
Thorton Hill Lane
Ossining, NY 10562
|
- sq. feet
|
- baths - beds |
show details | |

|
#23
Lakeview Rd
Ossining, NY 10562
|
- sq. feet
|
- baths - beds |
show details | |

|
#24
S Highland Ave Apt 4a
Ossining, NY 10562
|
- sq. feet
|
- baths - beds |
show details | |

|
#25
Ellis Pl
Ossining, NY 10562
|
- sq. feet
|
- baths - beds |
show details | |

|
#26
Spring Valley Rd
Ossining, NY 10562
|
- sq. feet
|
- baths - beds |
show details | |

|
#27
Main 203
Ossining, NY 10562
|
- sq. feet
|
- baths - beds |
show details | |

|
#28
Kitchawan Rd
Ossining, NY 10562
|
- sq. feet
|
- baths - beds |
show details | |

|
Check over 1 million property listings on Foreclosure.com!
|
browse all offers | |||


- 11,34642.2%Hispanic
- 10,08937.5%White alone
- 3,12011.6%Black alone
- 1,2974.8%Asian alone
- 8373.1%Two or more races
- 3891.4%Other race alone
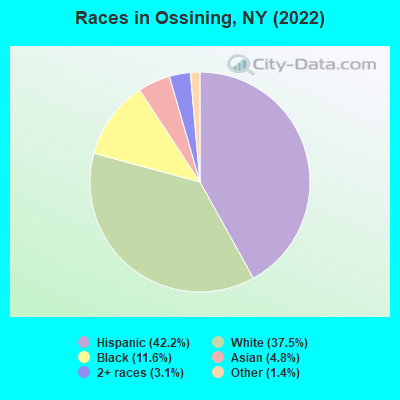
Races in Ossining detailed stats: ancestries, foreign born residents, place of birth
According to our research of New York and other state lists, there were 52 registered sex offenders living in Ossining, New York as of April 27, 2024.
The ratio of all residents to sex offenders in Ossining is 489 to 1.
Type |
2009 |
2010 |
2011 |
2012 |
2013 |
2014 |
2015 |
2016 |
2017 |
2018 |
2019 |
2020 |
2022 |
|---|---|---|---|---|---|---|---|---|---|---|---|---|---|
| Murders (per 100,000) | 0 (0.0) | 0 (0.0) | 0 (0.0) | 0 (0.0) | 0 (0.0) | 1 (3.9) | 1 (3.9) | 0 (0.0) | 0 (0.0) | 0 (0.0) | 1 (4.0) | 0 (0.0) | 0 (0.0) |
| Rapes (per 100,000) | 1 (4.2) | 0 (0.0) | 1 (4.0) | 0 (0.0) | 0 (0.0) | 1 (3.9) | 1 (3.9) | 1 (3.9) | 1 (3.9) | 0 (0.0) | 1 (4.0) | 0 (0.0) | 0 (0.0) |
| Robberies (per 100,000) | 15 (63.1) | 20 (79.8) | 25 (99.3) | 18 (71.0) | 21 (83.0) | 28 (110.0) | 17 (66.9) | 6 (23.5) | 5 (19.7) | 7 (27.5) | 4 (16.0) | 7 (28.2) | 5 (18.5) |
| Assaults (per 100,000) | 17 (71.5) | 19 (75.8) | 18 (71.5) | 23 (90.7) | 15 (59.3) | 25 (98.2) | 18 (70.8) | 10 (39.2) | 14 (55.1) | 8 (31.4) | 14 (56.0) | 10 (40.3) | 13 (48.2) |
| Burglaries (per 100,000) | 77 (323.9) | 54 (215.5) | 42 (166.8) | 74 (291.7) | 46 (181.7) | 47 (184.6) | 27 (106.2) | 32 (125.4) | 20 (78.7) | 12 (47.1) | 13 (52.0) | 14 (56.5) | 9 (33.4) |
| Thefts (per 100,000) | 194 (816.1) | 191 (762.2) | 181 (719.0) | 227 (894.9) | 192 (758.5) | 156 (612.8) | 165 (648.9) | 117 (458.5) | 218 (858.0) | 171 (671.9) | 141 (564.2) | 176 (710.1) | 171 (633.8) |
| Auto thefts (per 100,000) | 14 (58.9) | 3 (12.0) | 11 (43.7) | 13 (51.2) | 5 (19.8) | 8 (31.4) | 11 (43.3) | 6 (23.5) | 7 (27.5) | 5 (19.6) | 3 (12.0) | 6 (24.2) | 3 (11.1) |
| Arson (per 100,000) | 1 (4.2) | 1 (4.0) | 0 (0.0) | 2 (7.9) | 0 (0.0) | 1 (3.9) | 0 (0.0) | 0 (0.0) | 3 (11.8) | 0 (0.0) | 0 (0.0) | 1 (4.0) | 0 (0.0) |
| City-Data.com crime index | 96.6 | 85.6 | 91.2 | 99.7 | 81.4 | 103.6 | 82.1 | 47.0 | 62.1 | 46.3 | 54.4 | 50.8 | 43.8 |
The City-Data.com crime index weighs serious crimes and violent crimes more heavily. Higher means more crime, U.S. average is 246.1. It adjusts for the number of visitors and daily workers commuting into cities.
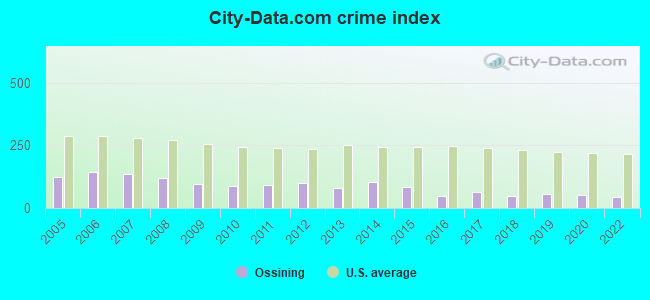
Crime rate in Ossining detailed stats: murders, rapes, robberies, assaults, burglaries, thefts, arson
Full-time law enforcement employees in 2021, including police officers: 63 (57 officers - 53 male; 4 female).
| Officers per 1,000 residents here: | 2.32 |
| New York average: | 3.28 |
 Recent articles from our blog. Our writers, many of them Ph.D. graduates or candidates, create easy-to-read articles on a wide variety of topics.


 | Why is Ossining so cheap? (46 replies) |
| Girls flag football officially comes to New York State (249 replies) |
| Ossining Feedback (4 replies) |
| Experiences with Ossining schools? (3 replies) |
| Areas of Westchester where you don't need a car (16 replies) |
| Ossining - Old Street Theater Location (0 replies) |
Latest news from Ossining, NY collected exclusively by city-data.com from local newspapers, TV, and radio stations
Ancestries: Italian (9.1%), Irish (3.6%), American (3.2%), European (3.2%), Jamaican (3.0%), German (1.8%).
Current Local Time: EST time zone
Incorporated on 04/02/1813
Elevation: 160 feet
Land area: 3.22 square miles.
Population density: 8,280 people per square mile (high).
8,851 residents are foreign born (23.7% Latin America, 5.2% Europe, 3.6% Asia).
| This village: | 32.9% |
| New York: | 22.6% |
Median real estate property taxes paid for housing units with mortgages in 2022: $10,001 (2.2%)
Median real estate property taxes paid for housing units with no mortgage in 2022: $10,001 (2.4%)
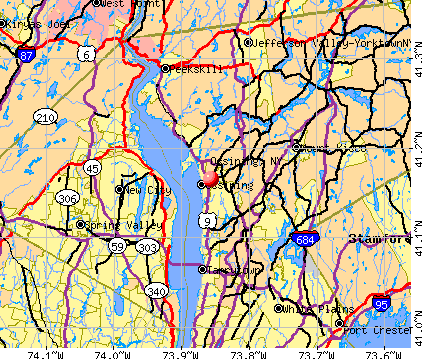
Nearest city with pop. 50,000+: Clarkstown, NY  (7.0 miles , pop. 82,082).
Nearest city with pop. 200,000+: Bronx, NY (22.0 miles , pop. 1,332,650).
Nearest cities:
), ), ), ), Latitude: 41.17 N, Longitude: 73.86 W
Daytime population change due to commuting: -5,631 (-21.0%)
Workers who live and work in this village: 3,596 (26.2%)
Area code: 914

Ossining, New York accommodation & food services, waste management - Economy and Business Data
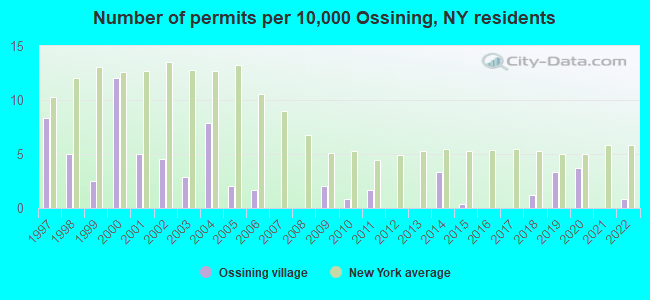
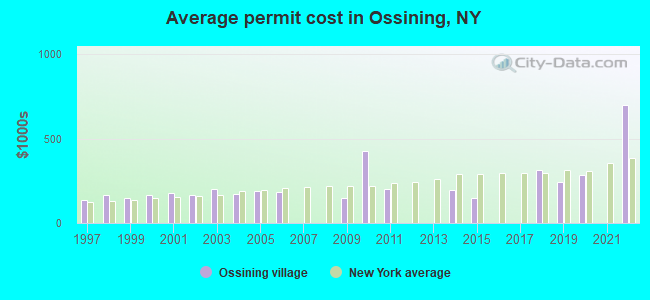
Single-family new house construction building permits:
- 2022: 2 buildings, average cost: $700,000
- 2020: 9 buildings, average cost: $282,800
- 2019: 8 buildings, average cost: $246,100
- 2018: 3 buildings, average cost: $316,700
- 2015: 1 building, cost: $150,000
- 2014: 8 buildings, average cost: $192,500
- 2011: 4 buildings, average cost: $200,000
- 2010: 2 buildings, average cost: $425,000
- 2009: 5 buildings, average cost: $150,000
- 2006: 4 buildings, average cost: $181,300
- 2005: 5 buildings, average cost: $188,000
- 2004: 19 buildings, average cost: $174,500
- 2003: 7 buildings, average cost: $200,000
- 2002: 11 buildings, average cost: $165,900
- 2001: 12 buildings, average cost: $175,600
- 2000: 29 buildings, average cost: $165,100
- 1999: 6 buildings, average cost: $148,000
- 1998: 12 buildings, average cost: $164,300
- 1997: 20 buildings, average cost: $138,400
| Here: | 3.2% |
| New York: | 4.4% |
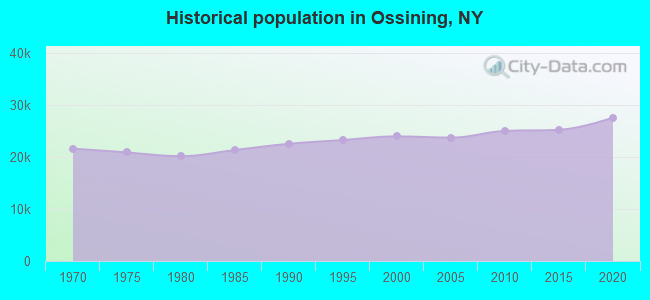
Population change in the 1990s: +1,954 (+8.9%).
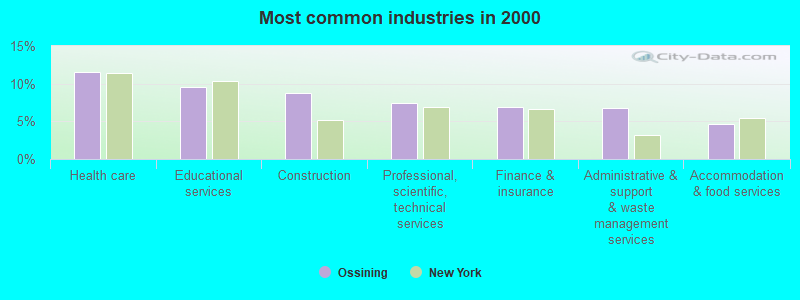
- Health care (11.5%)
- Educational services (9.5%)
- Construction (8.7%)
- Professional, scientific, technical services (7.4%)
- Finance & insurance (6.9%)
- Administrative & support & waste management services (6.8%)
- Accommodation & food services (4.7%)
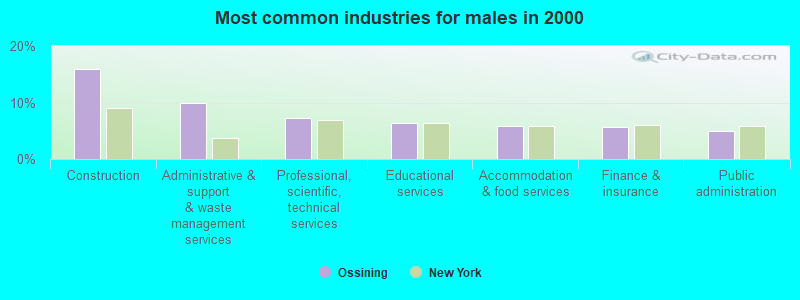
- Construction (16.0%)
- Administrative & support & waste management services (10.0%)
- Professional, scientific, technical services (7.2%)
- Educational services (6.4%)
- Accommodation & food services (5.9%)
- Finance & insurance (5.6%)
- Public administration (5.0%)
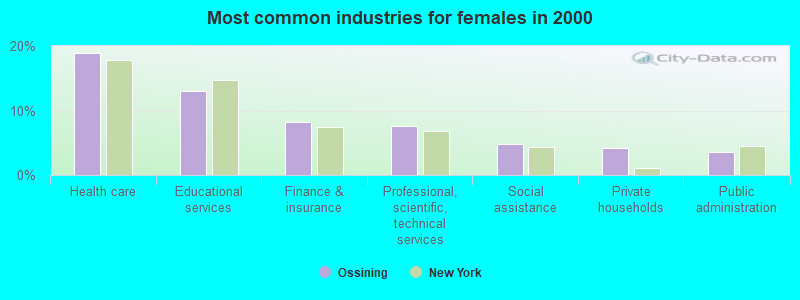
- Health care (18.9%)
- Educational services (13.0%)
- Finance & insurance (8.3%)
- Professional, scientific, technical services (7.7%)
- Social assistance (4.8%)
- Private households (4.2%)
- Public administration (3.6%)
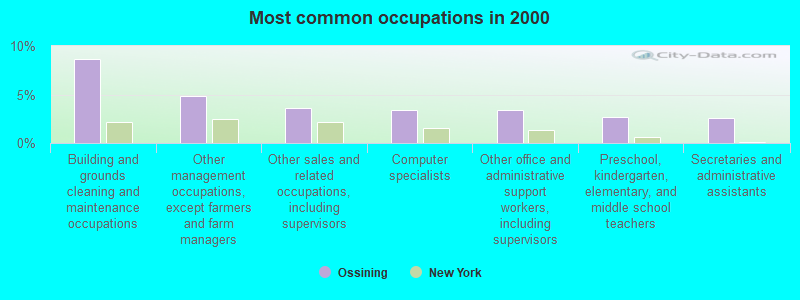
- Building and grounds cleaning and maintenance occupations (8.7%)
- Other management occupations, except farmers and farm managers (4.8%)
- Other sales and related occupations, including supervisors (3.6%)
- Computer specialists (3.4%)
- Other office and administrative support workers, including supervisors (3.4%)
- Preschool, kindergarten, elementary, and middle school teachers (2.7%)
- Secretaries and administrative assistants (2.6%)
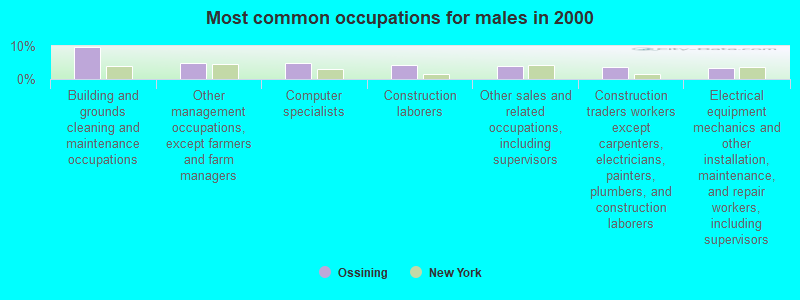
- Building and grounds cleaning and maintenance occupations (9.8%)
- Other management occupations, except farmers and farm managers (4.9%)
- Computer specialists (4.9%)
- Construction laborers (4.3%)
- Other sales and related occupations, including supervisors (4.0%)
- Construction traders workers except carpenters, electricians, painters, plumbers, and construction laborers (3.5%)
- Electrical equipment mechanics and other installation, maintenance, and repair workers, including supervisors (3.4%)
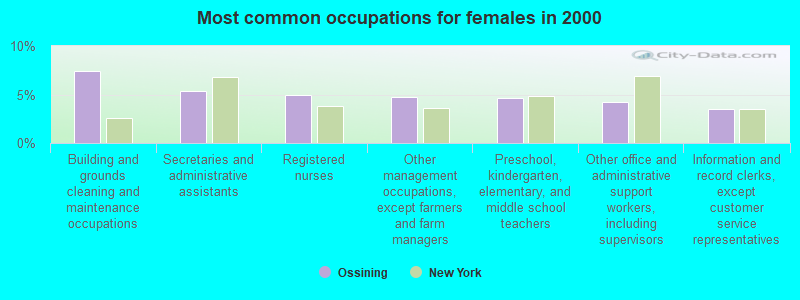
- Building and grounds cleaning and maintenance occupations (7.5%)
- Secretaries and administrative assistants (5.4%)
- Registered nurses (5.0%)
- Other management occupations, except farmers and farm managers (4.7%)
- Preschool, kindergarten, elementary, and middle school teachers (4.7%)
- Other office and administrative support workers, including supervisors (4.2%)
- Information and record clerks, except customer service representatives (3.5%)
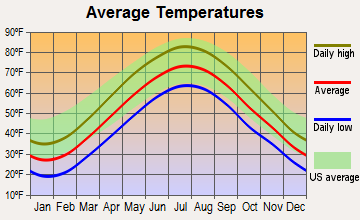
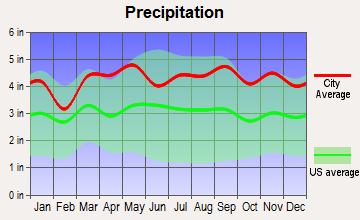
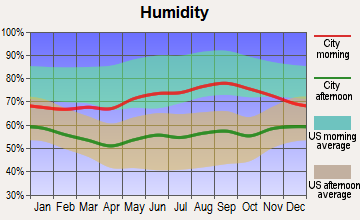
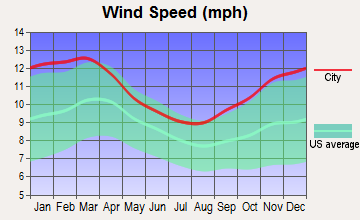
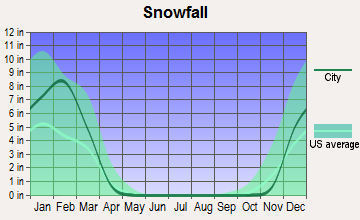
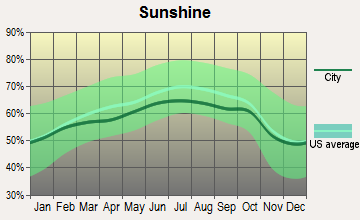
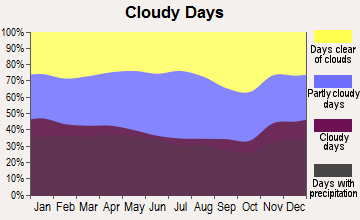
Average climate in Ossining, New York
Based on data reported by over 4,000 weather stations
|
|

(lower is better)
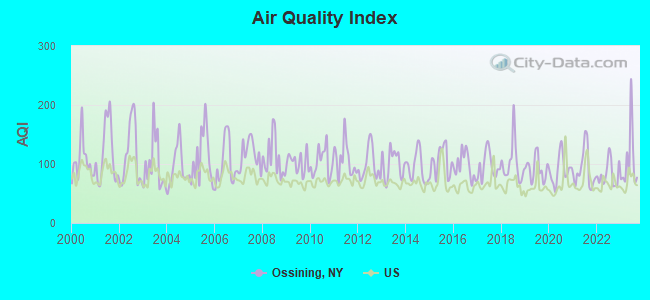
Air Quality Index (AQI) level in 2023 was 104. This is significantly worse than average.
| City: | 104 |
| U.S.: | 73 |
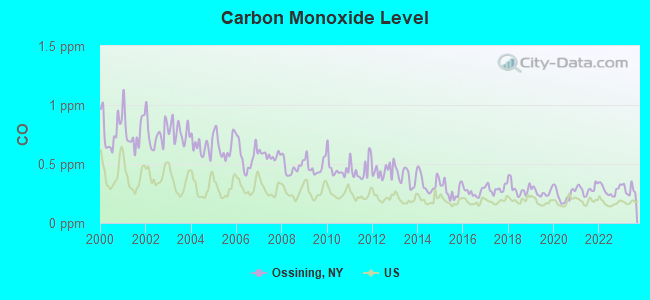
Carbon Monoxide (CO) [ppm] level in 2023 was 0.284. This is about average. Closest monitor was 15.6 miles away from the city center.
| City: | 0.284 |
| U.S.: | 0.251 |
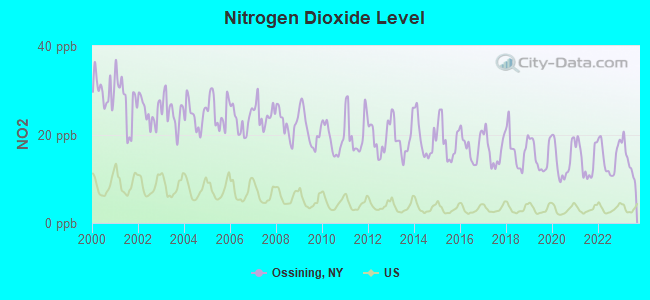
Nitrogen Dioxide (NO2) [ppb] level in 2023 was 14.2. This is significantly worse than average. Closest monitor was 9.2 miles away from the city center.
| City: | 14.2 |
| U.S.: | 5.1 |
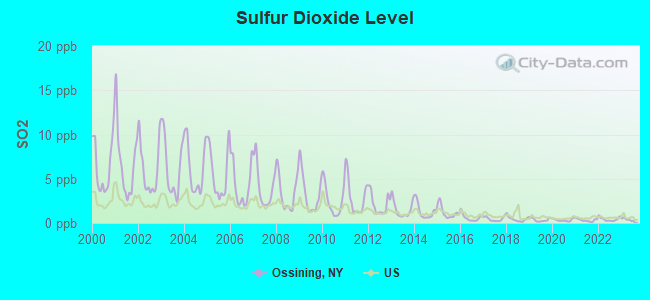
Sulfur Dioxide (SO2) [ppb] level in 2023 was 0.397. This is significantly better than average. Closest monitor was 5.4 miles away from the city center.
| City: | 0.397 |
| U.S.: | 1.515 |
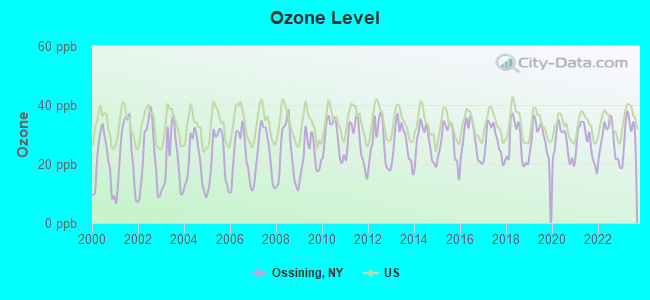
Ozone [ppb] level in 2023 was 30.6. This is about average. Closest monitor was 9.0 miles away from the city center.
| City: | 30.6 |
| U.S.: | 33.3 |
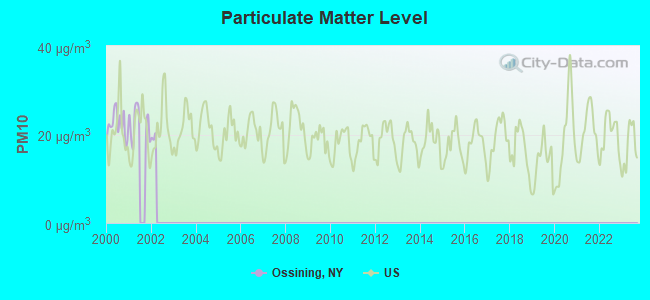
Particulate Matter (PM10) [µg/m3] level in 2001 was 22.6. This is about average. Closest monitor was 0.4 miles away from the city center.
| City: | 22.6 |
| U.S.: | 19.2 |
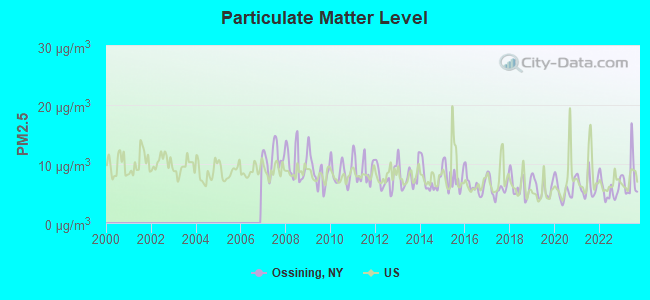
Particulate Matter (PM2.5) [µg/m3] level in 2023 was 7.62. This is about average. Closest monitor was 16.8 miles away from the city center.
| City: | 7.62 |
| U.S.: | 8.11 |
Tornado activity:
Ossining-area historical tornado activity is above New York state average. It is 36% smaller than the overall U.S. average.
On 7/10/1989, a category F4 (max. wind speeds 207-260 mph) tornado 49.9 miles away from the Ossining village center injured 40 people and caused between $50,000,000 and $500,000,000 in damages.
On 7/14/1988, a category F3 (max. wind speeds 158-206 mph) tornado 33.9 miles away from the village center injured one person and caused between $500,000 and $5,000,000 in damages.
Earthquake activity:
Ossining-area historical earthquake activity is significantly above New York state average. It is 69% smaller than the overall U.S. average.On 10/7/1983 at 10:18:46, a magnitude 5.3 (5.1 MB, 5.3 LG, 5.1 ML, Class: Moderate, Intensity: VI - VII) earthquake occurred 194.4 miles away from Ossining center
On 8/23/2011 at 17:51:04, a magnitude 5.8 (5.8 MW, Depth: 3.7 mi) earthquake occurred 313.1 miles away from the city center
On 4/20/2002 at 10:50:47, a magnitude 5.3 (5.3 ML, Depth: 3.0 mi) earthquake occurred 231.7 miles away from the city center
On 4/20/2002 at 10:50:47, a magnitude 5.2 (5.2 MB, 4.2 MS, 5.2 MW, 5.0 MW) earthquake occurred 229.9 miles away from the city center
On 1/16/1994 at 01:49:16, a magnitude 4.6 (4.6 MB, 4.6 LG, Depth: 3.1 mi, Class: Light, Intensity: IV - V) earthquake occurred 128.0 miles away from Ossining center
On 1/19/1982 at 00:14:42, a magnitude 4.7 (4.5 MB, 4.7 MD, 4.5 LG) earthquake occurred 198.5 miles away from the city center
Magnitude types: regional Lg-wave magnitude (LG), body-wave magnitude (MB), duration magnitude (MD), local magnitude (ML), surface-wave magnitude (MS), moment magnitude (MW)
Natural disasters:
The number of natural disasters in Westchester County (26) is a lot greater than the US average (15).Major Disasters (Presidential) Declared: 17
Emergencies Declared: 8
Causes of natural disasters: Floods: 9, Storms: 9, Hurricanes: 7, Blizzards: 2, Heavy Rains: 2, Tropical Storms: 2, Landslide: 1, Power Outage: 1, Snowstorm: 1, Water Shortage: 1, Other: 3 (Note: some incidents may be assigned to more than one category).

Hospitals and medical centers in Ossining:
- STONEY LODGE HOSPITAL (40 CROTON DAM ROAD)
- BETHEL LONG TERM HOME HEALTH CARE (19 NARRAGANSETT AVE)
- DOMINICAN SISTERS FAMILY HEALTH SERVICES CHHA (299 NORTH HIGHLAND AVENUE)
- BETHEL NURSING HOME CO INC (17 NARRAGANSETT AVENUE)
- CEDAR MANOR NURSING AND REHABILITATION CENTER (CEDAR LANE, PO BOX 928)
- CHANDLER CARE CENTER (31 OVERTON ROAD)
- SUNSHINE CHILDREN'S HOME AND REHAB CENTER (15 SPRING VALLEY ROAD)
- VICTORIA HOME (25 N MALCOLM STREET)
Heliports located in Ossining:
See details about Heliports located in Ossining, NYAmtrak stations near Ossining:
- 3 miles: CROTON-HARMON (CROTON-ON-HUDSON, CROTON POINT AVE.) . Services: partially wheelchair accessible, enclosed waiting area, public restrooms, public payphones, snack bar, paid short-term parking, paid long-term parking, call for car rental service, call for taxi service, public transit connection.
- 17 miles: YONKERS (FOOT OF DOCK ST. & WELLS AVE.) . Services: fully wheelchair accessible, enclosed waiting area, public restrooms, public payphones, snack bar, paid short-term parking, paid long-term parking, call for car rental service, taxi stand, public transit connection.
- 18 miles: NEW ROCHELLE (DEPOT PLAZA NORTH) . Services: enclosed waiting area, public restrooms, public payphones, paid short-term parking, paid long-term parking, call for car rental service, taxi stand, public transit connection.
Operable nuclear power plants near Ossining:
- 8 miles: Indian Point 2 and 3 in Buchanan, NY.
College/University in Ossining:
Colleges/universities with over 2000 students nearest to Ossining:
- Nyack College (about 7 miles; Nyack, NY; Full-time enrollment: 2,590)
- SUNY Westchester Community College (about 8 miles; Valhalla, NY; FT enrollment: 10,278)
- Mercy College (about 10 miles; Dobbs Ferry, NY; FT enrollment: 8,602)
- SUNY at Purchase College (about 12 miles; Purchase, NY; FT enrollment: 4,415)
- Manhattanville College (about 12 miles; Purchase, NY; FT enrollment: 2,299)
- Rockland Community College (about 13 miles; Suffern, NY; FT enrollment: 6,026)
- United States Military Academy (about 17 miles; West Point, NY; FT enrollment: 5,651)
Public high schools in Ossining:
- OSSINING HIGH SCHOOL (Students: 1,366, Location: 29 S HIGHLAND AVE, Grades: 9-12)
- ANNE M DORNER MIDDLE SCHOOL (Students: 861, Location: VAN CORTLANDT AVE, Grades: 6-9)
Private high school in Ossining:
- CARDINAL MCCLOSKEY SCHOOL (Students: 6, Location: 155 N HIGHLAND AVE, Grades: 8-11)
Public elementary/middle schools in Ossining:
- BROOKSIDE SCHOOL (Students: 717, Location: PINESBRIDGE RD, Grades: 1-2)
- CLAREMONT SCHOOL (Students: 621, Location: CLAREMONT RD, Grades: 3-5)
- ROOSEVELT SCHOOL (Students: 264, Location: 190 CROTON AVE, Grades: 5)
Private elementary/middle school in Ossining:
Library in Ossining:
- OSSINING PUBLIC LIBRARY (Operating income: $3,179,426; Location: 53 CROTON AVENUE; 110,559 books; 767 e-books; 12,015 audio materials; 12,016 video materials; 1 local licensed databases; 14 state licensed databases; 10 other licensed databases; 326 print serial subscriptions; 1 electronic serial subscriptions)
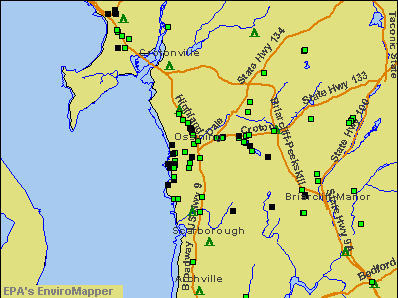
Points of interest:
Notable locations in Ossining: Park Professional Center (A), Hubbles Corner (B), Roosevelt Square (C), Washington Square (D), Ossining Wastewater Treatment Plant (E), Ossining Station (F), Ossining Fire Department Independent Hose Company 6 (G), Ossining Fire Department (H), Ossining Public Library (I), Grace Hall (J), Ossining Municipal Building (K), Ossining Recreation Center (L), Ossining's Children Center (M), Ossining Fire Department Senate Hook and Ladder Company 2 (N), Ossining Fire Department Steamer Company 1 (O), Ossining Fire Department Washington Hook and Ladder Company 2 (P), Ossining Fire Department Ossining Hose Company 1 (Q), Bethel Nursing and Rehabilitation Center Ossining (R), Maple House Adult Care Facility (S), Victoria Home Nursing Home (T). Display/hide their locations on the map
Shopping Center: Arcadian Gardens Shopping Center (1). Display/hide its location on the map
Churches in Ossining include: Saint Ann's Catholic Church (A), Ossining Gospel Assembly Church (B), First Presbyterian Church (C), First Baptist Church (D), Calvary Baptist Church (E), Ossining United Methodist Church (F), Saint Augustines Roman Catholic Church (G), Trinity Episcopal Church (H), Star of Bethlehem Baptist Church (I). Display/hide their locations on the map
Cemetery: Dale Cemetery (1). Display/hide its location on the map
Lakes and reservoirs: Kemeys Cove (A), Ossining Reservoir (B). Display/hide their locations on the map
Streams, rivers, and creeks: Sparta Brook (A), Sing Sing Brook (B). Display/hide their locations on the map
Parks in Ossining include: Depot Square (1), Merchants Square (2), Pleasant Square (3), Tommy Thurber Preserve (4), Snowden Avenue Park (5), Nelson Park (6), Veterans Memorial Park (7). Display/hide their locations on the map
Birthplace of: Ruth Underhill - Anthropologist, Kevin Steuerer - College basketball player (Princeton Tigers), Red Hoff - Baseball player.
Drinking water stations with addresses in Ossining and their reported violations in the past:
KINGDOM HALL OF JEHOVAHS WIT (Address: 724 KITCHAWAN ROAD , Population served: 125, Groundwater):Past health violations:Past monitoring violations:
- MCL, Monthly (TCR) - In SEP-2010, Contaminant: Coliform. Follow-up actions: St Public Notif requested (OCT-01-2010), St Formal NOV issued (OCT-01-2010), St Public Notif received (DEC-01-2010), St Compliance achieved (DEC-01-2010)
- 5 routine major monitoring violations
| This village: | 2.8 people |
| New York: | 2.6 people |
| This village: | 66.7% |
| Whole state: | 63.5% |
| This village: | 7.2% |
| Whole state: | 6.8% |
Likely homosexual households (counted as self-reported same-sex unmarried-partner households)
- Lesbian couples: 0.6% of all households
- Gay men: 0.6% of all households
People in group quarters in Ossining in 2010:
- 1,717 people in state prisons
- 102 people in nursing facilities/skilled-nursing facilities
- 19 people in other noninstitutional facilities
- 11 people in group homes for juveniles (non-correctional)
- 9 people in group homes intended for adults
People in group quarters in Ossining in 2000:
- 2,279 people in local jails and other confinement facilities (including police lockups)
- 209 people in nursing homes
- 41 people in other noninstitutional group quarters
- 15 people in homes for the mentally retarded
- 13 people in religious group quarters
- 2 people in other nonhousehold living situations
Banks with most branches in Ossining (2011 data):
- Emigrant Bank: Dollar Savings Direct Branch, Emigrantdirect.Com Branch, Ossining Branch. Info updated 2010/12/22: Bank assets: $7,965.6 mil, Deposits: $6,007.7 mil, headquarters in New York, NY, positive income, Commercial Lending Specialization, 4 total offices, Holding Company: New York Private Bank & Trust Corporation
- JPMorgan Chase Bank, National Association: Ossining Branch at 21 Spring Street, branch established on 1946/01/18; Arcadian Shopping Center at 214 S Highland Avenue, branch established on 2004/01/26. Info updated 2011/11/10: Bank assets: $1,811,678.0 mil, Deposits: $1,190,738.0 mil, headquarters in Columbus, OH, positive income, International Specialization, 5577 total offices, Holding Company: Jpmorgan Chase & Co.
- RBS Citizens, National Association: Ossining S&S Branch at 246 South Highland Avenue, branch established on 2008/11/14. Info updated 2007/09/19: Bank assets: $106,940.6 mil, Deposits: $75,690.2 mil, headquarters in Providence, RI, positive income, 1135 total offices, Holding Company: Uk Financial Investments Limited
- TD Bank, National Association: Ossining Branch at 174 South Highland Avenue, branch established on 2009/04/25. Info updated 2010/10/04: Bank assets: $188,912.6 mil, Deposits: $153,149.8 mil, headquarters in Wilmington, DE, positive income, 1314 total offices, Holding Company: Toronto-Dominion Bank, The
- The Mahopac National Bank: Ossining Branch at 2 Church Street, branch established on 1997/12/01. Info updated 2010/12/14: Bank assets: $881.7 mil, Deposits: $684.4 mil, headquarters in Brewster, NY, positive income, Commercial Lending Specialization, 15 total offices, Holding Company: Tompkins Financial Corporation
- HSBC Bank USA, National Association: Ossining Branch at 170 South Highland Avenue, branch established on 1971/04/26. Info updated 2010/11/30: Bank assets: $206,009.7 mil, Deposits: $149,026.8 mil, headquarters in Mc Lean, VA, positive income, 474 total offices, Holding Company: Hsbc Holdings Plc
- Manufacturers and Traders Trust Company: Ossining Greenpoint Branch at 246 J South Highland Avenue, branch established on 1974/02/27. Info updated 2011/08/08: Bank assets: $76,887.1 mil, Deposits: $60,064.2 mil, headquarters in Buffalo, NY, positive income, Commercial Lending Specialization, 808 total offices, Holding Company: M&T Bank Corporation
- Citibank, National Association: Ossining Branch at 22 Pleasantville Road, branch established on 1990/10/15. Info updated 2012/01/10: Bank assets: $1,288,658.0 mil, Deposits: $882,541.0 mil, headquarters in Sioux Falls, SD, positive income, International Specialization, 1048 total offices, Holding Company: Citigroup Inc.
- KeyBank National Association: Ossining Branch at 88 Croton Avenue, branch established on 1995/01/05. Info updated 2008/03/03: Bank assets: $86,198.8 mil, Deposits: $64,214.8 mil, headquarters in Cleveland, OH, positive income, Commercial Lending Specialization, 1067 total offices, Holding Company: Keycorp
For population 15 years and over in Ossining:
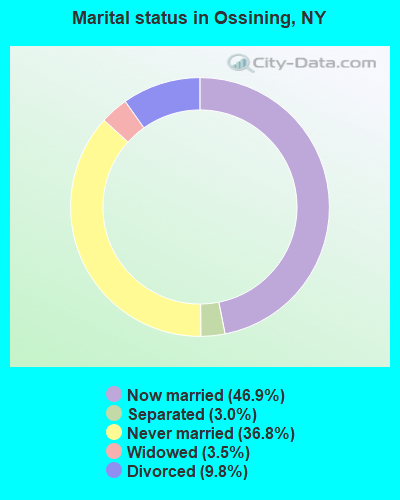
- Never married: 36.8%
- Now married: 46.9%
- Separated: 3.0%
- Widowed: 3.5%
- Divorced: 9.8%
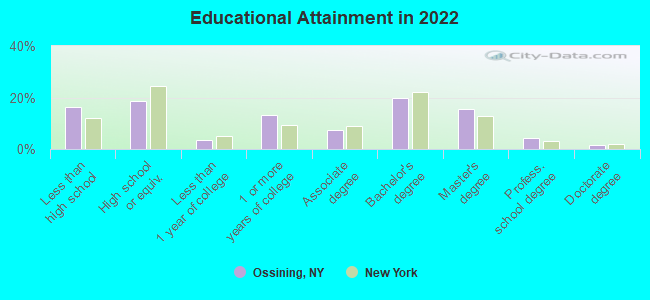
For population 25 years and over in Ossining:
- High school or higher: 84.0%
- Bachelor's degree or higher: 40.5%
- Graduate or professional degree: 21.6%
- Unemployed: 3.4%
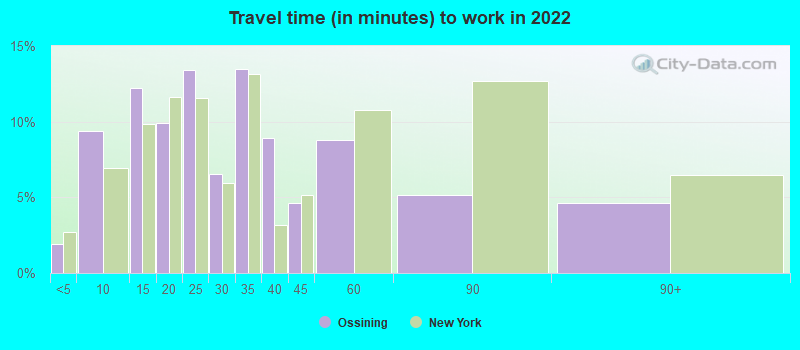
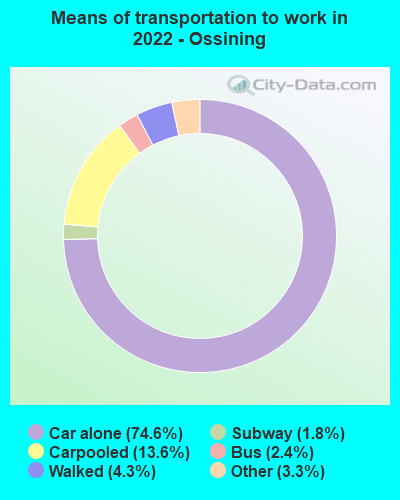
- Mean travel time to work (commute): 30.3 minutes
| Here: | 16.8 |
| New York average: | 13.9 |
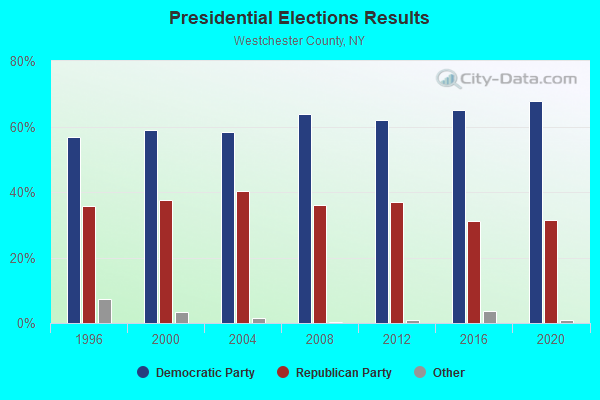
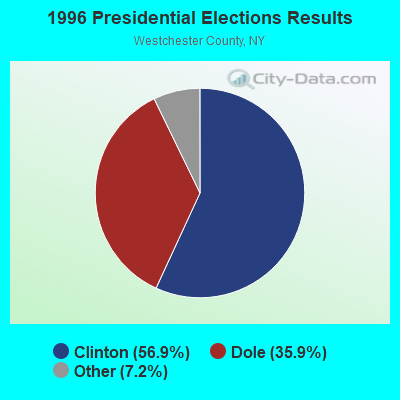
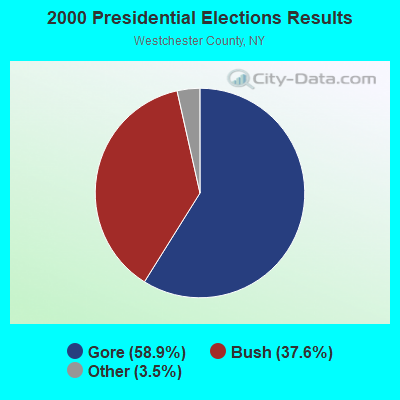
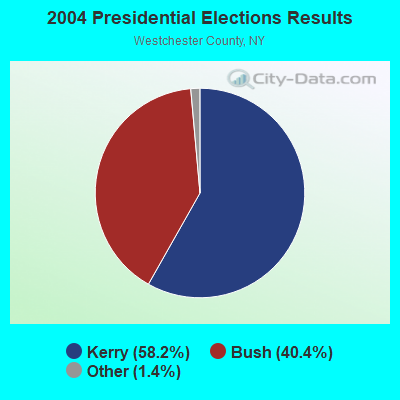
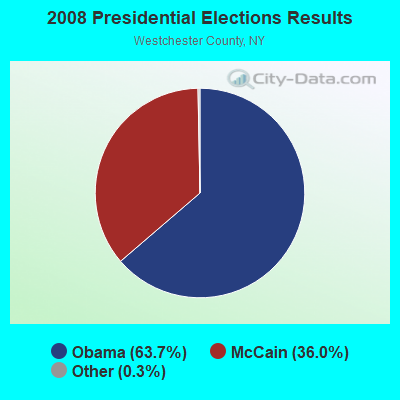
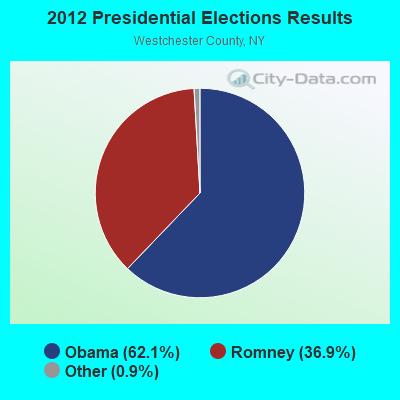
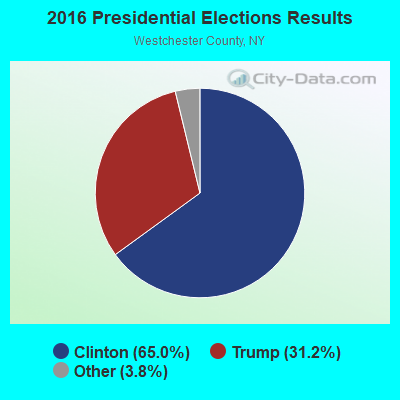
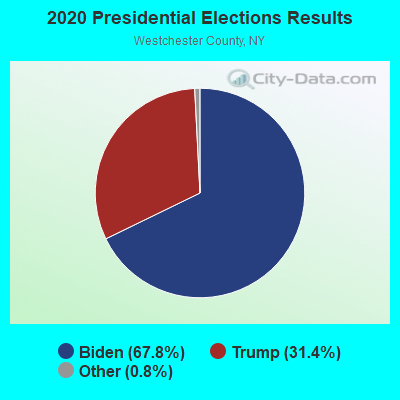
Graphs represent county-level data. Detailed 2008 Election Results
Religion statistics for Ossining, NY (based on Westchester County data)
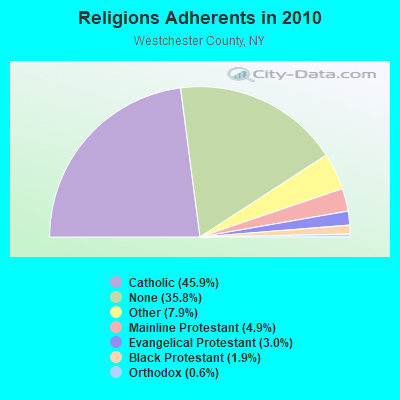
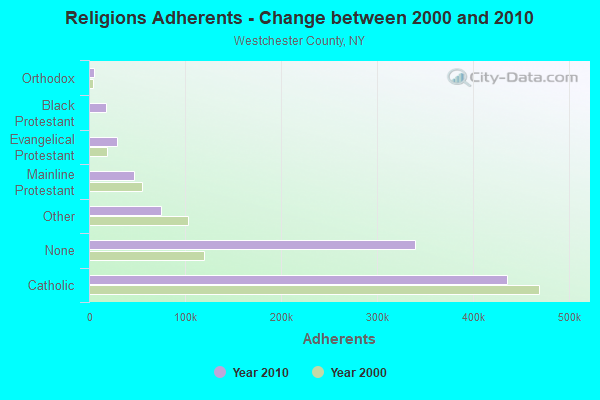
| Religion | Adherents | Congregations |
|---|---|---|
| Catholic | 435,590 | 100 |
| Other | 75,029 | 114 |
| Mainline Protestant | 46,854 | 176 |
| Evangelical Protestant | 28,915 | 209 |
| Black Protestant | 17,814 | 38 |
| Orthodox | 5,458 | 16 |
| None | 339,453 | - |
Food Environment Statistics:
| Westchester County: | 4.39 / 10,000 pop. |
| State: | 4.13 / 10,000 pop. |
| Westchester County: | 0.05 / 10,000 pop. |
| State: | 0.06 / 10,000 pop. |
| Here: | 0.75 / 10,000 pop. |
| New York: | 0.92 / 10,000 pop. |
| Here: | 1.17 / 10,000 pop. |
| New York: | 1.68 / 10,000 pop. |
| Westchester County: | 9.52 / 10,000 pop. |
| New York: | 8.82 / 10,000 pop. |
| Westchester County: | 7.6% |
| New York: | 8.2% |
| Westchester County: | 19.1% |
| New York: | 23.8% |
| Here: | 17.8% |
| New York: | 15.6% |
Health and Nutrition:
| Here: | 48.6% |
| New York: | 50.1% |
| This city: | 47.3% |
| New York: | 48.1% |
| Ossining: | 28.4 |
| New York: | 28.5 |
| Ossining: | 19.5% |
| New York: | 20.3% |
| Ossining: | 9.8% |
| New York: | 11.1% |
| Ossining: | 6.7 |
| New York: | 6.8 |
| Ossining: | 32.0% |
| New York: | 33.4% |
| Ossining: | 56.7% |
| New York: | 56.5% |
| This city: | 81.4% |
| New York: | 80.2% |
More about Health and Nutrition of Ossining, NY Residents
| Local government employment and payroll (March 2022) | |||||
| Function | Full-time employees | Monthly full-time payroll | Average yearly full-time wage | Part-time employees | Monthly part-time payroll |
|---|---|---|---|---|---|
| Police Protection - Officers | 55 | $654,831 | $142,872 | 0 | $0 |
| Streets and Highways | 25 | $224,170 | $107,602 | 0 | $0 |
| Parks and Recreation | 17 | $119,419 | $84,296 | 40 | $37,942 |
| Water Supply | 14 | $139,565 | $119,627 | 0 | $0 |
| Solid Waste Management | 14 | $89,929 | $77,082 | 0 | $0 |
| Financial Administration | 9 | $75,616 | $100,821 | 0 | $0 |
| Other and Unallocable | 8 | $63,989 | $95,984 | 4 | $5,713 |
| Police - Other | 7 | $43,329 | $74,278 | 7 | $9,718 |
| Other Government Administration | 4 | $43,823 | $131,469 | 5 | $5,248 |
| Judicial and Legal | 3 | $23,542 | $94,168 | 0 | $0 |
| Housing and Community Development (Local) | 2 | $19,130 | $114,780 | 0 | $0 |
| Sewerage | 2 | $13,844 | $83,064 | 0 | $0 |
| Welfare | 2 | $14,560 | $87,360 | 1 | $2,169 |
| Firefighters | 0 | $0 | 4 | $5,100 | |
| Totals for Government | 162 | $1,525,748 | $113,018 | 61 | $65,890 |
Ossining government finances - Expenditure in 2021 (per resident):
- Assistance and Subsidies - Public Welfare, Cash Assistance Programs - Other: $3,487,000 ($130.93)
- Construction - Regular Highways: $813,000 ($30.53)
Water Utilities: $794,000 ($29.81)
Local Fire Protection: $702,000 ($26.36)
Police Protection: $432,000 ($16.22)
General - Other: $388,000 ($14.57)
Solid Waste Management: $253,000 ($9.50)
Parks and Recreation: $180,000 ($6.76)
General Public Buildings: $36,000 ($1.35)
- Current Operations - General - Other: $14,553,000 ($546.43)
Police Protection: $9,893,000 ($371.46)
Water Utilities: $7,688,000 ($288.66)
Parks and Recreation: $2,292,000 ($86.06)
Regular Highways: $2,025,000 ($76.03)
Solid Waste Management: $1,511,000 ($56.73)
Sewerage: $1,265,000 ($47.50)
Central Staff Services: $1,213,000 ($45.55)
Local Fire Protection: $689,000 ($25.87)
Protective Inspection and Regulation - Other: $683,000 ($25.64)
Judicial and Legal Services: $493,000 ($18.51)
General Public Buildings: $384,000 ($14.42)
Financial Administration: $223,000 ($8.37)
Housing and Community Development: $182,000 ($6.83)
Health - Other: $125,000 ($4.69)
Parking Facilities: $40,000 ($1.50)
- General - Interest on Debt: $1,690,000 ($63.46)
- Intergovernmental to Local - Other - Financial Administration: $255,000 ($9.57)
- Other Capital Outlay - Local Fire Protection: $134,000 ($5.03)
Water Utilities: $83,000 ($3.12)
General - Other: $35,000 ($1.31)
Police Protection: $25,000 ($0.94)
Parks and Recreation: $19,000 ($0.71)
Regular Highways: $16,000 ($0.60)
Protective Inspection and Regulation - Other: $10,000 ($0.38)
Central Staff Services: $6,000 ($0.23)
Solid Waste Management: $4,000 ($0.15)
Judicial and Legal Services: $2,000 ($0.08)
General Public Building: $2,000 ($0.08)
- Total Salaries and Wages: $20,169,000 ($757.29)
- Water Utilities - Interest on Debt: $57,000 ($2.14)
Ossining government finances - Revenue in 2021 (per resident):
- Charges - Sewerage: $1,736,000 ($65.18)
Parking Facilities: $496,000 ($18.62)
Solid Waste Management: $362,000 ($13.59)
Other: $306,000 ($11.49)
Parks and Recreation: $275,000 ($10.33)
- Federal Intergovernmental - Housing and Community Development: $3,688,000 ($138.47)
Other: $3,000 ($0.11)
- Local Intergovernmental - General Local Government Support: $5,195,000 ($195.06)
Other: $3,762,000 ($141.25)
Sewerage: $167,000 ($6.27)
Highways: $26,000 ($0.98)
- Miscellaneous - General Revenue - Other: $2,170,000 ($81.48)
Rents: $713,000 ($26.77)
Fines and Forfeits: $334,000 ($12.54)
Interest Earnings: $228,000 ($8.56)
Donations From Private Sources: $2,000 ($0.08)
- Revenue - Water Utilities: $11,626,000 ($436.53)
- State Intergovernmental - Highways: $236,000 ($8.86)
Other: $206,000 ($7.73)
- Tax - Property: $22,995,000 ($863.40)
Public Utilities Sales: $772,000 ($28.99)
Other License: $657,000 ($24.67)
Occupation and Business License - Other: $32,000 ($1.20)
Other: $8,000 ($0.30)
Ossining government finances - Debt in 2021 (per resident):
- Long Term Debt - Beginning Outstanding - Unspecified Public Purpose: $27,490,000 ($1032.18)
Outstanding Unspecified Public Purpose: $24,650,000 ($925.54)
Retired Unspecified Public Purpose: $2,840,000 ($106.63)
- Short Term Debt Outstanding - End of Fiscal Year: $7,107,000 ($266.85)
Beginning: $4,931,000 ($185.15)
Ossining government finances - Cash and Securities in 2021 (per resident):
- Bond Funds - Cash and Securities: $7,201,000 ($270.38)
- Other Funds - Cash and Securities: $30,611,000 ($1149.36)
- Sinking Funds - Cash and Securities: $406,000 ($15.24)
5.69% of this county's 2021 resident taxpayers lived in other counties in 2020 ($147,956 average adjusted gross income)
| Here: | 5.69% |
| New York average: | 5.29% |
0.02% of residents moved from foreign countries ($25 average AGI)
Westchester County: 0.02% New York average: 0.01%
Top counties from which taxpayers relocated into this county between 2020 and 2021:
| from Bronx County, NY | |
| from New York County, NY | |
| from Queens County, NY |
6.51% of this county's 2020 resident taxpayers moved to other counties in 2021 ($174,362 average adjusted gross income)
| Here: | 6.51% |
| New York average: | 6.93% |
0.01% of residents moved to foreign countries ($44 average AGI)
Westchester County: 0.01% New York average: 0.02%
Top counties to which taxpayers relocated from this county between 2020 and 2021:
| to Fairfield County, CT | |
| to Bronx County, NY | |
| to New York County, NY |
| Businesses in Ossining, NY | ||||
| Name | Count | Name | Count | |
|---|---|---|---|---|
| 7-Eleven | 1 | Marshalls | 1 | |
| AutoZone | 1 | MasterBrand Cabinets | 1 | |
| Baskin-Robbins | 1 | McDonald's | 1 | |
| CVS | 1 | New Balance | 1 | |
| Domino's Pizza | 1 | Nike | 1 | |
| Dunkin Donuts | 2 | Sprint Nextel | 2 | |
| FedEx | 2 | Starbucks | 1 | |
| GNC | 1 | Stop & Shop | 1 | |
| GameStop | 1 | Subway | 1 | |
| H&R Block | 1 | True Value | 1 | |
| KFC | 1 | UPS | 1 | |
Strongest AM radio stations in Ossining:
- WFAN (660 AM; 50 kW; NEW YORK, NY; Owner: INFINITY BROADCASTING OPERATIONS, INC.)
- WABC (770 AM; 50 kW; NEW YORK, NY; Owner: WABC-AM RADIO, INC.)
- WCBS (880 AM; 50 kW; NEW YORK, NY; Owner: INFINITY BROADCASTING OPERATIONS, INC.)
- WVIP (1310 AM; 5 kW; MT. KISCO, NY; Owner: RADIO VISION CRISTIANA MANAGEMENT)
- WMCA (570 AM; 50 kW; NEW YORK, NY; Owner: SALEM MEDIA OF NEW YORK, LLC)
- WOR (710 AM; 50 kW; NEW YORK, NY; Owner: BUCKLEY BROADCASTING CORPORATION)
- WEPN (1050 AM; 50 kW; NEW YORK, NY; Owner: NEW YORK AM RADIO, LLC)
- WBBR (1130 AM; 50 kW; NEW YORK, NY; Owner: BLOOMBERG COMMUNICATIONS INC.)
- WINS (1010 AM; 50 kW; NEW YORK, NY; Owner: INFINITY BROADCASTING OPERATIONS, INC.)
- WADO (1280 AM; 50 kW; NEW YORK, NY; Owner: WADO-AM LICENSE CORP.)
- WSNR (620 AM; 20 kW; JERSEY CITY, NJ)
- WVNJ (1160 AM; 20 kW; OAKLAND, NJ; Owner: UNIVERSAL B/CASTING OF NEW YORK,INC.)
- WGSM (740 AM; 25 kW; HUNTINGTON, NY; Owner: K RADIO LICENSEE, INC.)
Strongest FM radio stations in Ossining:
- WDFH (90.3 FM; OSSINING, NY; Owner: WESTCHESTER COUNCIL FOR PUBLIC B/CNG)
- WOSS (91.1 FM; OSSINING, NY; Owner: UNION FREE SCHOOL DISTRICT # 1)
- WXPK (107.1 FM; BRIARCLIFF MANOR, NY; Owner: NASSAU BROADCASTING HOLDINGS, INC.)
- WPLJ (95.5 FM; NEW YORK, NY; Owner: WPLJ-FM RADIO, INC.)
- WNYK (88.7 FM; NYACK, NY; Owner: NYACK COLLEGE)
- WFAF (106.3 FM; MOUNT KISCO, NY; Owner: CUMULUS LICENSING CORP.)
- WFAS-FM (103.9 FM; WHITE PLAINS, NY; Owner: CUMULUS LICENSING CORP.)
- WARY (88.1 FM; VALHALLA, NY; Owner: WESTCHESTER COMMUNITY COLLEGE)
- WKCR-FM (89.9 FM; NEW YORK, NY; Owner: TRUSTEES OF COLUMBIA UNIVERSITY IN NEW YORK)
- WSPK (104.7 FM; POUGHKEEPSIE, NY; Owner: 6 JOHNSON ROAD LICENSES, INC.)
- WLJP (89.3 FM; MONROE, NY; Owner: SOUND OF LIFE, INC.)
- WHUD (100.7 FM; PEEKSKILL, NY; Owner: 6 JOHNSON ROAD LICENSES, INC.)
- WKTU (103.5 FM; LAKE SUCCESS, NY; Owner: AMFM RADIO LICENSES, LLC)
- WNEW (102.7 FM; NEW YORK, NY; Owner: INFINITY BROADCASTING OPERATIONS, INC.)
- WQCD (101.9 FM; NEW YORK, NY; Owner: EMMIS RADIO LICENSE CORPORATION)
- WAXQ (104.3 FM; NEW YORK, NY; Owner: AMFM NEW YORK LICENSES, LLC)
- WHTZ (100.3 FM; NEWARK, NJ; Owner: AMFM RADIO LICENSES, L.L.C.)
- WWPR-FM (105.1 FM; NEW YORK, NY; Owner: AMFM RADIO LICENSES, L.L.C.)
- WCAA (105.9 FM; NEWARK, NJ; Owner: WADO-AM LICENSE CORP. ("WADO"))
- WCBS-FM (101.1 FM; NEW YORK, NY; Owner: INFINITY BROADCASTING OPERATIONS, INC.)
TV broadcast stations around Ossining:
- WNYW (Channel 5; NEW YORK, NY; Owner: FOX TELEVISION STATIONS, INC.)
- W68DN (Channel 68; CHERRY HILL, ETC., NJ; Owner: MARCIA COHEN)
- WCBS-TV (Channel 2; NEW YORK, NY; Owner: CBS BROADCASTING INC.)
- WFME-TV (Channel 66; WEST MILFORD, NJ; Owner: FAMILY STATIONS, INC.)
- WABC-TV (Channel 7; NEW YORK, NY; Owner: AMERICAN BROADCASTING COMPANIES, INC)
- WPIX (Channel 11; NEW YORK, NY; Owner: WPIX, INC.)
- WWOR-TV (Channel 9; SECAUCUS, NJ; Owner: FOX TELEVISION STATIONS, INC.)
- WNJU (Channel 47; LINDEN, NJ; Owner: WNJU LICENSE CORPORATION)
- WXNY-LP (Channel 32; NEW YORK, NY; Owner: ISLAND BROADCASTING COMPANY)
- WFUT (Channel 68; NEWARK, NJ; Owner: UNIVISION NEW YORK LLC)
- WPXN-TV (Channel 31; NEW YORK, NY; Owner: PAXSON COMMUNICATIONS LICENSE COMPANY, LLC)
- WNYE-TV (Channel 25; NEW YORK, NY; Owner: NEW YORK CITY BOARD OF EDUCATION)
- WNBC (Channel 4; NEW YORK, NY; Owner: NATIONAL BROADCASTING COMPANY, INC.)
- WNET (Channel 13; NEWARK, NJ; Owner: EDUCATIONAL BROADCASTING CORPORATION)
- WXTV (Channel 41; PATERSON, NJ; Owner: WXTV LICENSE PARTNERSHIP, G.P.)
- WTBY (Channel 54; POUGHKEEPSIE, NY; Owner: TRINITY BROADCASTING OF NEW YORK, INC.)
- WKOB-LP (Channel 53; NEW YORK, NY; Owner: WKOB COMMUNICATIONS, INC.)
- WEBR-CA (Channel 17; MANHATTAN, NY; Owner: K LICENSEE INC.)
- WRNN-LP (Channel 57; NYACK, NY; Owner: LP NYACK LIMITED PARTNERSHIP)
- W38CL (Channel 38; BRONX, NY; Owner: RENARD COMMUNICATIONS CORP.)
- WPXO-LP (Channel 34; EAST ORANGE, NJ; Owner: PAXSON COMMUNICATIONS LPTV, INC.)
- W60AI (Channel 60; NEW YORK, NY; Owner: VENTANA TELEVISION, INC.)
- WNYX-LP (Channel 35; NEW YORK, NY; Owner: ISLAND BROADCASTING COMPANY)
- W33BS (Channel 33; DARIEN, CT; Owner: CT&T BROADCASTING, INC.)
- WNYN-LP (Channel 39; NEW YORK, NY; Owner: ISLAND BROADCASTING COMPANY)
- National Bridge Inventory (NBI) Statistics
- 23Number of bridges
- 161ft / 48.8mTotal length
- $48,707,000Total costs
- 222,516Total average daily traffic
- 6,521Total average daily truck traffic
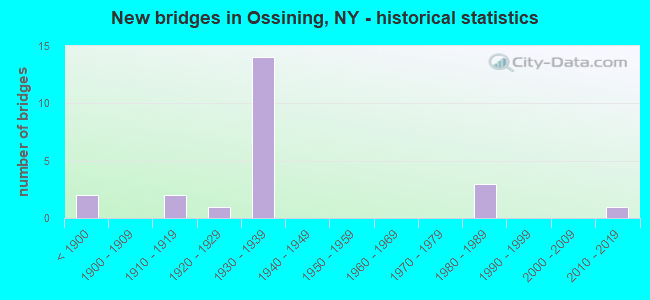
- New bridges - historical statistics
- 2Before 1900
- 21910-1919
- 11920-1929
- 141930-1939
- 31980-1989
- 12010-2019
FCC Registered Broadcast Land Mobile Towers: 16 (See the full list of FCC Registered Broadcast Land Mobile Towers)
FCC Registered Microwave Towers: 3 (See the full list of FCC Registered Microwave Towers in this town)
FCC Registered Paging Towers: 1 (See the full list of FCC Registered Paging Towers)
FCC Registered Maritime Coast & Aviation Ground Towers: 9 (See the full list of FCC Registered Maritime Coast & Aviation Ground Towers)
FCC Registered Amateur Radio Licenses: 83 (See the full list of FCC Registered Amateur Radio Licenses in Ossining)
FAA Registered Aircraft: 8 (See the full list of FAA Registered Aircraft in Ossining)
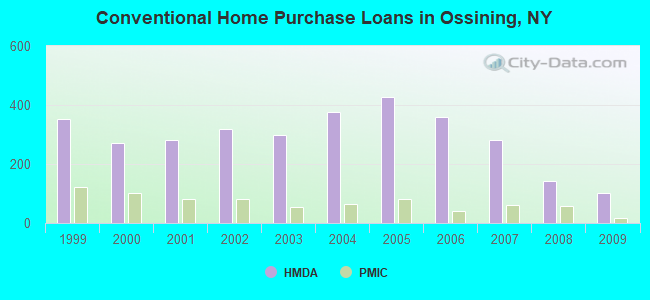
| Home Mortgage Disclosure Act Aggregated Statistics For Year 2009 (Based on 5 full tracts) | ||||||||||||
| A) FHA, FSA/RHS & VA Home Purchase Loans | B) Conventional Home Purchase Loans | C) Refinancings | D) Home Improvement Loans | E) Loans on Dwellings For 5+ Families | F) Non-occupant Loans on < 5 Family Dwellings (A B C & D) | |||||||
|---|---|---|---|---|---|---|---|---|---|---|---|---|
| Number | Average Value | Number | Average Value | Number | Average Value | Number | Average Value | Number | Average Value | Number | Average Value | |
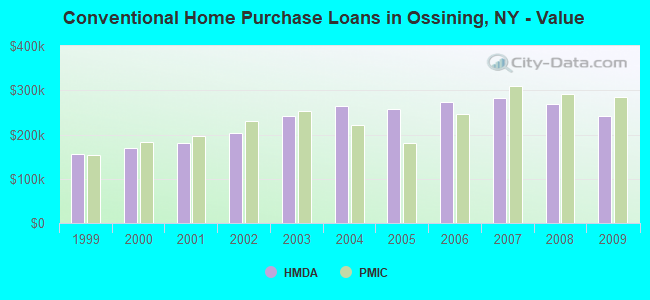
| LOANS ORIGINATED | 27 | $345,370 | 101 | $241,119 | 136 | $273,772 | 5 | $68,800 | 0 | $0 | 8 | $205,875 |
| APPLICATIONS APPROVED, NOT ACCEPTED | 2 | $302,000 | 14 | $269,786 | 27 | $273,333 | 7 | $60,857 | 1 | $1,688,000 | 1 | $394,000 |
| APPLICATIONS DENIED | 8 | $302,500 | 36 | $266,111 | 117 | $295,410 | 18 | $78,444 | 0 | $0 | 10 | $252,600 |
| APPLICATIONS WITHDRAWN | 8 | $321,250 | 13 | $256,000 | 56 | $280,554 | 1 | $392,000 | 0 | $0 | 4 | $242,250 |
| FILES CLOSED FOR INCOMPLETENESS | 1 | $344,000 | 8 | $220,625 | 17 | $240,412 | 5 | $152,000 | 0 | $0 | 1 | $485,000 |
Detailed HMDA statistics for the following Tracts: 0133.01 , 0133.03, 0133.04, 0134.00, 0135.00, 0136.00
| Private Mortgage Insurance Companies Aggregated Statistics For Year 2009 (Based on 5 full tracts) | ||||
| A) Conventional Home Purchase Loans | B) Refinancings | |||
|---|---|---|---|---|
| Number | Average Value | Number | Average Value | |
| LOANS ORIGINATED | 18 | $284,389 | 7 | $372,143 |
| APPLICATIONS APPROVED, NOT ACCEPTED | 3 | $293,333 | 1 | $231,000 |
| APPLICATIONS DENIED | 1 | $567,000 | 2 | $355,500 |
| APPLICATIONS WITHDRAWN | 2 | $160,000 | 1 | $388,000 |
| FILES CLOSED FOR INCOMPLETENESS | 2 | $287,000 | 0 | $0 |
Detailed PMIC statistics for the following Tracts: 0133.01 , 0133.04, 0134.00, 0135.00, 0136.00
2003 - 2018 National Fire Incident Reporting System (NFIRS) incidents
- Fire incident types reported to NFIRS in Ossining, NY
- 26154.7%Structure Fires
- 10722.4%Outside Fires
- 6714.0%Mobile Property/Vehicle Fires
- 428.8%Other
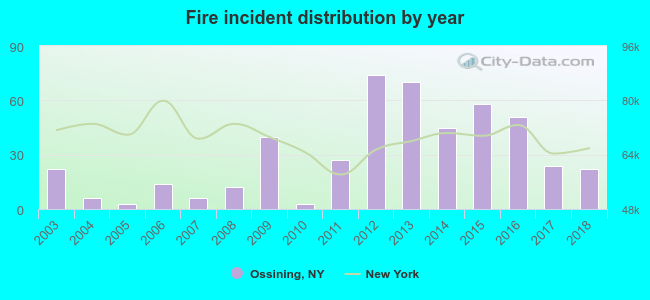 Based on the data from the years 2003 - 2018 the average number of fires per year is 30. The highest number of reported fire incidents - 74 took place in 2012, and the least - 3 in 2005. The data has a constant trend.
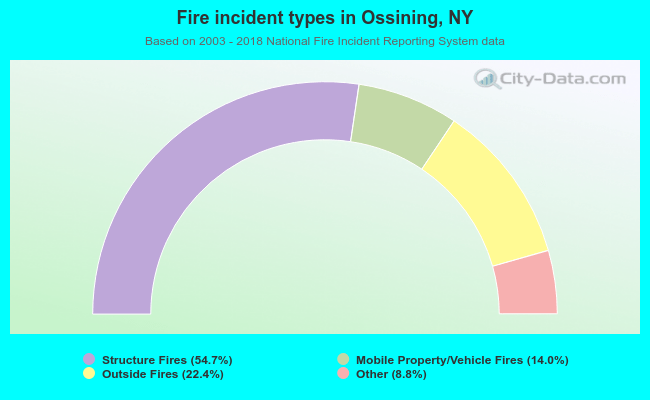 When looking into fire subcategories, the most reports belonged to: Structure Fires (54.7%), and Outside Fires (22.4%).
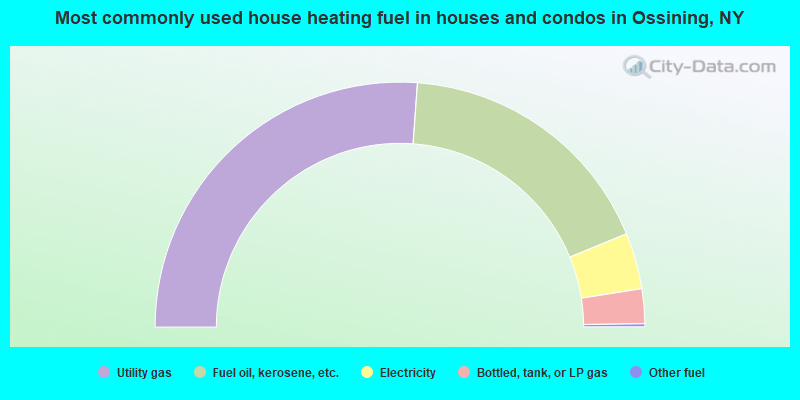
- 52.3%Utility gas
- 35.3%Fuel oil, kerosene, etc.
- 7.4%Electricity
- 4.6%Bottled, tank, or LP gas
- 0.4%Other fuel
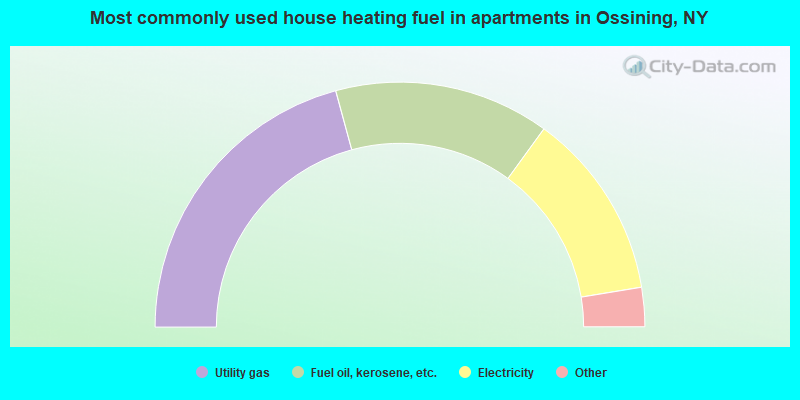
- 41.6%Utility gas
- 28.5%Fuel oil, kerosene, etc.
- 24.8%Electricity
- 2.5%Bottled, tank, or LP gas
- 2.0%Other fuel
- 0.7%No fuel used
Ossining compared to New York state average:
- Unemployed percentage significantly below state average.
- Hispanic race population percentage above state average.
- Median age below state average.
- Foreign-born population percentage above state average.
- Length of stay since moving in above state average.
- Institutionalized population percentage significantly above state average.
Ossining on our top lists:
- #1 on the list of "Top 101 cities with the most residents born in Ecuador (population 500+)"
- #9 on the list of "Top 101 cities with the most residents born in South America (population 500+)"
- #23 on the list of "Top 101 cities with largest percentage of females in occupations: building and grounds cleaning and maintenance occupations (population 5,000+)"
- #25 on the list of "Top 101 cities with largest percentage of females in industries: other services, except public administration (population 5,000+)"
- #41 on the list of "Top 101 cities with the largest percentage of people in local jails and other confinement facilities (including police lockups) (population 1,000+)"
- #49 on the list of "Top 101 cities with the most people taking a taxi to work (population 5,000+)"
- #65 on the list of "Top 101 cities with largest percentage of males in industries: broadcasting, internet publishing, and telecommunications services (population 5,000+)"
- #65 on the list of "Top 101 cities with largest percentage of females in industries: broadcasting, internet publishing, and telecommunications services (population 5,000+)"
- #65 on the list of "Top 101 cities with largest percentage of males in industries: wholesale electronic markets and agents and brokers (population 5,000+)"
- #65 on the list of "Top 101 cities with largest percentage of females in industries: wholesale electronic markets and agents and brokers (population 5,000+)"
- #67 on the list of "Top 101 cities with largest percentage of females in occupations: extraction workers (population 5,000+)"
- #96 on the list of "Top 101 cities with the most residents born in Portugal (population 500+)"
- #10 on the list of "Top 101 counties with the lowest percentage of residents that keep firearms around their homes"
- #18 on the list of "Top 101 counties with the most Catholic congregations"
- #19 on the list of "Top 101 counties with the most Catholic adherents"
- #25 on the list of "Top 101 counties with the most Orthodox congregations"
- #27 on the list of "Top 101 counties with the highest percentage of residents that visited a dentist within the past year"

|
|
Total of 2477 patent applications in 2008-2024.