Downtown Verona (Downtown) neighborhood in Verona, New Jersey (NJ), 07044 detailed profile
Settings
X


Business Search - 14 Million verified businesses
Area: 0.130 square miles
Population: 642
Population density:
| Downtown Verona (Downtown): | 4,943 people per square mile |
| Verona: | 4,917 people per square mile |

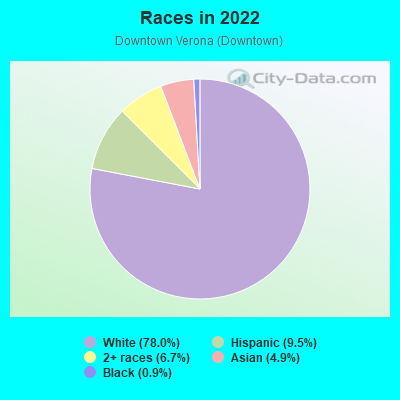
- 52478.0%White
- 649.5%Hispanic or Latino
- 456.7%Two or more races
- 334.9%Asian
- 60.9%Black
Distribution of median household income
![Distribution of median household income]()
- 42Less than $10,000
- 8$10,000 to $19,999
- 13$20,000 to $29,999
- 48$30,000 to $39,999
- 24$40,000 to $49,999
- 12$50,000 to $59,999
- 34$60,000 to $74,999
- 35$75,000 to $99,999
- 14$100,000 to $124,999
- 26$125,000 to $149,999
- 62$150,000 to $199,999
- 58$200,000 or more

Distribution of owner-occupied house/condo value
![Distribution of owner-occupied house/condo value]()
- 65Less than $50,000
- 13$50,000 to $99,999
- 5$100,000 to $149,999
- 28$150,000 to $199,999
- 29$200,000 to $249,999
- 21$250,000 to $299,999
- 23$300,000 to $399,999
- 48$400,000 to $499,999
- 121$500,000 to $749,999
- 34$750,000 to $999,999
- 41$1,000,000 or more

Distribution of rent paid by renters
![Distribution of rent paid by renters]()
- 3$100 to $199
- 8$200 to $299
- 6$400 to $499
- 5$500 to $599
- 8$600 to $699
- 2$700 to $799
- 26$1,250 to $1,499
- 65$1,500 to $1,999
- 45$2,000 or more

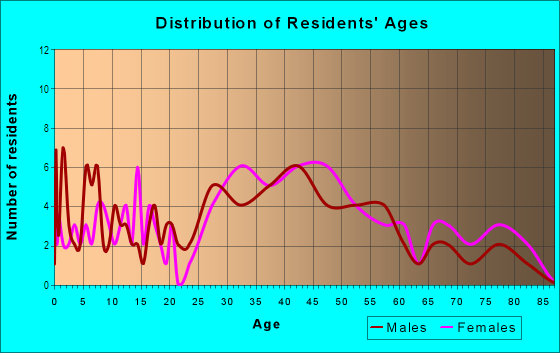
| Males: | 288 |
| Females: | 353 |
| Males: | 46.7 years |
| Females: | 45.9 years |
Average household size:
| Downtown Verona (Downtown): | 2.6 people |
| New Jersey: | 2.6 people |
Percentage of family households:
| Downtown Verona (Downtown): | 43.1% |
| New Jersey: | 47.0% |
| Here: | 59.9% |
| New Jersey: | 49.9% |
Percentage of married-couple families with children (among all households):
| Downtown Verona (Downtown): | 34.4% |
| New Jersey: | 51.5% |
Percentage of single-mother households (among all households):
| Downtown Verona (Downtown): | 5.3% |
| New Jersey: | 7.6% |
Percentage of never married males 15 years old and over:
Percentage of never married females 15 years old and over:
| Downtown Verona (Downtown): | 10.4% |
| New Jersey: | 18.2% |
Percentage of never married females 15 years old and over:
| Downtown Verona (Downtown): | 13.5% |
| New Jersey: | 16.6% |
Percentage of people that speak English not well or not at all:
| Downtown Verona (Downtown): | 1.1% |
| New Jersey: | 6.5% |
Percentage of people born in this state:
Percentage of people born in another U.S. state:
Percentage of native residents but born outside the U.S.:
Percentage of foreign born residents:
| Here: | 60.4% |
| New Jersey: | 50.7% |
Percentage of people born in another U.S. state:
| Downtown Verona (Downtown): | 30.1% |
| New Jersey: | 23.4% |
Percentage of native residents but born outside the U.S.:
| Here: | 0.5% |
| New Jersey: | 2.4% |
Percentage of foreign born residents:
| Here: | 9.0% |
| New Jersey: | 23.5% |
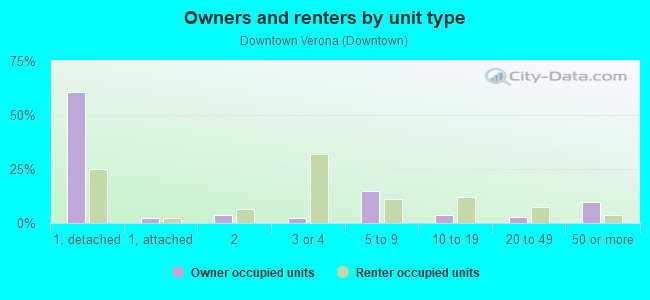
Owner-occupied
Renter-occupied

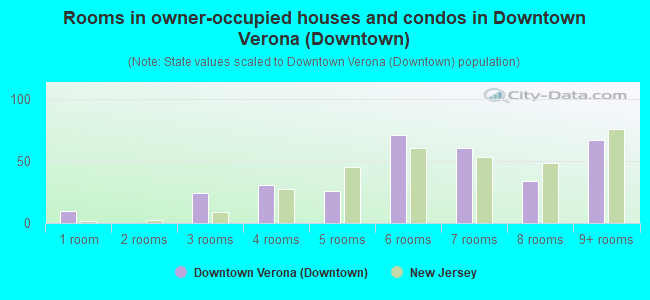
- Rooms in owner-occupied houses and condos in Downtown Verona <
> - 101 room
- 02 rooms
- 243 rooms
- 314 rooms
- 265 rooms
- 716 rooms
- 617 rooms
- 348 rooms
- 679+ rooms
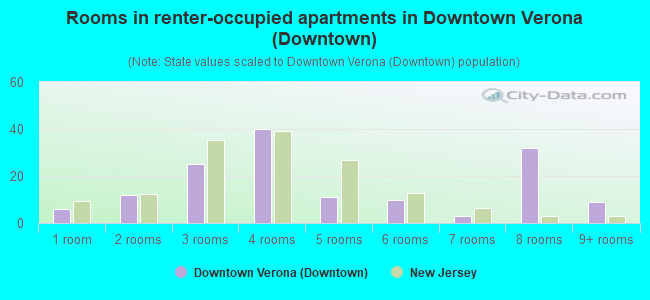
- Rooms in renter-occupied apartments in Downtown Verona <
> - 61 room
- 122 rooms
- 253 rooms
- 404 rooms
- 115 rooms
- 106 rooms
- 37 rooms
- 328 rooms
- 99+ rooms
Owner-occupied
Renter-occupied
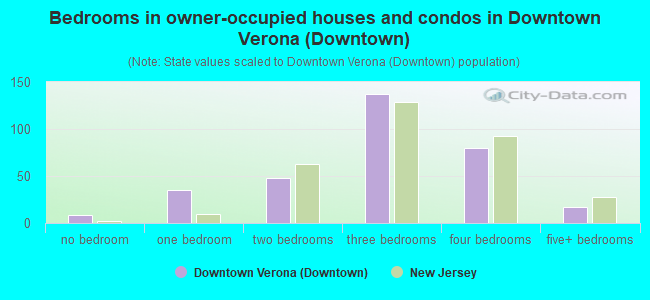
- Bedrooms in owner-occupied houses and condos in Downtown Verona <
> - 8no bedroom
- 351 bedroom
- 482 bedrooms
- 1373 bedrooms
- 804 bedrooms
- 175+ bedrooms
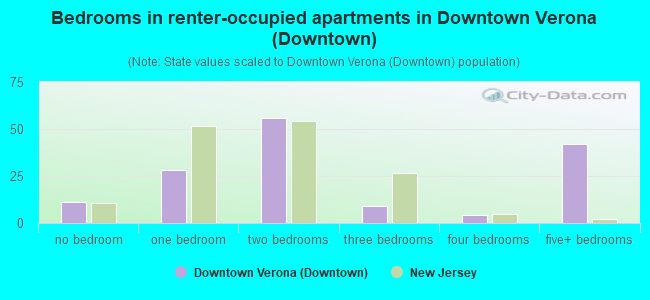
- Bedrooms in renter-occupied apartments in Downtown Verona <
> - 11no bedroom
- 281 bedroom
- 562 bedrooms
- 93 bedrooms
- 44 bedrooms
- 425+ bedrooms
Average number of cars or other vehicles available in houses/condos:
Average number of cars or other vehicles available in apartments:
| This neighborhood: | 2.3 |
| New Jersey: | 2.0 |
Average number of cars or other vehicles available in apartments:
| Here: | |
| New Jersey: |
Percentage of units with a mortgage:
| Downtown Verona (Downtown): | 45.9% |
| New Jersey: | 63.3% |
Average estimated value of detached houses in 2022 (84.5% of all units):
| Downtown Verona (Downtown): | $613,992 |
| New Jersey: | $537,591 |
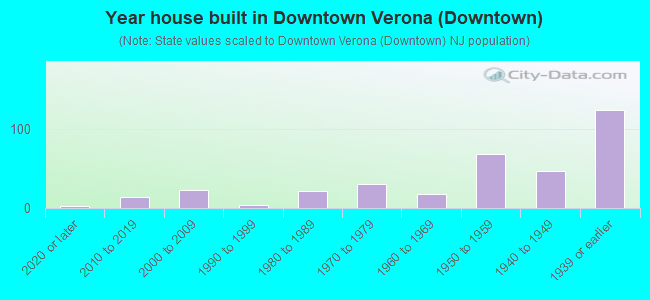
- Year house built in Downtown Verona <
> - 32020 or later
- 142010 to 2019
- 232000 to 2009
- 41990 to 1999
- 221980 to 1989
- 311970 to 1979
- 181960 to 1969
- 681950 to 1959
- 471940 to 1949
- 1241939 or earlier
City-data.com crime index for place in 2020 (higher means more crime):
| City: | 35.7 |
| U.S. average: | 219.5 |
Travel time to work (commute)
![Travel time to work (commute)]()
- 14Less than 5 minutes
- 255 to 9 minutes
- 2110 to 14 minutes
- 6215 to 19 minutes
- 4620 to 24 minutes
- 2725 to 29 minutes
- 5430 to 34 minutes
- 1035 to 39 minutes
- 1640 to 44 minutes
- 1645 to 59 minutes
- 4360 to 89 minutes
- 1990 or more minutes

Means of transportation to work
![Means of transportation to work]()
- 63.1%198Drove a car alone
- 9.6%30Carpooled
- 5.1%16Bus
- 11.5%36Subway or elevated rail
- 4.1%13Long-distance train or commuter rail
- 3.8%12Bicycle
- 12.1%38Walked
- 38.2%120Worked at home

Time leaving home to go to work
![Time leaving home to go to work]()
- 75:00 a.m. to 5:29 a.m.
- 125:30 a.m. to 5:59 a.m.
- 166:00 a.m. to 6:29 a.m.
- 166:30 a.m. to 6:59 a.m.
- 657:00 a.m. to 7:29 a.m.
- 717:30 a.m. to 7:59 a.m.
- 828:00 a.m. to 8:29 a.m.
- 278:30 a.m. to 8:59 a.m.
- 219:00 a.m. to 9:59 a.m.
- 1010:00 a.m. to 10:59 a.m.
- 511:00 a.m. to 11:59 a.m.
- 2312:00 p.m. to 3:59 p.m.
- 54:00 p.m. to 11:59 p.m.

Occupations of males:
- Percentage of males in management occupations (except farmers):
Here: 13.4% New Jersey: 13.9%
- Percentage of males in business and financial operations occupations:
Here: 11.6% New Jersey: 6.9%
- Percentage of males in computer and mathematical occupations:
Here: 2.0% New Jersey: 6.5%
- Percentage of males in architecture and engineering occupations:
Here: 4.8% New Jersey: 3.1%
- Percentage of males in life, physical, and social science occupations:
Here: 1.9% New Jersey: 1.2%
- Percentage of males in community and social services occupations:
Here: 5.7% New Jersey: 1.1%
- Percentage of males in legal occupations:
Here: 2.9% New Jersey: 1.5%
- Percentage of males in education, training, and library occupations:
Here: 4.7% New Jersey: 3.6%
- Percentage of males in arts, design, entertainment, sports, and media occupations:
Here: 3.2% New Jersey: 2.0%
- Percentage of males in healthcare practitioners and technical occupations:
Here: 4.6% New Jersey: 3.2%
- Percentage of males in service occupations:
Here: 13.3% New Jersey: 12.9%
- Percentage of males in sales and office occupations:
Here: 12.7% New Jersey: 15.3%
- Percentage of males in production occupations:
Here: 7.0% New Jersey: 4.8%
- Percentage of males in transportation occupations:
Here: 2.3% New Jersey: 6.5%
- Percentage of males in material moving occupations:
Here: 3.4% New Jersey: 4.7%
Occupations of females:
- Percentage of females in management occupations (except farmers):
Here: 14.1% New Jersey: 10.4%
- Percentage of females in business and financial operations occupations:
Here: 8.4% New Jersey: 7.3%
- Percentage of females in computer and mathematical occupations:
Here: 1.4% New Jersey: 2.4%
- Percentage of females in community and social services occupations:
Here: 12.6% New Jersey: 2.6%
- Percentage of females in legal occupations:
Here: 7.2% New Jersey: 1.6%
- Percentage of females in education, training, and library occupations:
Here: 16.4% New Jersey: 11.4%
- Percentage of females in arts, design, entertainment, sports, and media occupations:
Here: 3.7% New Jersey: 2.2%
- Percentage of females in healthcare practitioners and technical occupations:
Here: 4.6% New Jersey: 9.6%
- Percentage of females in service occupations:
Here: 6.5% New Jersey: 17.2%
- Percentage of females in sales and office occupations:
Here: 18.0% New Jersey: 26.7%
- Percentage of females in production occupations:
Here: 4.4% New Jersey: 2.7%
- Percentage of females in transportation occupations:
Here: 1.8% New Jersey: 1.2%
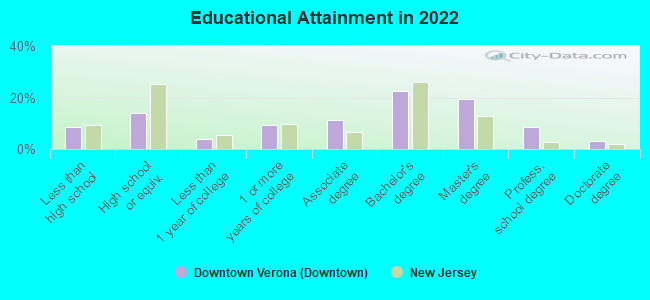
Education in this neighborhood (subdivision or community):
- Percentage of people 3 years and older in K-12 schools:
Downtown Verona (Downtown): 28.3% New Jersey: 16.6%
- Percentage of people 3 years and older in undergraduate colleges:
Downtown Verona (Downtown): 7.6% New Jersey: 4.9%
- Percentage of people 3 years and older in grad. or professional schools:
Downtown Verona (Downtown): 4.2% New Jersey: 1.6%
- Percentage of students K-12 enrolled in private schools:
Downtown Verona (Downtown): 30.9% New Jersey: 12.7%
Percentage of population below poverty level:
| Downtown Verona (Downtown): | 4.7% |
| New Jersey: | 9.7% |
Median year owner moved in (as recorded in 2022):
| Downtown Verona (Downtown): | 2001 |
| New Jersey: | 2008 |
Percentage of married-couple families with both working:
| Downtown Verona (Downtown): | 128.5% |
| New Jersey: | 72.0% |
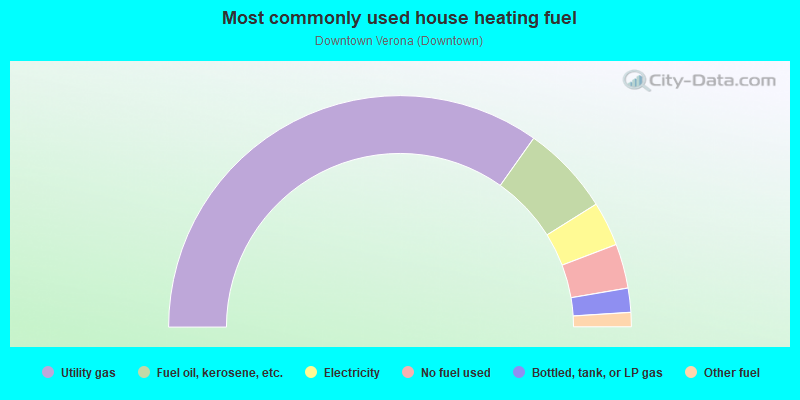
- 69.7%Utility gas
- 12.6%Fuel oil, kerosene, etc.
- 6.2%Electricity
- 6.2%No fuel used
- 3.4%Bottled, tank, or LP gas
- 2.0%Other fuel
Roads and streets:
Rte 506 (Bloomfield Ave)
Length: 0.72 miles
Directions: E-W, SE-NW
Address range: 354 to 725
Directions: E-W, SE-NW
Address range: 354 to 725
Claremont Ave
Length: 0.25 miles
Direction: E-W
Address range: 282 to 352
Direction: E-W
Address range: 282 to 352
Gould St
Length: 0.19 miles
Direction: SW-NE
Address range: 1 to 48
Direction: SW-NE
Address range: 1 to 48
Grove Ave
Length: 0.17 miles
Direction: SW-NE
Address range: 1 to 47
Direction: SW-NE
Address range: 1 to 47
Hill St
Length: 0.15 miles
Direction: SE-NW
Address range: 1 to 35
Direction: SE-NW
Address range: 1 to 35
Rockland Ter
Length: 0.10 miles
Directions: N-S, SE-NW, SW-NE
Address range: 1 to 38
Directions: N-S, SE-NW, SW-NE
Address range: 1 to 38
Reid Pl
Length: 0.10 miles
Direction: E-W
Address range: 66 to 112
Direction: E-W
Address range: 66 to 112
Montrose Ave
Length: 0.10 miles
Direction: SW-NE
Address range: 3 to 28
Direction: SW-NE
Address range: 3 to 28
S Prospect St
Length: 0.09 miles
Direction: SW-NE
Address range: 1 to 29
Direction: SW-NE
Address range: 1 to 29
Park Pl
Length: 0.09 miles
Direction: SW-NE
Address range: 1 to 37
Direction: SW-NE
Address range: 1 to 37
Park Ave
Length: 0.07 miles
Direction: SW-NE
Address range: 1 to 19
Direction: SW-NE
Address range: 1 to 19
Cumberland Ave
Length: 0.04 miles
Direction: E-W
Address range: 1 to 10
Direction: E-W
Address range: 1 to 10
Lakeside Ave
Length: 0.00 miles
Direction: SW-NE
Direction: SW-NE