Estimated zip code population in 2022: 14,457 Zip code population in 2010: 13,584 Zip code population in 2000: 13,948
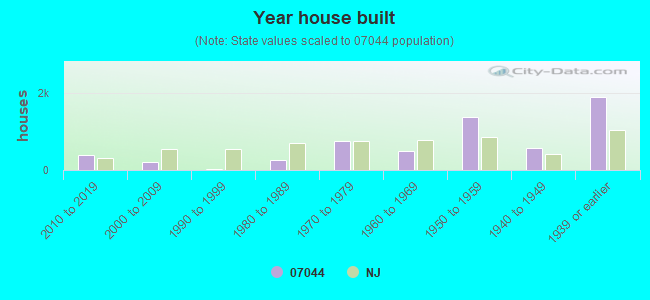
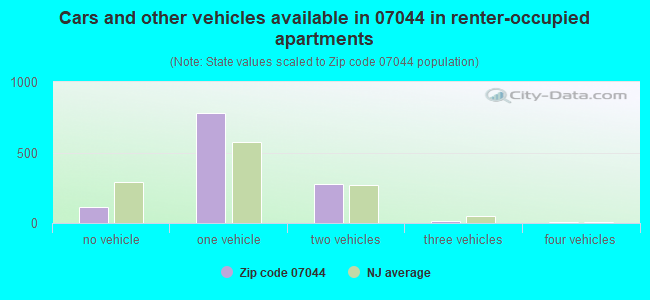
Houses and condos: 6,021 Renter-occupied apartments: 1,178
% of renters here:
20%
State:
35%
March 2022 cost of living index in zip code 07044: 113.8 (more than average, U.S. average is 100)
Land area: 2.8 sq. mi. Water area: 0.0 sq. mi.
Population density: 5,205 people per square mile
(average).
OSM Map
Google Map
MSN Map
OSM Map
General Map
Google Map
MSN Map
OSM Map
Google Map
MSN Map
OSM Map
Google Map
MSN Map
Please wait while loading the map...
Real estate property taxes paid for housing units in 2022:
This zip code:
1.5% ($9,521)
New Jersey:
2.1% ($8,897)
Median real estate property taxes paid for housing units with mortgages in 2022: $9,557 (1.5%) Median real estate property taxes paid for housing units with no mortgage in 2022: $9,483 (1.7%)
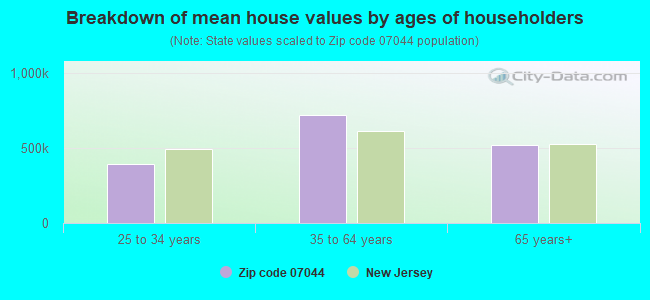
Estimated median house/condo value in 2022: $616,637
07044:
$616,637
New Jersey:
$428,900
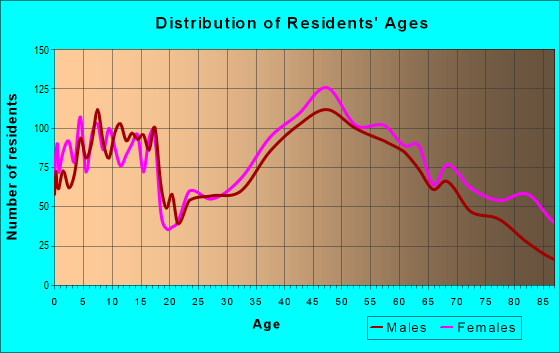
Median resident age:
This zip code:
44.4 years
New Jersey median age:
40.4 years
Average household size:
This zip code:
2.4 people
New Jersey:
2.6 people
Averages for the 2020 tax year for zip code 07044, filed in 2021:
Average Adjusted Gross Income (AGI) in 2020: $146,546 (Individual Income Tax Returns)
Here:
$146,546
State:
$95,247
Salary/wage: $130,438 (reported on 79.3% of returns)
Here:
$130,438
State:
$80,635
(% of AGI for various income ranges: 1173.1% for AGIs below $25k, 3726.3% for AGIs $25k-50k, 6918.9% for AGIs $50k-75k, 10093.9% for AGIs $75k-100k, 20592.5% for AGIs $100k-200k, 97786.2% for AGIs over 200k)
Taxable interest for individuals: $2,169 (reported on 49.8% of returns)
This zip code:
$2,169
New Jersey:
$2,414
(% of AGI for various income ranges: 64.5% for AGIs below $25k, 60.8% for AGIs $25k-50k, 114.1% for AGIs $50k-75k, 127.3% for AGIs $75k-100k, 246.4% for AGIs $100k-200k, 783.6% for AGIs over 200k)
Ordinary dividends: $8,964 (reported on 44.3% of returns)
Here:
$8,964
State:
$8,057
(% of AGI for various income ranges: 126.7% for AGIs below $25k, 178.3% for AGIs $25k-50k, 226.3% for AGIs $50k-75k, 353.9% for AGIs $75k-100k, 652.2% for AGIs $100k-200k, 3947.8% for AGIs over 200k)
Net capital gain/loss in AGI: +$21,464 (reported on 38.1% of returns)
Here:
+$21,464
State:
+$25,022
(% of AGI for various income ranges: 37.2% for AGIs below $25k, 93.6% for AGIs $25k-50k, 135.9% for AGIs $50k-75k, 320.0% for AGIs $75k-100k, 635.2% for AGIs $100k-200k, 11011.6% for AGIs over 200k)
Profit/loss from business: +$27,313 (reported on 20.0% of returns)
Here:
+$27,313
State:
+$18,035
(% of AGI for various income ranges: 230.8% for AGIs below $25k, 311.7% for AGIs $25k-50k, 400.6% for AGIs $50k-75k, 632.0% for AGIs $75k-100k, 1163.7% for AGIs $100k-200k, 4472.0% for AGIs over 200k)
Taxable individual retirement arrangement distribution: $26,201 (reported on 12.8% of returns)
07044:
$26,201
New Jersey:
$21,558
(% of AGI for various income ranges: 108.0% for AGIs below $25k, 261.2% for AGIs $25k-50k, 352.2% for AGIs $50k-75k, 407.6% for AGIs $75k-100k, 815.2% for AGIs $100k-200k, 2360.0% for AGIs over 200k)
Self-employed (Keogh) retirement plans: $24,106 (reported on 2.3% of returns)
07044:
$24,106
New Jersey:
$30,844
(% of AGI for various income ranges: 32.5% for AGIs $25k-50k, 60.0% for AGIs $100k-200k, 693.1% for AGIs over 200k)
Total itemized deductions: $33,356 (reported on 25.0% of returns)
Here:
$33,356
State:
$32,863
(% of AGI for various income ranges: 322.7% for AGIs below $25k, 536.1% for AGIs $25k-50k, 755.6% for AGIs $50k-75k, 1262.0% for AGIs $75k-100k, 1669.9% for AGIs $100k-200k, 6599.1% for AGIs over 200k)
Charity contributions: $7,755 (reported on 21.7% of returns)
Here:
$7,755
State:
$7,880
(% of AGI for various income ranges: 15.2% for AGIs below $25k, 34.1% for AGIs $25k-50k, 71.1% for AGIs $50k-75k, 126.8% for AGIs $75k-100k, 236.7% for AGIs $100k-200k, 1908.2% for AGIs over 200k)
Taxes paid: $9,391 (reported on 25.0% of returns)
07044:
$9,391
State:
$9,183
(% of AGI for various income ranges: 98.1% for AGIs below $25k, 146.6% for AGIs $25k-50k, 280.7% for AGIs $50k-75k, 435.6% for AGIs $75k-100k, 556.5% for AGIs $100k-200k, 1523.8% for AGIs over 200k)
Earned income credit: $1,319 (reported on 3.8% of returns)
Here:
$1,319
State:
$2,148
(% of AGI for various income ranges: 32.8% for AGIs below $25k, 24.7% for AGIs $25k-50k)
Percentage of individuals using paid preparers for their 2020 taxes: 93.0%
Here:
93%
State:
92%
(% for various income ranges: 89.6% for AGIs below $25k, 92.5% for AGIs $25k-50k, 93.2% for AGIs $50k-75k, 93.1% for AGIs $75k-100k, 93.9% for AGIs $100k-200k, 95.1% for AGIs over 200k)
Averages for the 2012 tax year for zip code 07044, filed in 2013:
Average Adjusted Gross Income (AGI) in 2012: $111,779 (Individual Income Tax Returns)
Here:
$111,779
State:
$79,688
Salary/wage: $98,657 (reported on 80.0% of returns)
Here:
$98,657
State:
$68,122
(% of AGI for various income ranges: 63.1% for AGIs below $25k, 66.4% for AGIs $25k-50k, 68.2% for AGIs $50k-75k, 66.2% for AGIs $75k-100k, 77.8% for AGIs $100k-200k, 67.8% for AGIs over 200k)
Taxable interest for individuals: $2,378 (reported on 55.3% of returns)
This zip code:
$2,378
New Jersey:
$2,193
(% of AGI for various income ranges: 3.2% for AGIs below $25k, 1.7% for AGIs $25k-50k, 1.7% for AGIs $50k-75k, 1.3% for AGIs $75k-100k, 0.8% for AGIs $100k-200k, 1.2% for AGIs over 200k)
Ordinary dividends: $6,382 (reported on 43.8% of returns)
Here:
$6,382
State:
$6,828
(% of AGI for various income ranges: 5.2% for AGIs below $25k, 3.0% for AGIs $25k-50k, 2.6% for AGIs $50k-75k, 2.5% for AGIs $75k-100k, 1.8% for AGIs $100k-200k, 2.8% for AGIs over 200k)
Net capital gain/loss in AGI: +$8,491 (reported on 33.7% of returns)
Here:
+$8,491
State:
+$15,358
(% of AGI for various income ranges: 1.0% for AGIs $50k-75k, 0.6% for AGIs $75k-100k, 1.1% for AGIs $100k-200k, 4.7% for AGIs over 200k)
Profit/loss from business: +$25,163 (reported on 18.0% of returns)
Here:
+$25,163
State:
+$19,577
(% of AGI for various income ranges: 8.7% for AGIs below $25k, 4.7% for AGIs $25k-50k, 4.2% for AGIs $50k-75k, 3.7% for AGIs $75k-100k, 3.8% for AGIs $100k-200k, 4.0% for AGIs over 200k)
Taxable individual retirement arrangement distribution: $19,847 (reported on 15.7% of returns)
07044:
$19,847
New Jersey:
$18,214
(% of AGI for various income ranges: 6.3% for AGIs below $25k, 4.1% for AGIs $25k-50k, 3.8% for AGIs $50k-75k, 4.1% for AGIs $75k-100k, 2.5% for AGIs $100k-200k, 2.3% for AGIs over 200k)
Self-employment retirement plans: $24,250 (reported on 2.0% of returns)
07044:
$24,250
New Jersey:
$24,511
(% of AGI for various income ranges: 0.6% for AGIs $25k-50k, 0.3% for AGIs $100k-200k, 0.7% for AGIs over 200k)
Total itemized deductions: $33,598 (21% of AGI, reported on 61.4% of returns)
Here:
$33,598
State:
$30,827
Here:
20.9% of AGI
State:
21.2% of AGI
(% of AGI for various income ranges: 31.7% for AGIs below $25k, 18.8% for AGIs $25k-50k, 20.3% for AGIs $50k-75k, 21.5% for AGIs $75k-100k, 20.6% for AGIs $100k-200k, 15.4% for AGIs over 200k)
Charity contributions: $3,115 (reported on 54.5% of returns)
Here:
$3,115
State:
$3,451
(% of AGI for various income ranges: 1.4% for AGIs below $25k, 1.4% for AGIs $25k-50k, 1.4% for AGIs $50k-75k, 1.7% for AGIs $75k-100k, 1.5% for AGIs $100k-200k, 1.6% for AGIs over 200k)
Taxes paid: $18,984 (reported on 61.1% of returns)
07044:
$18,984
State:
$15,801
(% of AGI for various income ranges: 13.3% for AGIs below $25k, 8.7% for AGIs $25k-50k, 9.5% for AGIs $50k-75k, 10.5% for AGIs $75k-100k, 10.9% for AGIs $100k-200k, 10.2% for AGIs over 200k)
Earned income credit: $1,429 (reported on 4.0% of returns)
Here:
$1,429
State:
$2,182
(% of AGI for various income ranges: 1.8% for AGIs below $25k, 0.3% for AGIs $25k-50k)
Percentage of individuals using paid preparers for their 2012 taxes: 67.6%
Here:
68%
State:
65%
(% for various income ranges: 58.9% for AGIs below $25k, 63.0% for AGIs $25k-50k, 67.0% for AGIs $50k-75k, 73.4% for AGIs $75k-100k, 72.4% for AGIs $100k-200k, 75.9% for AGIs over 200k)
Averages for the 2004 tax year for zip code 07044, filed in 2005:
Average Adjusted Gross Income (AGI) in 2004: $88,284 (Individual Income Tax Returns)
Here:
$88,284
State:
$64,921
Salary/wage: $79,924 (reported on 77.6% of returns)
Here:
$79,924
State:
$57,755
(% of AGI for various income ranges: 75.8% for AGIs below $10k, 50.6% for AGIs $10k-25k, 69.8% for AGIs $25k-50k, 71.5% for AGIs $50k-75k, 75.9% for AGIs $75k-100k, 69.7% for AGIs over 100k)
Taxable interest for individuals: $2,718 (reported on 70.9% of returns)
This zip code:
$2,718
New Jersey:
$2,068
(% of AGI for various income ranges: 11.6% for AGIs below $10k, 7.6% for AGIs $10k-25k, 4.2% for AGIs $25k-50k, 2.9% for AGIs $50k-75k, 2.1% for AGIs $75k-100k, 1.6% for AGIs over 100k)
Taxable dividends: $4,833 (reported on 52.3% of returns)
Here:
$4,833
State:
$3,959
(% of AGI for various income ranges: 10.7% for AGIs below $10k, 5.7% for AGIs $10k-25k, 3.6% for AGIs $25k-50k, 2.6% for AGIs $50k-75k, 2.4% for AGIs $75k-100k, 2.7% for AGIs over 100k)
Net capital gain/loss: +$9,349 (reported on 41.1% of returns)
Here:
+$9,349
State:
+$13,591
(% of AGI for various income ranges: -8.7% for AGIs below $10k, -0.8% for AGIs $10k-25k, 0.5% for AGIs $25k-50k, 0.4% for AGIs $50k-75k, 1.6% for AGIs $75k-100k, 6.1% for AGIs over 100k)
Profit/loss from business: +$21,721 (reported on 16.0% of returns)
Here:
+$21,721
State:
+$17,520
(% of AGI for various income ranges: 5.7% for AGIs below $10k, 8.4% for AGIs $10k-25k, 4.2% for AGIs $25k-50k, 3.2% for AGIs $50k-75k, 3.6% for AGIs $75k-100k, 3.9% for AGIs over 100k)
IRA payment deduction: $3,356 (reported on 4.1% of returns)
07044:
$3,356
New Jersey:
$3,270
(% of AGI for various income ranges: 0.5% for AGIs $10k-25k, 0.4% for AGIs $25k-50k, 0.3% for AGIs $50k-75k, 0.2% for AGIs $75k-100k, 0.1% for AGIs over 100k)
Self-employed pension: $14,993 (reported on 2.3% of returns)
Here:
$14,993
New Jersey:
$17,258
(% of AGI for various income ranges: 0.5% for AGIs $10k-25k, 0.2% for AGIs $50k-75k, 0.3% for AGIs $75k-100k, 0.5% for AGIs over 100k)
Total itemized deductions: $26,281 (21% of AGI, reported on 62.0% of returns)
Here:
$26,281
State:
$23,924
Here:
21.0% of AGI
State:
21.1% of AGI
(% of AGI for various income ranges: 31.7% for AGIs below $10k, 31.1% for AGIs $10k-25k, 20.8% for AGIs $25k-50k, 21.5% for AGIs $50k-75k, 20.9% for AGIs $75k-100k, 16.7% for AGIs over 100k)
Charity contributions deductions: $3,381 (3% of AGI, reported on 58.6% of returns)
Here:
$3,381
State:
$3,242
Here:
2.6% of AGI
State:
2.7% of AGI
(% of AGI for various income ranges: 1.5% for AGIs below $10k, 2.3% for AGIs $10k-25k, 2.0% for AGIs $25k-50k, 2.1% for AGIs $50k-75k, 2.3% for AGIs $75k-100k, 2.3% for AGIs over 100k)
Total tax: $16,800 (reported on 84.6% of returns)
07044:
$16,800
State:
$12,321
(% of AGI for various income ranges: 2.9% for AGIs below $10k, 4.9% for AGIs $10k-25k, 8.4% for AGIs $25k-50k, 10.1% for AGIs $50k-75k, 10.8% for AGIs $75k-100k, 19.3% for AGIs over 100k)
Earned income credit: $1,190 (reported on 3.0% of returns)
Here:
$1,190
State:
$1,711
Percentage of individuals using paid preparers for their 2004 taxes: 69.2%
Here:
69%
State:
65%
(% for various income ranges: 61.6% for AGIs below $10k, 68.8% for AGIs $10k-25k, 65.1% for AGIs $25k-50k, 71.4% for AGIs $50k-75k, 71.1% for AGIs $75k-100k, 74.2% for AGIs over 100k)
Likely homosexual households (counted as self-reported same-sex unmarried-partner households)
Lesbian couples: 0.0% of all households
Gay men: 0.3% of all households
Household received Food Stamps/SNAP in the past 12 months: 189 Household did not receive Food Stamps/SNAP in the past 12 months: 5,717
Women who had a birth in the past 12 months: 145 (146 now married, 1 unmarried) Women who did not have a birth in the past 12 months: 2,657 (1,390 now married, 1,261 unmarried)
Housing units in zip code 07044 with a mortgage: 2,969 (300 second mortgage, 20 home equity loan, 285 both second mortgage and home equity loan) Houses without a mortgage: 197
Median monthly owner costs for units with a mortgage: $3,253 Median monthly owner costs for units without a mortgage: $1,425
Residents with income below the poverty level in 2022:
This zip code:
4.5%
Whole state:
9.7%
Residents with income below 50% of the poverty level in 2022:
This zip code:
1.8%
Whole state:
5.2%
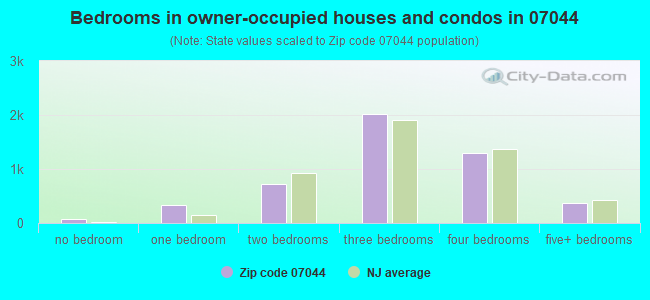
Median number of rooms in houses and condos:
Here:
7.2
State:
6.8
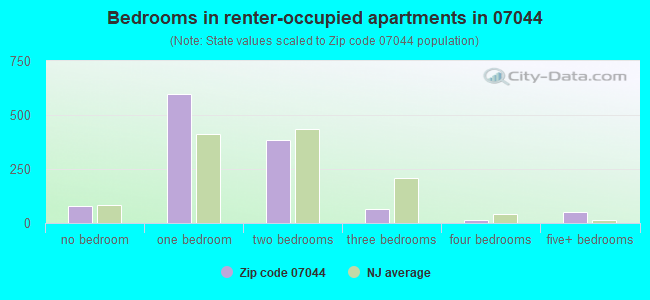
Median number of rooms in apartments:
Here:
3.8
State:
3.9
Notable locations in this zip code not listed on our city pages
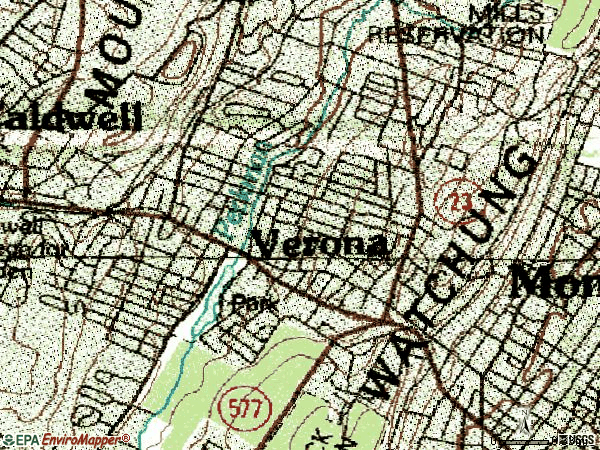
Notable locations in zip code 07044: Montclair Golf Course (A), Verona Rescue Squad (B), Verona Fire Department Station 1 (C), Verona Fire Department Station 2 (D), Verona Rescue Squad (E). Display/hide their locations on the map
Churches in zip code 07044 include: Calvary Lutheran Church of Verona (A), Church of the Holy Spirit (B), First Congregational Church (C), First Presbyterian Church (D), Our Lady of the Lake Church (E), Verona United Methodist Church (F). Display/hide their locations on the map
In group quarters: 21 (-1 institutionalized population)
Size of family households: 1,686 2-persons, 803 3-persons, 1,056 4-persons, 276 5-persons, 53 6-persons, 22 7-or-more-persons
Size of nonfamily households: 1,743 1-person, 309 2-persons, 5 4-persons
3,069 married couples with children.
290 single-parent households (247 men, 43 women).
87.2% of residents of 07044 zip code speak English at home.
1.4% of residents speak Spanish at home (100% very well).
8.8% of residents speak other Indo-European language at home (88% very well, 8% well, 4% not well).
1.5% of residents speak Asian or Pacific Island language at home (88% very well, 1% well, 1% not well, 10% not at all).
1.0% of residents speak other language at home (50% very well, 41% well, 9% not at all).
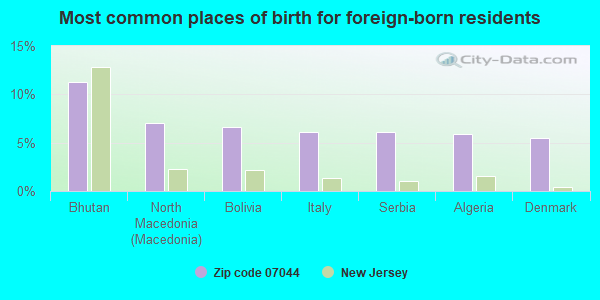
Foreign born population: 1,303 (9.0%) (80.5% of them are naturalized citizens)
This zip code:
9.0%
Whole state:
23.5%
11%Bhutan
7%North Macedonia (Macedonia)
7%Bolivia
6%Italy
6%Serbia
6%Algeria
5%Denmark
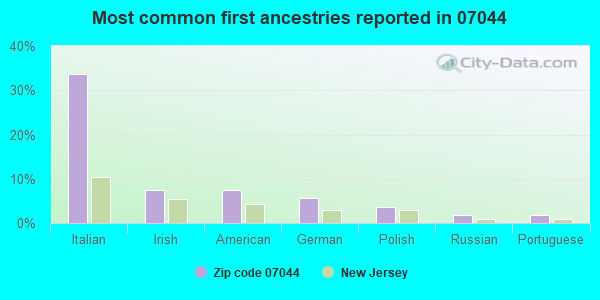
34%Italian
7%Irish
7%American
6%German
4%Polish
2%Russian
2%Portuguese
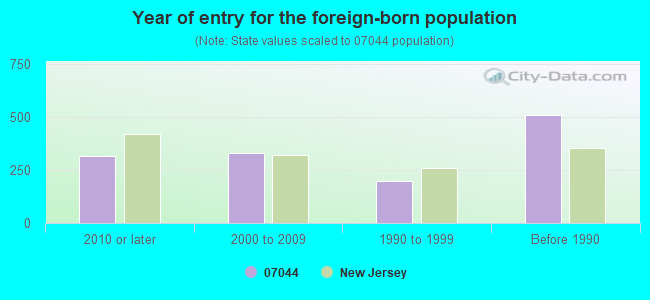
Year of entry for the foreign-born population
3172010 or later
3332000 to 2009
1981990 to 1999
511Before 1990
Facilities with environmental interests located in this zip code:
ESSEX CNTY DPW BUILDING (900 BLOOMFIELD AVE in VERONA, NJ)
STATE MASTER (New Jersey environmental info) - NJEMS-07002, LABORATORY CERTIFICATION, NJEMS-222982, National Pollutant Discharge Elimination System Permit STATE MASTER (New Jersey environmental info) - NJEMS-008230, STATE CLEANUP SITE, NJEMS-204888, REFUSE DISPOSAL, NJEMS-NL000602, PESTICIDES - APPLICATION National Pollutant Discharge Elimination System NON-MAJOR (Tracking pollutant discharge elimination systems) - permit Conditionally Exempt Small Quantity Generators, less than 100 kg/month of hazardous waste (Resource Conservation and Recovery Act (tracking hazardous waste)) - notification Organizations: ESSEX CNTY HALL OF RECORDS, ESSEX CNTY DEPT OF ROADS & BRIDGES, COUNTY OF ESSEX (CONTACT/OWNER)
, ESSEX CNTY UTILITIES AUTH (CONTACT/OWNER)
Alternative names: ESSEX COUNTY OF PUBLIC WORKS BLDG
EXXON SERVICE STATION #30115 (101 BLOOMFIELD AVE in VERONA, NJ)
STATE MASTER (New Jersey environmental info) - NJEMS-007787, STATE CLEANUP SITE, NJEMS-83647300000, EPCRA, NJEMS-A0872, AIR PROGRAM (Resource Conservation and Recovery Act (tracking hazardous waste)) Business SIC classification: GASOLINE SERVICE STATIONS Organizations: EXXON MOBIL CORP, EXXON MOBIL CORP C/O VEEDER-ROOT, EXXON MOBIL CORP USA (CONTACT/OWNER)
Alternative names: EXXON CO USA 30115
AMERICAN DRY CLEANERS (404 BLOOMFIELD AVE in VERONA, NJ)
STATE MASTER (New Jersey environmental info) - NJEMS-L0507, AIR PROGRAM (Resource Conservation and Recovery Act (tracking hazardous waste)) Business SIC classification: DRYCLEANING PLANTS, EXCEPT RUG CLEANING Organizations: AMERICAN FABRICARE CLEANERS Alternative names: AMERICAN CLEANERS
ALBERONA AUTO CLINIC (250 BLOOMFIELD AVE in VERONA, NJ)
STATE MASTER (New Jersey environmental info) - NJEMS-024873, STATE CLEANUP SITE, NJEMS-59809700000, EPCRA Conditionally Exempt Small Quantity Generators, less than 100 kg/month of hazardous waste (Resource Conservation and Recovery Act (tracking hazardous waste)) - notification Business SIC classification: GASOLINE SERVICE STATIONS Organizations: JOE DEFINIS (CONTACT/OWNER)
, DEFINIS JOSEPH (CONTACT/OWNER)
GEMMELLS CLEANERS INC (700 BLOOMFIELD AVENUE in VERONA, NJ)
STATE MASTER (New Jersey environmental info) - NJEMS-68849800000, EPCRA, NJEMS-L0589, AIR PROGRAM Conditionally Exempt Small Quantity Generators, less than 100 kg/month of hazardous waste (Resource Conservation and Recovery Act (tracking hazardous waste)) - notification Business SIC classification: DRYCLEANING PLANTS, EXCEPT RUG CLEANING Organizations: HHJ CLEANERS INC, JOHN CHUN H LEE (CONTACT/OWNER)
Alternative names: H H J CLEANERS
CLAIRIDGE HOUSE I CONDOMINIUMS (1 CLAIRIDGE DRIVE in VERONA, NJ)
CRITERIA AND HAZARDOUS AIR POLLUTANT INVENTORY (Inventory of air pollution sources) STATE MASTER (New Jersey environmental info) - NJEMS-003675, STATE CLEANUP SITE, NJEMS-05210, AIR PROGRAM, NJEMS-06749, Business SIC classification: OPERATORS OF APARTMENT BUILDINGS Organizations: CLARIDGE HOUSE I CONDOMINIUM ASSN Alternative names: CLAIRIDGE HOUSE I CONDOMINIUM A, CLARIDGE HOUSE II CONDOMINIUM
12 MOUNTAIN ROAD (12 MOUNTAIN RD in VERONA, NJ)
COMPLIANCE ACTIVITY (Tracking inspections of insecticide, fungicide, and rodenticide, and toxic substances) STATE MASTER (New Jersey environmental info) - NJEMS-G000043730, STATE CLEANUP SITE Alternative names: AMERICAN IRON & METAL CO
HENRY B WHITEHORNE MIDDLE (600 BLOOMFIELD AVE in VERONA, NJ)
(National Center for Education Statistics) - STATE ID-095 Organizations: VERONA BORO (SCHOOL DISTRICT)
ESSEX CO DEPT OF PUBLIC WORKS (ESSEX CO COURT HOUSE in NEWARK, NJ)
HAZARDOUS WASTE BIENNIAL REPORTER (Resource Conservation and Recovery Act (tracking hazardous waste)) Large Quantity Generators, more that 1000 kg of hazardous waste/month (Resource Conservation and Recovery Act (tracking hazardous waste))
ESSEX COUNTY OF - HILLTOP SITE (TURNING POINT - HILLTOP SITE in VERONA, NJ)
(Resource Conservation and Recovery Act (tracking hazardous waste))
Conditionally Exempt Small Quantity Generators, less than 100 kg/month of hazardous waste (Resource Conservation and Recovery Act (tracking hazardous waste)) - notification Organizations: KWANG HEE LEE (CONTACT/OWNER)
OUR LADY OF THE LAKE SCHOOL (32 LAKESIDE AVE in VERONA, NJ)
COMPLIANCE ACTIVITY (Tracking inspections of insecticide, fungicide, and rodenticide, and toxic substances)
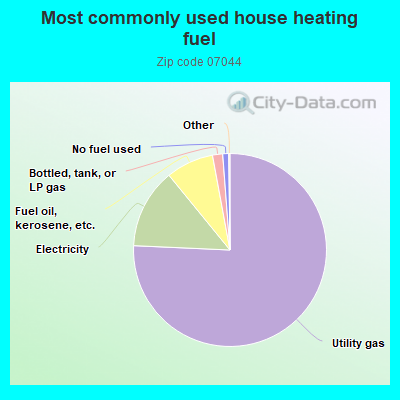
75.8%Utility gas
13.4%Electricity
8.0%Fuel oil, kerosene, etc.
1.7%Bottled, tank, or LP gas
1.0%No fuel used
Population in 1990: 13,583. Population change in the 1990s: +365 (+2.7%).
Place of birth for U.S.-born residents:
This state: 8,612
Northeast: 3,247
Midwest: 478
South: 518
West: 207
65% of the 07044 zip code residents lived in the same house 5 years ago. Out of people who lived in different houses, 58% lived in this county. Out of people who lived in different counties, 50% lived in New Jersey.
94% of the 07044 zip code residents lived in the same house 1 year ago. Out of people who lived in different houses, 46% moved from this county. Out of people who lived in different houses, 28% moved from different county within same state. Out of people who lived in different houses, 27% moved from different state.
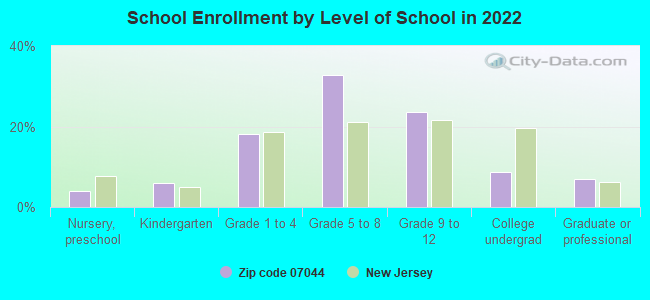
Private vs. public school enrollment:
Students in private schools in grades 1 to 8 (elementary and middle school): 237
Here:
14.2%
New Jersey:
12.3%
Students in private schools in grades 9 to 12 (high school): 49
Here:
6.3%
New Jersey:
13.1%
Students in private undergraduate colleges: 94
Here:
33.3%
New Jersey:
33.2%
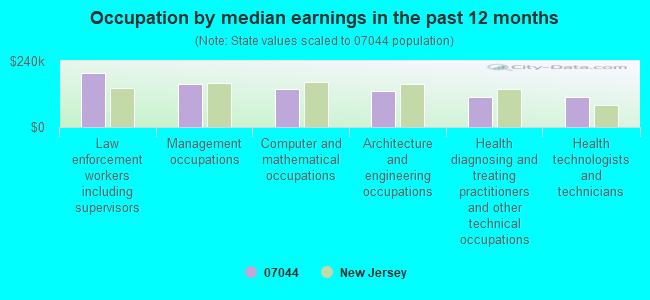
Occupation by median earnings in the past 12 months ($)
197,340Law enforcement workers including supervisors
156,395Management occupations
137,484Computer and mathematical occupations
130,118Architecture and engineering occupations
109,710Health diagnosing and treating practitioners and other technical occupations
109,681Health technologists and technicians
Companies with federal contracts located in this zip code:
ALMARC CO (133 FOREST AVE in VERONA, NJ; small business)
$24,300 with Navy for Miscellaneous Items. Signed on 2005-06-13. Completion date: 2005-07-15.
Top industries in this zip code by the number of employees in 2005:
Health Care and Social Assistance: Home Health Care Services (100-249 employees: 2 establishments, 50-99 employees: 1 establishment, 10-19 employees: 1 establishment, 1-4 employees: 2 establishments)
Administrative and Support and Waste Management and Remediation Services: Janitorial Services (250-499: 1, 20-49: 1, 1-4: 4)
Health Care and Social Assistance: Offices of Physicians (except Mental Health Specialists) (20-49: 4, 5-9: 4, 1-4: 8)
Other Services (except Public Administration): Parking Lots and Garages (100-249: 1)
Finance and Insurance: Insurance Agencies and Brokerages (20-49: 1, 10-19: 1, 5-9: 1, 1-4: 10)
People in group quarters in 2010:
187 people in workers' group living quarters and job corps centers
13 people in other noninstitutional facilities
6 people in group homes intended for adults
People in group quarters in 2000:
13 people in religious group quarters
Fatal accident statistics in 2012:
Fatal accident count: 1
Vehicles involved in fatal accidents: 1
Fatal accidents caused by drunken drivers: 0
Fatalities: 1
Persons involved in fatal accidents: 1
Pedestrians involved in fatal accidents: 1
Home Mortgage Disclosure Act Aggregated Statistics For Year 2009 (Based on 4 full and 4 partial tracts)
A) FHA, FSA/RHS & VA Home Purchase Loans
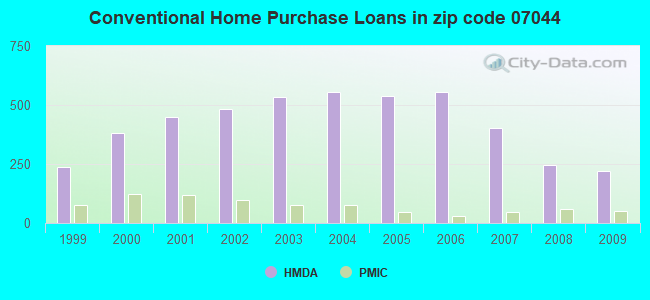
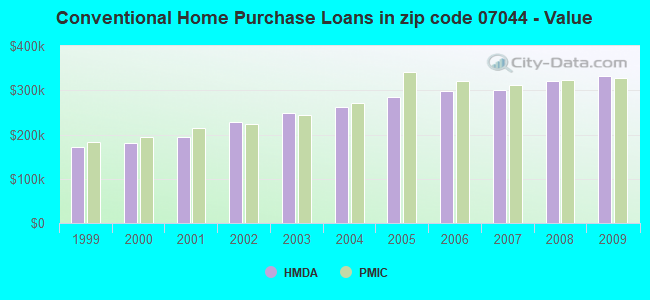
B) Conventional Home Purchase Loans
C) Refinancings
D) Home Improvement Loans
F) Non-occupant Loans on < 5 Family Dwellings (A B C & D)
Number
Average Value
Number
Average Value
Number
Average Value
Number
Average Value
Number
Average Value
LOANS ORIGINATED
77
$329,843
222
$332,235
884
$305,959
36
$221,757
29
$230,256
APPLICATIONS APPROVED, NOT ACCEPTED
4
$429,148
36
$363,511
63
$286,429
4
$113,802
8
$180,788
APPLICATIONS DENIED
7
$419,190
33
$372,312
275
$312,287
8
$112,968
6
$131,278
APPLICATIONS WITHDRAWN
3
$295,197
15
$367,574
153
$323,109
4
$398,345
0
$0
FILES CLOSED FOR INCOMPLETENESS
2
$741,665
13
$297,025
59
$284,433
0
$0
2
$318,015
Aggregated Statistics For Year 2008 (Based on 4 full and 4 partial tracts)
A) FHA, FSA/RHS & VA Home Purchase Loans
B) Conventional Home Purchase Loans
C) Refinancings
D) Home Improvement Loans
F) Non-occupant Loans on < 5 Family Dwellings (A B C & D)
Number
Average Value
Number
Average Value
Number
Average Value
Number
Average Value
Number
Average Value
LOANS ORIGINATED
22
$396,726
247
$320,959
389
$289,345
73
$119,093
16
$267,952
APPLICATIONS APPROVED, NOT ACCEPTED
0
$0
54
$355,516
75
$304,539
10
$70,370
6
$353,897
APPLICATIONS DENIED
0
$0
46
$388,540
169
$340,785
35
$130,463
12
$352,656
APPLICATIONS WITHDRAWN
4
$428,188
41
$394,894
84
$312,866
4
$239,698
3
$351,963
FILES CLOSED FOR INCOMPLETENESS
0
$0
2
$575,760
16
$352,518
2
$42,255
0
$0
Aggregated Statistics For Year 2007 (Based on 4 full and 4 partial tracts)
A) FHA, FSA/RHS & VA Home Purchase Loans
B) Conventional Home Purchase Loans
C) Refinancings
D) Home Improvement Loans
F) Non-occupant Loans on < 5 Family Dwellings (A B C & D)
G) Loans On Manufactured Home Dwelling (A B C & D)
Number
Average Value
Number
Average Value
Number
Average Value
Number
Average Value
Number
Average Value
Number
Average Value
LOANS ORIGINATED
4
$372,240
401
$299,515
512
$278,426
88
$103,544
45
$272,102
0
$0
APPLICATIONS APPROVED, NOT ACCEPTED
0
$0
39
$314,131
128
$197,863
30
$85,639
6
$134,483
0
$0
APPLICATIONS DENIED
0
$0
34
$305,029
223
$334,209
44
$101,373
8
$315,534
0
$0
APPLICATIONS WITHDRAWN
0
$0
50
$326,001
112
$271,531
11
$40,975
5
$330,528
4
$239,420
FILES CLOSED FOR INCOMPLETENESS
0
$0
6
$297,293
37
$381,825
2
$296,180
0
$0
0
$0
Aggregated Statistics For Year 2006 (Based on 4 full and 4 partial tracts)
A) FHA, FSA/RHS & VA Home Purchase Loans
B) Conventional Home Purchase Loans
C) Refinancings
D) Home Improvement Loans
E) Loans on Dwellings For 5+ Families
F) Non-occupant Loans on < 5 Family Dwellings (A B C & D)
Number
Average Value
Number
Average Value
Number
Average Value
Number
Average Value
Number
Average Value
Number
Average Value
LOANS ORIGINATED
4
$281,210
554
$298,636
536
$257,569
158
$99,292
0
$0
65
$272,380
APPLICATIONS APPROVED, NOT ACCEPTED
0
$0
56
$310,301
130
$240,161
24
$104,943
2
$1,048,110
12
$242,212
APPLICATIONS DENIED
0
$0
57
$230,330
207
$291,568
65
$139,632
2
$222,135
16
$251,556
APPLICATIONS WITHDRAWN
0
$0
58
$287,190
151
$302,129
14
$99,796
2
$998,200
13
$281,328
FILES CLOSED FOR INCOMPLETENESS
0
$0
16
$249,470
47
$358,751
4
$26,718
0
$0
12
$214,832
Aggregated Statistics For Year 2005 (Based on 4 full and 4 partial tracts)
B) Conventional Home Purchase Loans
C) Refinancings
D) Home Improvement Loans
E) Loans on Dwellings For 5+ Families
F) Non-occupant Loans on < 5 Family Dwellings (A B C & D)
Number
Average Value
Number
Average Value
Number
Average Value
Number
Average Value
Number
Average Value
LOANS ORIGINATED
538
$285,180
636
$258,424
128
$149,161
6
$1,044,930
78
$220,109
APPLICATIONS APPROVED, NOT ACCEPTED
50
$264,375
104
$206,907
16
$118,109
2
$978,235
3
$457,443
APPLICATIONS DENIED
83
$291,233
191
$293,651
63
$130,552
0
$0
18
$184,007
APPLICATIONS WITHDRAWN
54
$309,058
206
$248,942
22
$116,253
0
$0
7
$123,037
FILES CLOSED FOR INCOMPLETENESS
12
$276,886
25
$260,108
2
$50,535
0
$0
0
$0
Aggregated Statistics For Year 2004 (Based on 4 full and 4 partial tracts)
A) FHA, FSA/RHS & VA Home Purchase Loans
B) Conventional Home Purchase Loans
C) Refinancings
D) Home Improvement Loans
F) Non-occupant Loans on < 5 Family Dwellings (A B C & D)
G) Loans On Manufactured Home Dwelling (A B C & D)
Number
Average Value
Number
Average Value
Number
Average Value
Number
Average Value
Number
Average Value
Number
Average Value
LOANS ORIGINATED
1
$175,420
553
$261,858
663
$234,564
100
$90,550
59
$194,523
0
$0
APPLICATIONS APPROVED, NOT ACCEPTED
0
$0
66
$276,291
108
$187,834
22
$87,842
4
$135,695
0
$0
APPLICATIONS DENIED
0
$0
47
$320,343
149
$234,254
45
$49,873
6
$227,798
2
$69,875
APPLICATIONS WITHDRAWN
0
$0
42
$336,391
153
$205,644
18
$129,357
8
$153,928
2
$4,745
FILES CLOSED FOR INCOMPLETENESS
0
$0
18
$287,753
28
$246,075
4
$38,178
0
$0
0
$0
Aggregated Statistics For Year 2003 (Based on 4 full and 4 partial tracts)
A) FHA, FSA/RHS & VA Home Purchase Loans
B) Conventional Home Purchase Loans
C) Refinancings
D) Home Improvement Loans
E) Loans on Dwellings For 5+ Families
F) Non-occupant Loans on < 5 Family Dwellings (A B C & D)
Number
Average Value
Number
Average Value
Number
Average Value
Number
Average Value
Number
Average Value
Number
Average Value
LOANS ORIGINATED
6
$260,340
532
$247,931
2,198
$205,706
56
$84,778
5
$630,486
80
$193,989
APPLICATIONS APPROVED, NOT ACCEPTED
0
$0
55
$266,538
248
$188,106
25
$88,181
0
$0
16
$213,369
APPLICATIONS DENIED
0
$0
28
$245,940
312
$208,366
58
$86,292
0
$0
24
$224,395
APPLICATIONS WITHDRAWN
0
$0
62
$245,948
242
$209,902
31
$63,287
0
$0
12
$113,518
FILES CLOSED FOR INCOMPLETENESS
0
$0
4
$288,502
66
$207,667
12
$86,388
0
$0
8
$194,799
Aggregated Statistics For Year 2002 (Based on 4 full and 4 partial tracts)
A) FHA, FSA/RHS & VA Home Purchase Loans
B) Conventional Home Purchase Loans
C) Refinancings
D) Home Improvement Loans
E) Loans on Dwellings For 5+ Families
F) Non-occupant Loans on < 5 Family Dwellings (A B C & D)
Number
Average Value
Number
Average Value
Number
Average Value
Number
Average Value
Number
Average Value
Number
Average Value
LOANS ORIGINATED
2
$187,010
484
$227,200
1,415
$194,212
105
$56,632
6
$316,127
59
$179,089
APPLICATIONS APPROVED, NOT ACCEPTED
2
$100,760
54
$226,521
213
$159,884
50
$44,190
0
$0
6
$182,102
APPLICATIONS DENIED
0
$0
18
$281,584
242
$157,189
39
$33,868
0
$0
9
$164,813
APPLICATIONS WITHDRAWN
6
$121,198
43
$251,558
155
$180,515
19
$32,370
0
$0
2
$282,890
FILES CLOSED FOR INCOMPLETENESS
0
$0
15
$233,140
39
$231,315
4
$43,508
0
$0
4
$199,352
Aggregated Statistics For Year 2001 (Based on 4 full and 4 partial tracts)
A) FHA, FSA/RHS & VA Home Purchase Loans
B) Conventional Home Purchase Loans
C) Refinancings
D) Home Improvement Loans
E) Loans on Dwellings For 5+ Families
F) Non-occupant Loans on < 5 Family Dwellings (A B C & D)
Number
Average Value
Number
Average Value
Number
Average Value
Number
Average Value
Number
Average Value
Number
Average Value
LOANS ORIGINATED
17
$215,941
451
$194,297
821
$186,669
97
$53,049
2
$370,225
23
$159,347
APPLICATIONS APPROVED, NOT ACCEPTED
0
$0
41
$213,921
107
$149,453
41
$45,926
0
$0
0
$0
APPLICATIONS DENIED
2
$196,505
29
$143,462
187
$149,625
51
$33,677
0
$0
4
$145,022
APPLICATIONS WITHDRAWN
2
$217,995
30
$251,652
148
$130,619
27
$57,086
0
$0
6
$106,657
FILES CLOSED FOR INCOMPLETENESS
0
$0
9
$193,908
69
$184,783
7
$55,889
0
$0
2
$29,945
Aggregated Statistics For Year 2000 (Based on 4 full and 4 partial tracts)
A) FHA, FSA/RHS & VA Home Purchase Loans
B) Conventional Home Purchase Loans
C) Refinancings
D) Home Improvement Loans
E) Loans on Dwellings For 5+ Families
F) Non-occupant Loans on < 5 Family Dwellings (A B C & D)
Number
Average Value
Number
Average Value
Number
Average Value
Number
Average Value
Number
Average Value
Number
Average Value
LOANS ORIGINATED
12
$151,565
383
$180,412
193
$120,073
77
$39,559
0
$0
18
$133,477
APPLICATIONS APPROVED, NOT ACCEPTED
0
$0
40
$199,567
51
$102,873
43
$36,944
0
$0
0
$0
APPLICATIONS DENIED
6
$117,625
66
$143,743
90
$158,285
56
$33,309
2
$149,730
13
$112,495
APPLICATIONS WITHDRAWN
0
$0
30
$234,129
85
$111,762
23
$35,660
0
$0
4
$169,748
FILES CLOSED FOR INCOMPLETENESS
0
$0
11
$257,997
24
$200,003
2
$27,640
0
$0
0
$0
Aggregated Statistics For Year 1999 (Based on 2 full and 2 partial tracts)
A) FHA, FSA/RHS & VA Home Purchase Loans
B) Conventional Home Purchase Loans
C) Refinancings
D) Home Improvement Loans
E) Loans on Dwellings For 5+ Families
F) Non-occupant Loans on < 5 Family Dwellings (A B C & D)


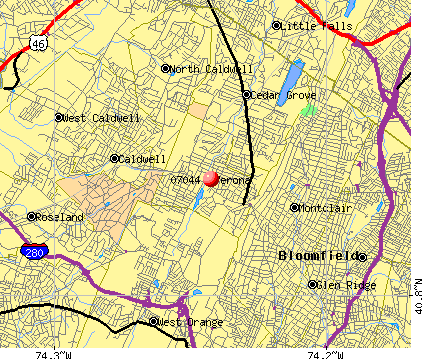 Nearest zip codes: 07009, 07042, 07021, 07006, 07043, 07028.