Estimated zip code population in 2022: 2,293 Zip code population in 2010: 2,091 Zip code population in 2000: 2,151
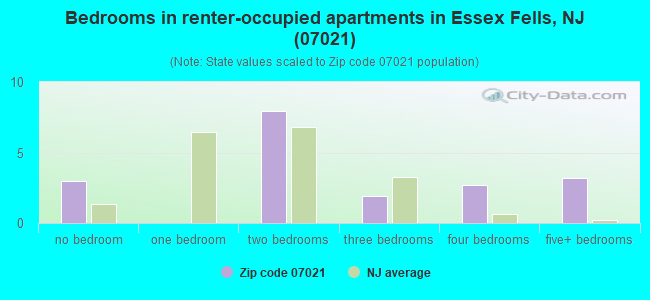
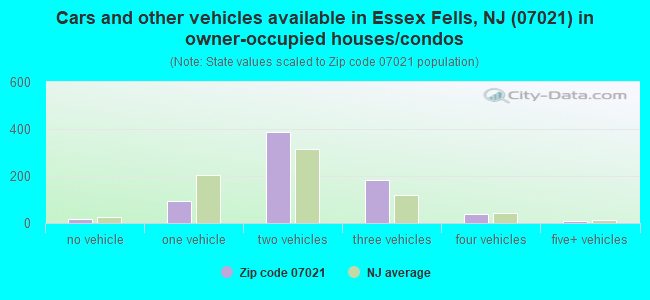
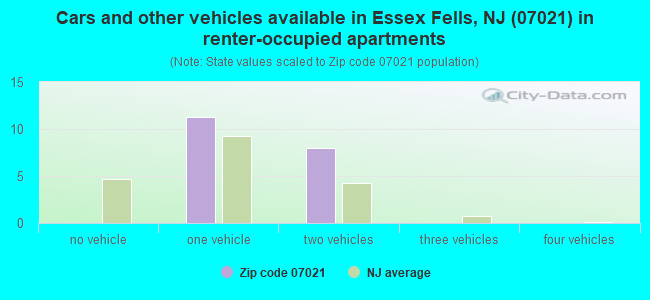
Houses and condos: 804 Renter-occupied apartments: 19
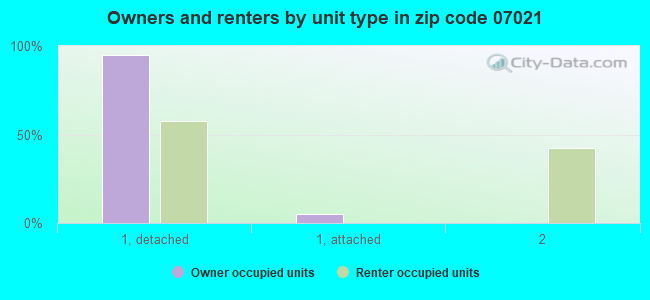
% of renters here:
3%
State:
35%
March 2022 cost of living index in zip code 07021: 118.6 (more than average, U.S. average is 100)
Land area: 1.4 sq. mi. Water area: 0.0 sq. mi.
Population density: 1,630 people per square mile
(low).
OSM Map
Google Map
MSN Map
OSM Map
General Map
Google Map
MSN Map
OSM Map
Google Map
MSN Map
OSM Map
Google Map
MSN Map
Please wait while loading the map...
Real estate property taxes paid for housing units in 2022:
This zip code:
0.9% ($9,521)
New Jersey:
2.1% ($8,897)
Median real estate property taxes paid for housing units with mortgages in 2022: $9,557 (0.9%) Median real estate property taxes paid for housing units with no mortgage in 2022: $9,483 (1.0%)
Business Search- 14 Million verified businesses
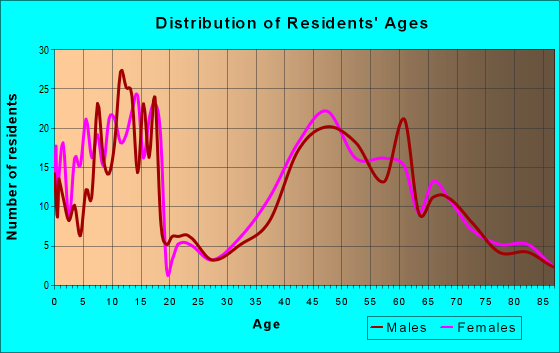
Males: 1,118
(48.8%)
Females: 1,175
(51.2%)
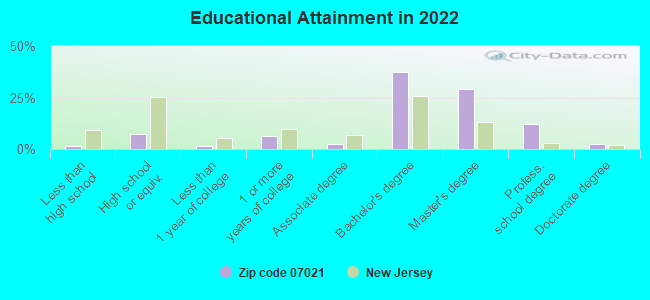
For population 25 years and over in 07021:
High school or higher: 100.4%
Bachelor's degree or higher: 82.5%
Graduate or professional degree: 44.6%
Unemployed: 3.7%
Mean travel time to work (commute): 31.2 minutes
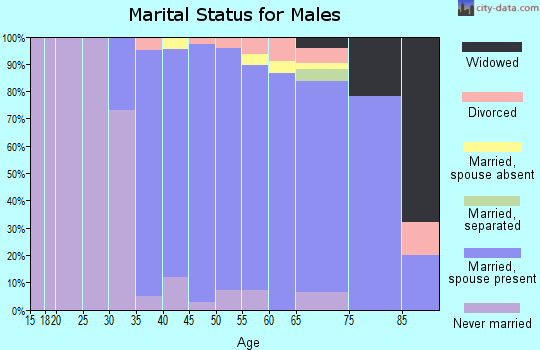
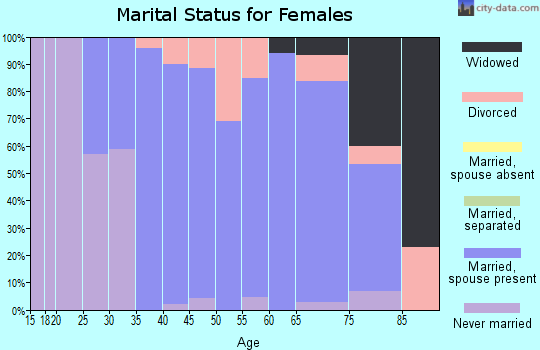
For population 15 years and over in 07021:
Never married: 16.7%
Now married: 75.3%
Separated: 0.0%
Widowed: 4.6%
Divorced: 3.5%
Zip code 07021 compared to state average:
Median household income significantly above state average.
Median house value significantly above state average.
Black race population percentage significantly below state average.
Median age above state average.
Foreign-born population percentage below state average.
Renting percentage significantly below state average.
Length of stay since moving in above state average.
Number of rooms per house significantly above state average.
Percentage of population with a bachelor's degree or higher above state average.
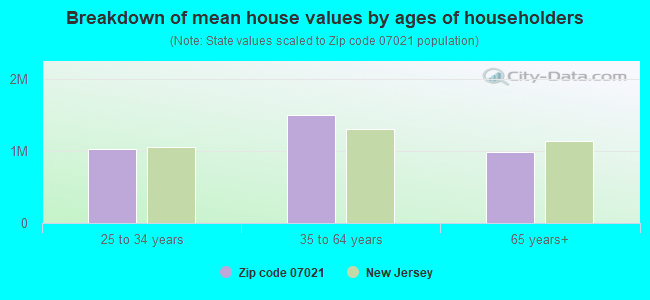
Estimated median house/condo value in 2022: $1,010,276
07021:
$1,010,276
New Jersey:
$428,900
Median resident age:
This zip code:
44.5 years
New Jersey median age:
40.4 years
Average household size:
This zip code:
3.1 people
New Jersey:
2.6 people
Averages for the 2020 tax year for zip code 07021, filed in 2021:
Average Adjusted Gross Income (AGI) in 2020: $399,942 (Individual Income Tax Returns)
Here:
$399,942
State:
$95,247
Salary/wage: $318,114 (reported on 77.6% of returns)
Here:
$318,114
State:
$80,635
(% of AGI for various income ranges: 1955.0% for AGIs below $25k, 4366.0% for AGIs $25k-50k, 6044.0% for AGIs $50k-75k, 9302.5% for AGIs $75k-100k, 20882.9% for AGIs $100k-200k, 239318.0% for AGIs over 200k)
Taxable interest for individuals: $5,997 (reported on 64.5% of returns)
This zip code:
$5,997
New Jersey:
$2,414
(% of AGI for various income ranges: 141.7% for AGIs below $25k, 30.0% for AGIs $25k-50k, 64.0% for AGIs $50k-75k, 140.0% for AGIs $75k-100k, 748.6% for AGIs $100k-200k, 3426.0% for AGIs over 200k)
Ordinary dividends: $19,984 (reported on 65.4% of returns)
Here:
$19,984
State:
$8,057
(% of AGI for various income ranges: 356.7% for AGIs below $25k, 216.0% for AGIs $25k-50k, 500.0% for AGIs $50k-75k, 1200.0% for AGIs $75k-100k, 2341.4% for AGIs $100k-200k, 11298.0% for AGIs over 200k)
Net capital gain/loss in AGI: +$52,502 (reported on 61.7% of returns)
Here:
+$52,502
State:
+$25,022
(% of AGI for various income ranges: 131.7% for AGIs below $25k, 202.0% for AGIs $25k-50k, 302.0% for AGIs $50k-75k, 410.0% for AGIs $75k-100k, 2762.9% for AGIs $100k-200k, 32222.0% for AGIs over 200k)
Profit/loss from business: +$70,429 (reported on 22.4% of returns)
Here:
+$70,429
State:
+$18,035
(% of AGI for various income ranges: 580.0% for AGIs below $25k, 1906.0% for AGIs $50k-75k, 2451.4% for AGIs $100k-200k, 13886.0% for AGIs over 200k)
Taxable individual retirement arrangement distribution: $43,183 (reported on 11.2% of returns)
07021:
$43,183
New Jersey:
$21,558
(% of AGI for various income ranges: 1392.0% for AGIs $50k-75k, 1708.6% for AGIs $100k-200k, 3290.0% for AGIs over 200k)
Self-employed (Keogh) retirement plans: $39,786 (reported on 6.5% of returns)
07021:
$39,786
New Jersey:
$30,844
(% of AGI for various income ranges: 2785.0% for AGIs over 200k)
Total itemized deductions: $49,344 (reported on 38.3% of returns)
Here:
$49,344
State:
$32,863
(% of AGI for various income ranges: 2348.0% for AGIs $25k-50k, 1940.0% for AGIs $75k-100k, 3575.7% for AGIs $100k-200k, 15778.0% for AGIs over 200k)
Charity contributions: $16,161 (reported on 35.5% of returns)
Here:
$16,161
State:
$7,880
(% of AGI for various income ranges: 178.0% for AGIs $50k-75k, 437.1% for AGIs $100k-200k, 5746.0% for AGIs over 200k)
Taxes paid: $9,776 (reported on 38.3% of returns)
07021:
$9,776
State:
$9,183
(% of AGI for various income ranges: 706.0% for AGIs $25k-50k, 462.5% for AGIs $75k-100k, 1050.0% for AGIs $100k-200k, 2735.0% for AGIs over 200k)
Percentage of individuals using paid preparers for their 2020 taxes: 94.4%
Here:
94%
State:
92%
(% for various income ranges: 95.0% for AGIs below $25k, 88.9% for AGIs $25k-50k, 87.5% for AGIs $50k-75k, 100.0% for AGIs $75k-100k, 94.4% for AGIs $100k-200k, 95.6% for AGIs over 200k)
Averages for the 2012 tax year for zip code 07021, filed in 2013:
Average Adjusted Gross Income (AGI) in 2012: $329,339 (Individual Income Tax Returns)
Here:
$329,339
State:
$79,688
Salary/wage: $229,165 (reported on 73.1% of returns)
Here:
$229,165
State:
$68,122
(% of AGI for various income ranges: 62.4% for AGIs below $25k, 66.4% for AGIs $25k-50k, 51.2% for AGIs $50k-75k, 50.0% for AGIs $75k-100k, 57.1% for AGIs $100k-200k, 50.1% for AGIs over 200k)
Taxable interest for individuals: $12,367 (reported on 67.6% of returns)
This zip code:
$12,367
New Jersey:
$2,193
(% of AGI for various income ranges: 4.8% for AGIs below $25k, 4.9% for AGIs $25k-50k, 1.5% for AGIs $50k-75k, 3.0% for AGIs $75k-100k, 2.2% for AGIs $100k-200k, 2.5% for AGIs over 200k)
Ordinary dividends: $21,799 (reported on 64.8% of returns)
Here:
$21,799
State:
$6,828
(% of AGI for various income ranges: 13.9% for AGIs below $25k, 6.6% for AGIs $25k-50k, 3.8% for AGIs $50k-75k, 5.6% for AGIs $75k-100k, 6.1% for AGIs $100k-200k, 4.0% for AGIs over 200k)
Net capital gain/loss in AGI: +$54,619 (reported on 57.4% of returns)
Here:
+$54,619
State:
+$15,358
(% of AGI for various income ranges: 1.1% for AGIs $75k-100k, 4.0% for AGIs $100k-200k, 10.5% for AGIs over 200k)
Profit/loss from business: +$78,050 (reported on 20.4% of returns)
Here:
+$78,050
State:
+$19,577
(% of AGI for various income ranges: 16.5% for AGIs below $25k, 15.5% for AGIs $50k-75k, 6.8% for AGIs $100k-200k, 4.5% for AGIs over 200k)
Taxable individual retirement arrangement distribution: $59,282 (reported on 15.7% of returns)
07021:
$59,282
New Jersey:
$18,214
(% of AGI for various income ranges: 8.3% for AGIs below $25k, 11.3% for AGIs $50k-75k, 6.1% for AGIs $100k-200k, 2.5% for AGIs over 200k)
Self-employment retirement plans: $37,500 (reported on 6.5% of returns)
07021:
$37,500
New Jersey:
$24,511
(% of AGI for various income ranges: 0.8% for AGIs over 200k)
Total itemized deductions: $98,150 (20% of AGI, reported on 66.7% of returns)
Here:
$98,150
State:
$30,827
Here:
20.4% of AGI
State:
21.2% of AGI
(% of AGI for various income ranges: 30.6% for AGIs below $25k, 26.9% for AGIs $25k-50k, 23.5% for AGIs $50k-75k, 35.4% for AGIs $75k-100k, 29.9% for AGIs $100k-200k, 18.6% for AGIs over 200k)
Charity contributions: $12,807 (reported on 62.0% of returns)
Here:
$12,807
State:
$3,451
(% of AGI for various income ranges: 2.6% for AGIs $25k-50k, 1.5% for AGIs $50k-75k, 1.9% for AGIs $75k-100k, 2.0% for AGIs $100k-200k, 2.5% for AGIs over 200k)
Taxes paid: $56,439 (reported on 66.7% of returns)
07021:
$56,439
State:
$15,801
(% of AGI for various income ranges: 10.6% for AGIs below $25k, 12.3% for AGIs $25k-50k, 10.6% for AGIs $50k-75k, 15.5% for AGIs $75k-100k, 13.4% for AGIs $100k-200k, 11.2% for AGIs over 200k)
Percentage of individuals using paid preparers for their 2012 taxes: 79.6%
Here:
80%
State:
65%
(% for various income ranges: 74.1% for AGIs below $25k, 60.0% for AGIs $25k-50k, 75.0% for AGIs $50k-75k, 66.7% for AGIs $75k-100k, 83.3% for AGIs $100k-200k, 89.7% for AGIs over 200k)
Averages for the 2004 tax year for zip code 07021, filed in 2005:
Average Adjusted Gross Income (AGI) in 2004: $315,627 (Individual Income Tax Returns)
Here:
$315,627
State:
$64,921
Salary/wage: $287,978 (reported on 66.3% of returns)
Here:
$287,978
State:
$57,755
(% of AGI for various income ranges: 41.9% for AGIs $10k-25k, 61.4% for AGIs $25k-50k, 45.6% for AGIs $50k-75k, 54.1% for AGIs $75k-100k, 60.3% for AGIs over 100k)
Taxable interest for individuals: $8,544 (reported on 80.1% of returns)
This zip code:
$8,544
New Jersey:
$2,068
(% of AGI for various income ranges: 10.5% for AGIs $10k-25k, 3.8% for AGIs $25k-50k, 4.4% for AGIs $50k-75k, 3.8% for AGIs $75k-100k, 2.0% for AGIs over 100k)
Taxable dividends: $17,492 (reported on 74.9% of returns)
Here:
$17,492
State:
$3,959
(% of AGI for various income ranges: 9.9% for AGIs $10k-25k, 8.1% for AGIs $25k-50k, 6.3% for AGIs $50k-75k, 5.6% for AGIs $75k-100k, 3.9% for AGIs over 100k)
Net capital gain/loss: +$41,210 (reported on 61.1% of returns)
Here:
+$41,210
State:
+$13,591
(% of AGI for various income ranges: 10.3% for AGIs $10k-25k, 3.7% for AGIs $25k-50k, 8.3% for AGIs $50k-75k, -0.2% for AGIs $75k-100k, 8.1% for AGIs over 100k)
Profit/loss from business: +$64,177 (reported on 18.0% of returns)
Here:
+$64,177
State:
+$17,520
(% of AGI for various income ranges: 11.1% for AGIs $10k-25k, 9.6% for AGIs $25k-50k, 11.6% for AGIs $50k-75k, 8.1% for AGIs $75k-100k, 3.3% for AGIs over 100k)
IRA payment deduction: $5,679 (reported on 2.5% of returns)
07021:
$5,679
New Jersey:
$3,270
Self-employed pension: $28,232 (reported on 6.3% of returns)
Here:
$28,232
New Jersey:
$17,258
Total itemized deductions: $74,547 (16% of AGI, reported on 65.5% of returns)
Here:
$74,547
State:
$23,924
Here:
15.7% of AGI
State:
21.1% of AGI
(% of AGI for various income ranges: 57.1% for AGIs $10k-25k, 26.7% for AGIs $25k-50k, 28.1% for AGIs $50k-75k, 31.0% for AGIs $75k-100k, 14.6% for AGIs over 100k)
Charity contributions deductions: $12,504 (3% of AGI, reported on 61.7% of returns)
Here:
$12,504
State:
$3,242
Here:
2.5% of AGI
State:
2.7% of AGI
(% of AGI for various income ranges: 3.6% for AGIs $10k-25k, 1.9% for AGIs $25k-50k, 3.1% for AGIs $50k-75k, 3.5% for AGIs $75k-100k, 2.4% for AGIs over 100k)
Total tax: $95,164 (reported on 83.3% of returns)
07021:
$95,164
State:
$12,321
(% of AGI for various income ranges: 6.4% for AGIs $10k-25k, 9.1% for AGIs $25k-50k, 10.9% for AGIs $50k-75k, 10.5% for AGIs $75k-100k, 25.7% for AGIs over 100k)
Earned income credit: $375 (reported on 1.5% of returns)
Here:
$375
State:
$1,711
Percentage of individuals using paid preparers for their 2004 taxes: 82.7%
Here:
83%
State:
65%
(% for various income ranges: 80.2% for AGIs below $10k, 73.3% for AGIs $10k-25k, 73.7% for AGIs $25k-50k, 80.5% for AGIs $50k-75k, 79.1% for AGIs $75k-100k, 87.8% for AGIs over 100k)
Likely homosexual households (counted as self-reported same-sex unmarried-partner households)
Lesbian couples: 0.0% of all households
Gay men: 0.4% of all households
Household received Food Stamps/SNAP in the past 12 months: 3 Household did not receive Food Stamps/SNAP in the past 12 months: 730
Women who had a birth in the past 12 months: 28 (29 now married, 0 unmarried) Women who did not have a birth in the past 12 months: 366 (239 now married, 125 unmarried)
Housing units in zip code 07021 with a mortgage: 492 (68 second mortgage, 65 both second mortgage and home equity loan) Houses without a mortgage: 35
Median monthly owner costs for units with a mortgage: $3,744 Median monthly owner costs for units without a mortgage: $1,425
Residents with income below the poverty level in 2022:
This zip code:
0.8%
Whole state:
9.7%
Residents with income below 50% of the poverty level in 2022:
This zip code:
0.6%
Whole state:
5.2%
Median number of rooms in houses and condos:
Here:
10.0
State:
6.8
Median number of rooms in apartments:
Here:
4.2
State:
3.9
Notable locations in this zip code not listed on our city pages
Size of family households: 248 2-persons, 110 3-persons, 178 4-persons, 65 5-persons, 13 6-persons, 8 7-or-more-persons
Size of nonfamily households: 92 1-person, 17 2-persons, 3 3-persons
650 married couples with children.
33 single-parent households (11 men, 22 women).
80.1% of residents of 07021 zip code speak English at home.
7.4% of residents speak Spanish at home (90% very well, 6% well, 5% not well).
8.6% of residents speak other Indo-European language at home (98% very well, 2% well).
3.4% of residents speak Asian or Pacific Island language at home (87% very well, 13% well).
0.1% of residents speak other language at home (100% very well).
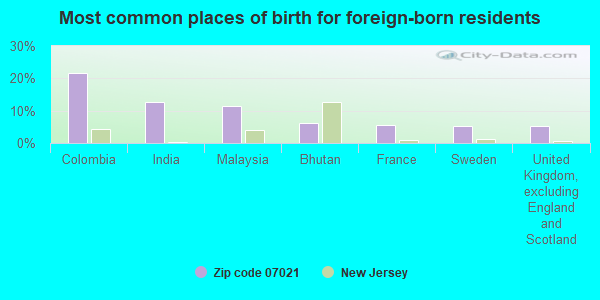
Foreign born population: 245 (10.7%) (93.0% of them are naturalized citizens)
This zip code:
10.7%
Whole state:
23.5%
22%Colombia
13%India
11%Malaysia
6%Bhutan
6%France
5%Sweden
5%United Kingdom, excluding England and Scotland
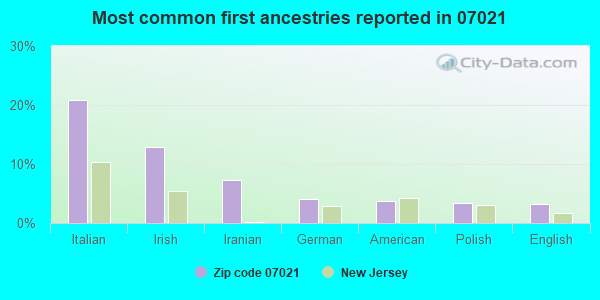
21%Italian
13%Irish
7%Iranian
4%German
4%American
3%Polish
3%English
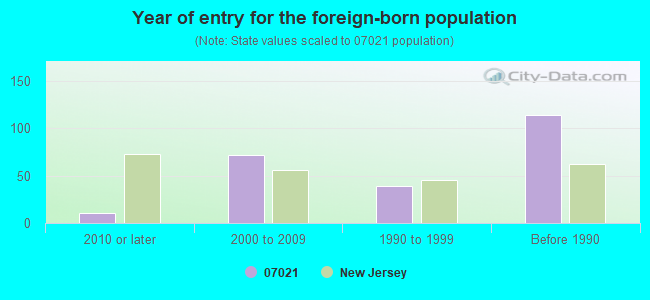
Year of entry for the foreign-born population
112010 or later
722000 to 2009
391990 to 1999
114Before 1990
Facilities with environmental interests located in this zip code:
STATE MASTER (New Jersey environmental info) - NJEMS-190668, National Pollutant Discharge Elimination System Permit STATE MASTER (New Jersey environmental info) - NJEMS-0706002, DRINKING WATER PROGRAM National Pollutant Discharge Elimination System NON-MAJOR (Tracking pollutant discharge elimination systems) - permit Alternative names: ESSEX FELLS BORO WATER HILLTOP SYSTEM
ESSEX FELLS BORO BD OF ED ELEMENTARY SCHOOL (102 HAWTHORNE RD in ESSEX FELLS BORO, NJ)
COMPLIANCE ACTIVITY (Tracking inspections of insecticide, fungicide, and rodenticide, and toxic substances) (National Center for Education Statistics) - STATE ID-050 STATE MASTER (New Jersey environmental info) - NJEMS-015063, STATE CLEANUP SITE Organizations: DIAL CORP (CONTACT/OWNER)
Alternative names: ESSEX FELLS BOARD OF ED
ESSEX FELLS COUNTRY CLUB (219 DEVON RD in ESSEX FELLS, NJ)
STATE MASTER (New Jersey environmental info) - NJEMS-020429, STATE CLEANUP SITE, NJEMS-10731W, DRINKING WATER PROGRAM (Resource Conservation and Recovery Act (tracking hazardous waste))
FINISHMASTER (569 PENNSYLVANIA AVE in ESSEX FELLS, NJ)
Conditionally Exempt Small Quantity Generators, less than 100 kg/month of hazardous waste (Resource Conservation and Recovery Act (tracking hazardous waste)) - notification Organizations: MILTON SUSSMAN (CONTACT/OWNER)
Housing units lacking complete kitchen facilities: 0.3%
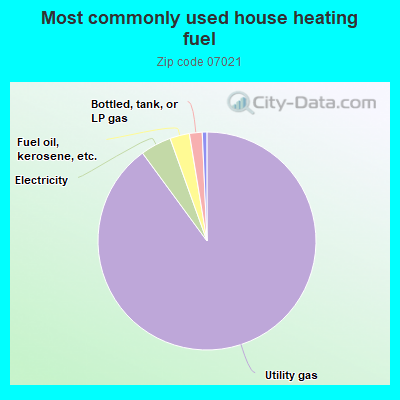
90.3%Utility gas
4.6%Electricity
2.9%Fuel oil, kerosene, etc.
1.9%Bottled, tank, or LP gas
0.7%Other fuel
Population in 1990: 2,102. Population change in the 1990s: +49 (+2.3%).
Place of birth for U.S.-born residents:
This state: 1,260
Northeast: 578
Midwest: 97
South: 64
West: 45
69% of the 07021 zip code residents lived in the same house 5 years ago. Out of people who lived in different houses, 64% lived in this county. Out of people who lived in different counties, 50% lived in New Jersey.
96% of the 07021 zip code residents lived in the same house 1 year ago. Out of people who lived in different houses, 50% moved from this county. Out of people who lived in different houses, 19% moved from different county within same state. Out of people who lived in different houses, 35% moved from different state.
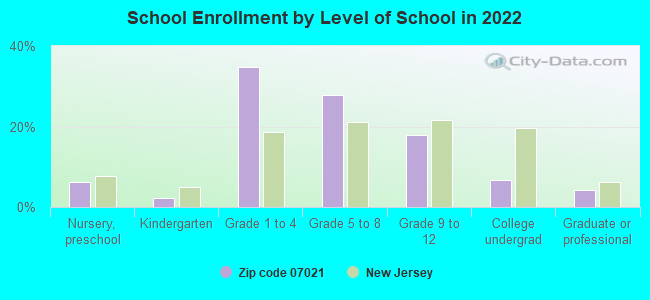
Private vs. public school enrollment:
Students in private schools in grades 1 to 8 (elementary and middle school): 50
Here:
10.9%
New Jersey:
12.3%
Students in private schools in grades 9 to 12 (high school): 35
Here:
26.8%
New Jersey:
13.1%
Students in private undergraduate colleges: 20
Here:
39.6%
New Jersey:
33.2%
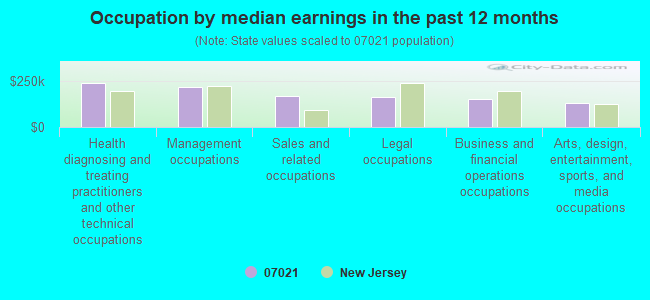
Occupation by median earnings in the past 12 months ($)
240,309Health diagnosing and treating practitioners and other technical occupations
218,953Management occupations
171,780Sales and related occupations
164,666Legal occupations
154,998Business and financial operations occupations
132,970Arts, design, entertainment, sports, and media occupations
Top industries in this zip code by the number of employees in 2005:
Arts, Entertainment, and Recreation: Golf Courses and Country Clubs (50-99 employees: 1 establishment)
Other Services (except Public Administration): Religious Organizations (10-19: 1, 5-9: 1)
Health Care and Social Assistance: Offices of Physicians (except Mental Health Specialists) (1-4: 5)
Construction: Residential Remodelers (5-9: 1)
Finance and Insurance: Commercial Banking (5-9: 1)
Wholesale Trade: Home Furnishing Merchant Wholesalers (5-9: 1)
Real Estate and Rental and Leasing: Other Activities Related to Real Estate (1-4: 2)
Home Mortgage Disclosure Act Aggregated Statistics For Year 2009 (Based on 2 partial tracts)
A) FHA, FSA/RHS & VA Home Purchase Loans
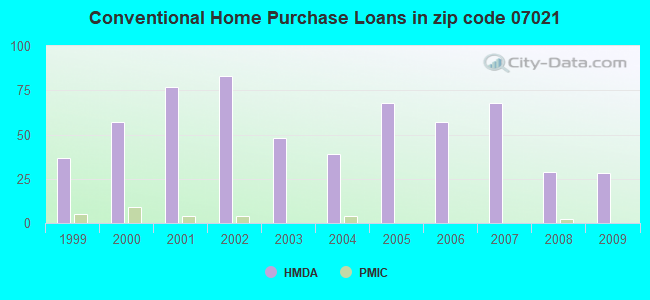
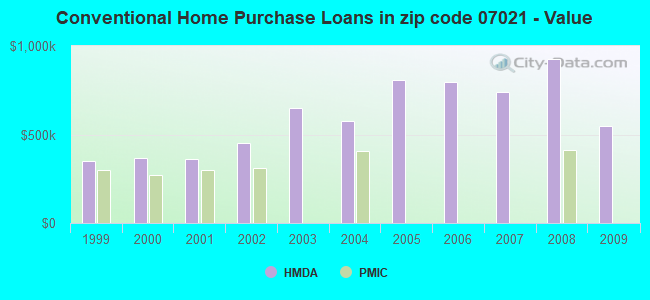
B) Conventional Home Purchase Loans
C) Refinancings
D) Home Improvement Loans
F) Non-occupant Loans on < 5 Family Dwellings (A B C & D)
Number
Average Value
Number
Average Value
Number
Average Value
Number
Average Value
Number
Average Value
LOANS ORIGINATED
4
$471,548
28
$549,144
141
$471,550
9
$388,543
2
$652,910
APPLICATIONS APPROVED, NOT ACCEPTED
0
$0
6
$575,468
9
$405,072
4
$619,852
0
$0
APPLICATIONS DENIED
0
$0
4
$688,725
22
$592,470
0
$0
2
$153,355
APPLICATIONS WITHDRAWN
0
$0
4
$460,988
18
$778,514
0
$0
0
$0
FILES CLOSED FOR INCOMPLETENESS
0
$0
0
$0
2
$459,150
0
$0
0
$0
Aggregated Statistics For Year 2008 (Based on 2 partial tracts)
A) FHA, FSA/RHS & VA Home Purchase Loans
B) Conventional Home Purchase Loans
C) Refinancings
D) Home Improvement Loans
F) Non-occupant Loans on < 5 Family Dwellings (A B C & D)
Number
Average Value
Number
Average Value
Number
Average Value
Number
Average Value
Number
Average Value
LOANS ORIGINATED
2
$520,675
29
$924,760
61
$461,408
4
$131,318
2
$37,650
APPLICATIONS APPROVED, NOT ACCEPTED
0
$0
7
$258,436
6
$235,392
2
$78,055
0
$0
APPLICATIONS DENIED
2
$513,330
4
$558,785
15
$544,735
0
$0
0
$0
APPLICATIONS WITHDRAWN
2
$663,015
2
$382,930
4
$292,938
2
$642,810
0
$0
FILES CLOSED FOR INCOMPLETENESS
0
$0
0
$0
0
$0
0
$0
0
$0
Aggregated Statistics For Year 2007 (Based on 2 partial tracts)
B) Conventional Home Purchase Loans
C) Refinancings
D) Home Improvement Loans
F) Non-occupant Loans on < 5 Family Dwellings (A B C & D)
Number
Average Value
Number
Average Value
Number
Average Value
Number
Average Value
LOANS ORIGINATED
68
$738,718
83
$589,615
11
$430,766
7
$492,733
APPLICATIONS APPROVED, NOT ACCEPTED
7
$704,204
9
$521,390
4
$140,040
0
$0
APPLICATIONS DENIED
13
$826,188
29
$696,641
4
$25,712
2
$525,270
APPLICATIONS WITHDRAWN
4
$677,248
2
$596,895
2
$8,265
0
$0
FILES CLOSED FOR INCOMPLETENESS
0
$0
6
$563,223
0
$0
0
$0
Aggregated Statistics For Year 2006 (Based on 2 partial tracts)
B) Conventional Home Purchase Loans
C) Refinancings
D) Home Improvement Loans
F) Non-occupant Loans on < 5 Family Dwellings (A B C & D)
Number
Average Value
Number
Average Value
Number
Average Value
Number
Average Value
LOANS ORIGINATED
57
$794,539
62
$552,431
15
$219,413
4
$252,992
APPLICATIONS APPROVED, NOT ACCEPTED
6
$440,783
6
$383,543
0
$0
0
$0
APPLICATIONS DENIED
4
$449,968
17
$640,325
2
$45,915
0
$0
APPLICATIONS WITHDRAWN
11
$766,530
7
$568,297
0
$0
0
$0
FILES CLOSED FOR INCOMPLETENESS
0
$0
9
$548,531
0
$0
0
$0
Aggregated Statistics For Year 2005 (Based on 2 partial tracts)
B) Conventional Home Purchase Loans
C) Refinancings
D) Home Improvement Loans
F) Non-occupant Loans on < 5 Family Dwellings (A B C & D)
Number
Average Value
Number
Average Value
Number
Average Value
Number
Average Value
LOANS ORIGINATED
68
$807,861
105
$531,809
11
$300,201
0
$0
APPLICATIONS APPROVED, NOT ACCEPTED
13
$1,292,118
17
$407,509
2
$688,725
0
$0
APPLICATIONS DENIED
15
$561,143
26
$487,547
9
$250,390
2
$252,535
APPLICATIONS WITHDRAWN
11
$1,093,779
11
$861,198
2
$688,725
0
$0
FILES CLOSED FOR INCOMPLETENESS
4
$547,765
2
$229,575
4
$798,002
0
$0
Aggregated Statistics For Year 2004 (Based on 2 partial tracts)
B) Conventional Home Purchase Loans
C) Refinancings
D) Home Improvement Loans
F) Non-occupant Loans on < 5 Family Dwellings (A B C & D)
Number
Average Value
Number
Average Value
Number
Average Value
Number
Average Value
LOANS ORIGINATED
39
$574,385
107
$442,621
22
$485,113
2
$826,470
APPLICATIONS APPROVED, NOT ACCEPTED
4
$505,065
29
$604,368
7
$285,984
0
$0
APPLICATIONS DENIED
0
$0
24
$379,794
4
$137,285
2
$293,855
APPLICATIONS WITHDRAWN
7
$716,011
15
$453,273
4
$128,562
2
$371,910
FILES CLOSED FOR INCOMPLETENESS
2
$918,300
6
$628,117
0
$0
0
$0
Aggregated Statistics For Year 2003 (Based on 2 partial tracts)
A) FHA, FSA/RHS & VA Home Purchase Loans
B) Conventional Home Purchase Loans
C) Refinancings
D) Home Improvement Loans
F) Non-occupant Loans on < 5 Family Dwellings (A B C & D)
Number
Average Value
Number
Average Value
Number
Average Value
Number
Average Value
Number
Average Value
LOANS ORIGINATED
0
$0
48
$650,539
386
$375,480
15
$148,642
2
$244,270
APPLICATIONS APPROVED, NOT ACCEPTED
0
$0
6
$424,867
44
$336,390
6
$193,762
0
$0
APPLICATIONS DENIED
0
$0
2
$675,870
46
$416,908
6
$33,672
0
$0
APPLICATIONS WITHDRAWN
2
$293,855
2
$399,460
24
$487,694
0
$0
0
$0
FILES CLOSED FOR INCOMPLETENESS
0
$0
2
$449,965
7
$387,784
0
$0
0
$0
Aggregated Statistics For Year 2002 (Based on 2 partial tracts)
B) Conventional Home Purchase Loans
C) Refinancings
D) Home Improvement Loans
F) Non-occupant Loans on < 5 Family Dwellings (A B C & D)
Number
Average Value
Number
Average Value
Number
Average Value
Number
Average Value
LOANS ORIGINATED
83
$454,326
270
$371,939
24
$124,582
4
$450,885
APPLICATIONS APPROVED, NOT ACCEPTED
17
$411,398
31
$358,018
6
$96,422
0
$0
APPLICATIONS DENIED
11
$312,389
29
$564,976
7
$58,247
0
$0
APPLICATIONS WITHDRAWN
7
$508,739
20
$345,556
0
$0
0
$0
FILES CLOSED FOR INCOMPLETENESS
6
$320,793
6
$594,140
0
$0
0
$0
Aggregated Statistics For Year 2001 (Based on 2 partial tracts)
B) Conventional Home Purchase Loans
C) Refinancings
D) Home Improvement Loans
F) Non-occupant Loans on < 5 Family Dwellings (A B C & D)
Number
Average Value
Number
Average Value
Number
Average Value
Number
Average Value
LOANS ORIGINATED
77
$361,405
127
$416,662
13
$79,822
4
$186,875
APPLICATIONS APPROVED, NOT ACCEPTED
11
$405,221
9
$292,836
2
$110,195
2
$459,150
APPLICATIONS DENIED
4
$399,460
29
$269,473
6
$44,385
0
$0
APPLICATIONS WITHDRAWN
7
$518,709
18
$262,328
2
$91,830
0
$0
FILES CLOSED FOR INCOMPLETENESS
0
$0
2
$110,195
0
$0
0
$0
Aggregated Statistics For Year 2000 (Based on 2 partial tracts)
A) FHA, FSA/RHS & VA Home Purchase Loans
B) Conventional Home Purchase Loans
C) Refinancings
D) Home Improvement Loans
F) Non-occupant Loans on < 5 Family Dwellings (A B C & D)
Number
Average Value
Number
Average Value
Number
Average Value
Number
Average Value
Number
Average Value
LOANS ORIGINATED
0
$0
57
$368,899
33
$256,234
17
$31,654
0
$0
APPLICATIONS APPROVED, NOT ACCEPTED
0
$0
7
$386,211
2
$91,830
0
$0
0
$0
APPLICATIONS DENIED
2
$183,660
11
$375,835
13
$221,522
4
$207,995
0
$0
APPLICATIONS WITHDRAWN
0
$0
6
$341,302
13
$297,388
2
$183,660
0
$0
FILES CLOSED FOR INCOMPLETENESS
0
$0
0
$0
6
$336,710
0
$0
2
$113,870
Aggregated Statistics For Year 1999 (Based on 1 partial tract)
B) Conventional Home Purchase Loans
C) Refinancings
D) Home Improvement Loans
F) Non-occupant Loans on < 5 Family Dwellings (A B C & D)
Detailed PMIC statistics for the following Tracts:0209.01
2005 - 2018 National Fire Incident Reporting System (NFIRS) incidents
Based on the data from the years 2005 - 2018 the average number of fire incidents per year is 7. The highest number of reported fires - 12 took place in 2005, and the least - 2 in 2012. The data has a declining trend.
When looking into fire subcategories, the most incidents belonged to: Structure Fires (77.0%), and Outside Fires (17.0%).
Fire incident types reported to NFIRS in Zip Code 07021


 Nearest zip codes: 07006, 07044, 07068, 07052, 07009, 07042.


 Based on the data from the years 2005 - 2018 the average number of fire incidents per year is 7. The highest number of reported fires - 12 took place in 2005, and the least - 2 in 2012. The data has a declining trend.
 When looking into fire subcategories, the most incidents belonged to: Structure Fires (77.0%), and Outside Fires (17.0%).