Races in Abilene, Texas (TX) Detailed Stats
Data:
Races - White alone (%)
Races - White alone (% change since 2000)
Races - Black alone (%)
Races - Black alone (% change since 2000)
Races - American Indian alone (%)
Races - American Indian alone (% change since 2000)
Races - Asian alone (%)
Races - Asian alone (% change since 2000)
Races - Hispanic (%)
Races - Hispanic (% change since 2000)
Races - Native Hawaiian and Other Pacific Islander alone (%)
Races - Native Hawaiian and Other Pacific Islander alone (% change since 2000)
Races - Two or more races(%)
Races - Two or more races(% change since 2000)
Races - Other race alone (%)
Races - Other race alone (% change since 2000)
Racial diversity
Place of birth - Born in state of residence (%)
Place of birth - Born in state of residence (%) - White
Place of birth - Born in state of residence (%) - Black or African American
Place of birth - Born in state of residence (%) - Asian
Place of birth - Born in state of residence (%) - Hispanic or Latino
Place of birth - Born in state of residence (%) - American Indian and Alaska Native
Place of birth - Born in state of residence (%) - Multirace
Place of birth - Born in state of residence (%) - Other Race
Place of birth - Born in other state (%)
Place of birth - Born in other state (%) - White
Place of birth - Born in other state (%) - Black or African American
Place of birth - Born in other state (%) - Asian
Place of birth - Born in other state (%) - Hispanic or Latino
Place of birth - Born in other state (%) - American Indian and Alaska Native
Place of birth - Born in other state (%) - Multirace
Place of birth - Born in other state (%) - Other Race
Place of birth - Native, outside of US (%)
Place of birth - Native, outside of US (%) - White
Place of birth - Native, outside of US (%) - Black or African American
Place of birth - Native, outside of US (%) - Asian
Place of birth - Native, outside of US (%) - Hispanic or Latino
Place of birth - Native, outside of US (%) - American Indian and Alaska Native
Place of birth - Native, outside of US (%) - Multirace
Place of birth - Native, outside of US (%) - Other Race
Place of birth - Foreign born (%)
Place of birth - Foreign born (%) - White
Place of birth - Foreign born (%) - Black or African American
Place of birth - Foreign born (%) - Asian
Place of birth - Foreign born (%) - Hispanic or Latino
Place of birth - Foreign born (%) - American Indian and Alaska Native
Place of birth - Foreign born (%) - Multirace
Place of birth - Foreign born (%) - Other Race
Residents speaking English at home (%)
Residents speaking English at home - Born in the United States (%)
Residents speaking English at home - Native, born elsewhere (%)
Residents speaking English at home - Foreign born (%)
Residents speaking Spanish at home (%)
Residents speaking Spanish at home - Born in the United States (%)
Residents speaking Spanish at home - Native, born elsewhere (%)
Residents speaking Spanish at home - Foreign born (%)
Residents speaking other language at home (%)
Residents speaking other language at home - Born in the United States (%)
Residents speaking other language at home - Native, born elsewhere (%)
Residents speaking other language at home - Foreign born (%)
Marital status - Never married (%)
Marital status - Now married (%)
Marital status - Separated (%)
Marital status - Widowed (%)
Marital status - Divorced (%)
Ancestries Reported - Arab (%)
Ancestries Reported - Czech (%)
Ancestries Reported - Danish (%)
Ancestries Reported - Dutch (%)
Ancestries Reported - English (%)
Ancestries Reported - French (%)
Ancestries Reported - French Canadian (%)
Ancestries Reported - German (%)
Ancestries Reported - Greek (%)
Ancestries Reported - Hungarian (%)
Ancestries Reported - Irish (%)
Ancestries Reported - Italian (%)
Ancestries Reported - Lithuanian (%)
Ancestries Reported - Norwegian (%)
Ancestries Reported - Polish (%)
Ancestries Reported - Portuguese (%)
Ancestries Reported - Russian (%)
Ancestries Reported - Scotch-Irish (%)
Ancestries Reported - Scottish (%)
Ancestries Reported - Slovak (%)
Ancestries Reported - Subsaharan African (%)
Ancestries Reported - Swedish (%)
Ancestries Reported - Swiss (%)
Ancestries Reported - Ukrainian (%)
Ancestries Reported - United States (%)
Ancestries Reported - Welsh (%)
Ancestries Reported - West Indian (%)
Ancestries Reported - Other (%)
Geographical mobility - Same house 1 year ago (%)
Geographical mobility - Same house 1 year ago (%) - White
Geographical mobility - Same house 1 year ago (%) - Black or African American
Geographical mobility - Same house 1 year ago (%) - Asian
Geographical mobility - Same house 1 year ago (%) - Hispanic or Latino
Geographical mobility - Same house 1 year ago (%) - American Indian and Alaska Native
Geographical mobility - Same house 1 year ago (%) - Multirace
Geographical mobility - Same house 1 year ago (%) - Other Race
Geographical mobility - Moved within same county (%)
Geographical mobility - Moved within same county (%) - White
Geographical mobility - Moved within same county (%) - Black or African American
Geographical mobility - Moved within same county (%) - Asian
Geographical mobility - Moved within same county (%) - Hispanic or Latino
Geographical mobility - Moved within same county (%) - American Indian and Alaska Native
Geographical mobility - Moved within same county (%) - Multirace
Geographical mobility - Moved within same county (%) - Other Race
Geographical mobility - Moved from different county within same state (%)
Geographical mobility - Moved from different county within same state (%) - White
Geographical mobility - Moved from different county within same state (%) - Black or African American
Geographical mobility - Moved from different county within same state (%) - Asian
Geographical mobility - Moved from different county within same state (%) - Hispanic or Latino
Geographical mobility - Moved from different county within same state (%) - American Indian and Alaska Native
Geographical mobility - Moved from different county within same state (%) - Multirace
Geographical mobility - Moved from different county within same state (%) - Other Race
Geographical mobility - Moved from different state (%)
Geographical mobility - Moved from different state (%) - White
Geographical mobility - Moved from different state (%) - Black or African American
Geographical mobility - Moved from different state (%) - Asian
Geographical mobility - Moved from different state (%) - Hispanic or Latino
Geographical mobility - Moved from different state (%) - American Indian and Alaska Native
Geographical mobility - Moved from different state (%) - Multirace
Geographical mobility - Moved from different state (%) - Other Race
Geographical mobility - Moved from abroad (%)
Geographical mobility - Moved from abroad (%) - White
Geographical mobility - Moved from abroad (%) - Black or African American
Geographical mobility - Moved from abroad (%) - Asian
Geographical mobility - Moved from abroad (%) - Hispanic or Latino
Geographical mobility - Moved from abroad (%) - American Indian and Alaska Native
Geographical mobility - Moved from abroad (%) - Multirace
Geographical mobility - Moved from abroad (%) - Other Race
Place of birth for the foreign-born population - Ireland (%)
Place of birth for the foreign-born population - Denmark (%)
Place of birth for the foreign-born population - Norway (%)
Place of birth for the foreign-born population - Sweden (%)
Place of birth for the foreign-born population - United Kingdom (%)
Place of birth for the foreign-born population - England (%)
Place of birth for the foreign-born population - Scotland (%)
Place of birth for the foreign-born population - Other Northern Europe (%)
Place of birth for the foreign-born population - Austria (%)
Place of birth for the foreign-born population - Belgium (%)
Place of birth for the foreign-born population - France (%)
Place of birth for the foreign-born population - Germany (%)
Place of birth for the foreign-born population - Netherlands (%)
Place of birth for the foreign-born population - Switzerland (%)
Place of birth for the foreign-born population - Other Western Europe (%)
Place of birth for the foreign-born population - Greece (%)
Place of birth for the foreign-born population - Italy (%)
Place of birth for the foreign-born population - Portugal (%)
Place of birth for the foreign-born population - Spain (%)
Place of birth for the foreign-born population - Other Southern Europe (%)
Place of birth for the foreign-born population - Albania (%)
Place of birth for the foreign-born population - Belarus (%)
Place of birth for the foreign-born population - Bosnia and Herzegovina (%)
Place of birth for the foreign-born population - Bulgaria (%)
Place of birth for the foreign-born population - Croatia (%)
Place of birth for the foreign-born population - Czechoslovakia (%)
Place of birth for the foreign-born population - Hungary (%)
Place of birth for the foreign-born population - Latvia (%)
Place of birth for the foreign-born population - Lithuania (%)
Place of birth for the foreign-born population - North Macedonia (Macedonia) (%)
Place of birth for the foreign-born population - Moldova (%)
Place of birth for the foreign-born population - Poland (%)
Place of birth for the foreign-born population - Romania (%)
Place of birth for the foreign-born population - Russia (%)
Place of birth for the foreign-born population - Serbia (%)
Place of birth for the foreign-born population - Ukraine (%)
Place of birth for the foreign-born population - Other Eastern Europe (%)
Place of birth for the foreign-born population - China (%)
Place of birth for the foreign-born population - Hong Kong (%)
Place of birth for the foreign-born population - Taiwan (%)
Place of birth for the foreign-born population - Japan (%)
Place of birth for the foreign-born population - Korea (%)
Place of birth for the foreign-born population - Other Eastern Asia (%)
Place of birth for the foreign-born population - Afghanistan (%)
Place of birth for the foreign-born population - Bangladesh (%)
Place of birth for the foreign-born population - India (%)
Place of birth for the foreign-born population - Iran (%)
Place of birth for the foreign-born population - Kazakhstan (%)
Place of birth for the foreign-born population - Nepal (%)
Place of birth for the foreign-born population - Pakistan (%)
Place of birth for the foreign-born population - Sri Lanka (%)
Place of birth for the foreign-born population - Uzbekistan (%)
Place of birth for the foreign-born population - Other South Central Asia (%)
Place of birth for the foreign-born population - Burma (%)
Place of birth for the foreign-born population - Cambodia (%)
Place of birth for the foreign-born population - Indonesia (%)
Place of birth for the foreign-born population - Laos (%)
Place of birth for the foreign-born population - Malaysia (%)
Place of birth for the foreign-born population - Philippines (%)
Place of birth for the foreign-born population - Singapore (%)
Place of birth for the foreign-born population - Thailand (%)
Place of birth for the foreign-born population - Vietnam (%)
Place of birth for the foreign-born population - Other South Eastern Asia (%)
Place of birth for the foreign-born population - Armenia (%)
Place of birth for the foreign-born population - Iraq (%)
Place of birth for the foreign-born population - Israel (%)
Place of birth for the foreign-born population - Jordan (%)
Place of birth for the foreign-born population - Kuwait (%)
Place of birth for the foreign-born population - Lebanon (%)
Place of birth for the foreign-born population - Saudi Arabia (%)
Place of birth for the foreign-born population - Syria (%)
Place of birth for the foreign-born population - Turkey (%)
Place of birth for the foreign-born population - Yemen (%)
Place of birth for the foreign-born population - Other Western Asia (%)
Place of birth for the foreign-born population - Eritrea (%)
Place of birth for the foreign-born population - Ethiopia (%)
Place of birth for the foreign-born population - Kenya (%)
Place of birth for the foreign-born population - Somalia (%)
Place of birth for the foreign-born population - Uganda (%)
Place of birth for the foreign-born population - Zimbabwe (%)
Place of birth for the foreign-born population - Other Eastern Africa (%)
Place of birth for the foreign-born population - Cameroon (%)
Place of birth for the foreign-born population - Congo (%)
Place of birth for the foreign-born population - Democratic Republic of Congo (Zaire) (%)
Place of birth for the foreign-born population - Other Middle Africa (%)
Place of birth for the foreign-born population - Egypt (%)
Place of birth for the foreign-born population - Morocco (%)
Place of birth for the foreign-born population - Sudan (%)
Place of birth for the foreign-born population - Other Northern Africa (%)
Place of birth for the foreign-born population - South Africa (%)
Place of birth for the foreign-born population - Other Southern Africa (%)
Place of birth for the foreign-born population - Cabo Verde (%)
Place of birth for the foreign-born population - Ghana (%)
Place of birth for the foreign-born population - Liberia (%)
Place of birth for the foreign-born population - Nigeria (%)
Place of birth for the foreign-born population - Senegal (%)
Place of birth for the foreign-born population - Sierra Leone (%)
Place of birth for the foreign-born population - Other Western Africa (%)
Place of birth for the foreign-born population - Australia (%)
Place of birth for the foreign-born population - New Zealand (%)
Place of birth for the foreign-born population - Fiji (%)
Place of birth for the foreign-born population - Micronesia (%)
Place of birth for the foreign-born population - Bahamas (%)
Place of birth for the foreign-born population - Barbados (%)
Place of birth for the foreign-born population - Cuba (%)
Place of birth for the foreign-born population - Dominica (%)
Place of birth for the foreign-born population - Dominican Republic (%)
Place of birth for the foreign-born population - Grenada (%)
Place of birth for the foreign-born population - Haiti (%)
Place of birth for the foreign-born population - Jamaica (%)
Place of birth for the foreign-born population - St. Vincent and the Grenadines (%)
Place of birth for the foreign-born population - Trinidad and Tobago (%)
Place of birth for the foreign-born population - West Indies (%)
Place of birth for the foreign-born population - Other Caribbean (%)
Place of birth for the foreign-born population - Belize (%)
Place of birth for the foreign-born population - Costa Rica (%)
Place of birth for the foreign-born population - El Salvador (%)
Place of birth for the foreign-born population - Guatemala (%)
Place of birth for the foreign-born population - Honduras (%)
Place of birth for the foreign-born population - Mexico (%)
Place of birth for the foreign-born population - Nicaragua (%)
Place of birth for the foreign-born population - Panama (%)
Place of birth for the foreign-born population - Other Central America (%)
Place of birth for the foreign-born population - Argentina (%)
Place of birth for the foreign-born population - Bolivia (%)
Place of birth for the foreign-born population - Brazil (%)
Place of birth for the foreign-born population - Chile (%)
Place of birth for the foreign-born population - Colombia (%)
Place of birth for the foreign-born population - Ecuador (%)
Place of birth for the foreign-born population - Guyana (%)
Place of birth for the foreign-born population - Peru (%)
Place of birth for the foreign-born population - Uruguay (%)
Place of birth for the foreign-born population - Venezuela (%)
Place of birth for the foreign-born population - Other South America (%)
Place of birth for the foreign-born population - Canada (%)
Place of birth for the foreign-born population - Other Northern America (%)
Place of birth for the foreign-born population - Other (%)
Latest news about races in Abilene, TX collected exclusively by city-data.com from local newspapers, TV, and radio stations
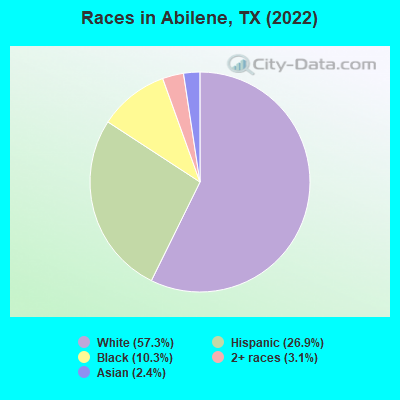
According to 2022 data, the most numerous races in Abilene, TX are Hispanic (34,438 residents), White alone (73,408 residents), and Black alone (13,190 residents). 83.6% of Abilene residents speak English at home. 7.7% of Abilene, TX residents are foreign-born (3.8% born in Latin America, 1.5% born in Asia, 1.2% born in Africa), which is 121.7% less than the foreign-born rate of 17.0% across the entire state of Texas.
Race distribution in Abilene
2000 2022
79,712 68.8% White alone 22,548 19.4% Hispanic 9,947 8.6% Black alone 1,645 1.4% Two or more races 1,492 1.3% Asian alone 428 0.4% American Indian alone 95 0.08% Other race alone 63 0.05% Native Hawaiian and Other
73,408 57.3% White alone 34,438 26.9% Hispanic 13,190 10.3% Black alone 3,938 3.1% Two or more races 3,022 2.4% Asian alone 114 0.09% American Indian alone 23 0.02% Other race alone 16 0.01% Native Hawaiian and Other
2000 2022
10,933,313 52.4% White alone 6,669,666 32.0% Hispanic 2,364,255 11.3% Black alone 554,445 2.7% Asian alone 230,567 1.1% Two or more races 68,859 0.3% American Indian alone 19,958 0.10% Other race alone 10,757 0.05% Native Hawaiian and Other
12,070,642 40.2% Hispanic 11,683,430 38.9% White alone 3,508,706 11.7% Black alone 1,608,173 5.4% Asian alone 956,560 3.2% Two or more races 125,763 0.4% Other race alone 47,023 0.2% American Indian alone 29,275 0.10% Native Hawaiian and Other
Income and house value in Abilene Median household income in 2022 $66,923 White non-Hispanic householders$39,258 Black householders$61,916 American Indian and Alaska Native householders$71,500 Asian householders$37,184 Some other race householders$48,242 Two or more races householders$53,693 Hispanic or Latino race householdersMedian 2022 house value $207,059 White Non-Hispanic householders$119,067 Black or African American householders$165,832 American Indian or Alaska Native householders $259,055 Asian householders$346,125 Native Hawaiian and other Pacific Islander householders$96,915 Some other race householders$105,837 Two or more races householders$100,299 Hispanic or Latino householders
Median age by race in Abilene
35.2 Median age for White residents33.9 36.2 30.9 Median age for Black or African American residents33.9 30.5 25.0 Median age for American Indian / Alaska Native residents22.0 44.1 28.2 Median age for Asian residents23.9 42.3 -666,666,666.0 Median age for Native Hawaiian / Pacific Islander residents-666,666,666.0 -666,666,666.0 28.1 Median age for Other race residents30.2 24.0 28.2 Median age for Two or more races residents28.1 28.9 36.1 Median age for White alone residents34.6 37.5 26.5 Median age for Hispanic or Latino residents26.9 25.8
Owner/renter occupied households by race in Abilene
House owners and renters - White residents 18,444 58.8% Owner occupied12,935 41.2% Renter occupiedHouse owners and renters - Black or African American residents 2,145 42.4% Owner occupied2,911 57.6% Renter occupiedHouse owners and renters - American Indian / Alaska Native residents 90 69.5% Owner occupied40 30.5% Renter occupiedHouse owners and renters - Asian residents 446 54.3% Owner occupied376 45.7% Renter occupiedHouse owners and renters - Other race residents 726 54.8% Owner occupied598 45.2% Renter occupiedHouse owners and renters - Two or more races residents 3,235 45.1% Owner occupied3,932 54.9% Renter occupiedHouse owners and renters - White alone residents 17,539 59.9% Owner occupied11,729 40.1% Renter occupiedHouse owners and renters - Hispanic or Latino residents 4,649 47.1% Owner occupied5,215 52.9% Renter occupied
Language usage in Abilene
English speakers - Total 83.6% of residents of Abilene speak English at home.
13.8% of residents speak Spanish at home 12,089 73.7% Speak English very well4,322 26.3% Speak English less than very well2.7% of residents speak other language at home 2,164 67.6% Speak English very well1,037 32.4% Speak English less than very well
English speakers - Born in the United States 93.1% of residents of Abilene speak English at home.
5.6% of residents speak Spanish at home 1,499 93.5% Speak English very well105 6.5% Speak English less than very well1.3% of residents speak other language at home 306 85.5% Speak English very well52 14.5% Speak English less than very well
English speakers - Native, born elsewhere 62.7% of residents of Abilene speak English at home.
23.4% of residents speak Spanish at home 319 100.0% Speak English very well13.9% of residents speak other language at home 189 100.0% Speak English very well
English speakers - Foreign-born 34.5% of residents of Abilene speak English at home.
42.3% of residents speak Spanish at home 1,043 23.4% Speak English very well3,414 76.6% Speak English less than very well23.1% of residents speak other language at home 1,450 59.5% Speak English very well985 40.5% Speak English less than very well
White (Caucasian) - Speak only English Native:
96.2% (71,146)Foreign-born:
72.7% (1,461)
White (Caucasian) - Speak another language Native:
3.8% (2,784)Foreign-born:
27.3% (550)
Black or African American - Speak only English Native:
96.9% (10,294)Foreign-born:
30.3% (558)
Black or African American - Speak another language Native:
3.1% (331)Foreign-born:
70.0% (1,288)
American Indian / Alaska Native - Speak another language Native:
41.7% (151)Foreign-born:
98.9% (30)
Asian - Speak only English Native:
63.4% (662)Foreign-born:
26.6% (536)
Asian - Speak another language Native:
36.6% (382)Foreign-born:
73.4% (1,480)
Other race - Speak only English Native:
58.1% (2,550)Foreign-born:
6.7% (49)
Other race - Speak another language Native:
41.9% (1,837)Foreign-born:
93.3% (687)
Two or more races - Speak only English Native:
61.6% (11,960)Foreign-born:
3.2% (119)
Two or more races - Speak another language Native:
38.4% (7,462)Foreign-born:
96.8% (3,554)
White alone - Speak only English Native:
97.2% (64,972)Foreign-born:
73.2% (783)
White alone - Speak another language Native:
2.8% (1,898)Foreign-born:
27.0% (289)
Hispanic or Latino - Speak only English Native:
60.7% (16,679)Foreign-born:
1.1% (49)
Hispanic or Latino - Speak another language Native:
39.3% (10,779)Foreign-born:
98.9% (4,392)
Foreign-born residents in Abilene 9,835 residents are foreign born (3.8% Latin America , 1.5% Asia , 1.2% Africa ).
This city:
7.7%Texas:
17.1%
Marital status for residents in Abilene Marital status - White (Caucasian) population 15 years and over
Males 33.3% Never married53.8% Now married1.0% Separated2.9% Widowed9.1% DivorcedFemales 26.5% Never married50.0% Now married3.3% Separated5.5% Widowed14.7% DivorcedWomen who gave birth in the past 12 months Now married:
59.1% (629)Unmarried:
40.9% (435)
Women who did not give birth in the past 12 months Now married:
49.2% (9,136)Unmarried:
50.8% (9,434)
Marital status - Black or African American population 15 years and over
Males 56.5% Never married31.9% Now married2.0% Separated1.4% Widowed8.2% DivorcedFemales 44.4% Never married31.9% Now married7.2% Separated4.6% Widowed11.8% DivorcedWomen who gave birth in the past 12 months Now married:
93.4% (58)Unmarried:
6.6% (4)
Women who did not give birth in the past 12 months Now married:
33.1% (959)Unmarried:
66.9% (1,942)
Marital status - American Indian / Alaska Native population 15 years and over
Males 65.5% Never married25.7% Now married2.9% Separated0.0% Widowed5.8% DivorcedFemales 33.8% Never married20.8% Now married0.0% Separated11.7% Widowed33.8% DivorcedWomen who did not give birth in the past 12 months Now married:
17.0% (13)Unmarried:
83.0% (63)
Marital status - Asian population 15 years and over
Males 53.0% Never married42.2% Now married0.6% Separated0.0% Widowed4.2% DivorcedFemales 38.5% Never married51.0% Now married0.5% Separated6.6% Widowed3.3% DivorcedWomen who gave birth in the past 12 months Now married:
47.4% (19)Unmarried:
52.6% (22)
Women who did not give birth in the past 12 months Now married:
44.6% (405)Unmarried:
55.4% (504)
Marital status - Native Hawaiian / Pacific Islander population 15 years and over
Males 0.0% Never married100.0% Now married0.0% Separated0.0% Widowed0.0% DivorcedFemales 0.0% Never married100.0% Now married0.0% Separated0.0% Widowed0.0% DivorcedMarital status - Other race population 15 years and over
Males 44.9% Never married38.0% Now married8.6% Separated3.3% Widowed5.2% DivorcedFemales 38.4% Never married39.0% Now married3.0% Separated6.1% Widowed13.5% DivorcedWomen who gave birth in the past 12 months Now married:
42.4% (176)Unmarried:
57.6% (239)
Women who did not give birth in the past 12 months Now married:
40.5% (330)Unmarried:
59.5% (484)
Marital status - Two or more races population 15 years and over
Males 49.5% Never married33.3% Now married3.6% Separated3.8% Widowed9.9% DivorcedFemales 44.2% Never married34.2% Now married2.2% Separated8.7% Widowed10.6% DivorcedWomen who gave birth in the past 12 months Now married:
26.7% (49)Unmarried:
73.3% (133)
Women who did not give birth in the past 12 months Now married:
33.4% (2,136)Unmarried:
66.6% (4,252)
Marital status - White alone, not Hispanic / Latino population 15 years and over
Males 32.6% Never married54.0% Now married0.9% Separated3.1% Widowed9.3% DivorcedFemales 26.0% Never married50.3% Now married3.3% Separated5.7% Widowed14.7% DivorcedWomen who gave birth in the past 12 months Now married:
61.9% (629)Unmarried:
38.1% (387)
Women who did not give birth in the past 12 months Now married:
49.2% (8,185)Unmarried:
50.8% (8,446)
Marital status - Hispanic or Latino population 15 years and over
Males 44.8% Never married39.8% Now married4.1% Separated3.1% Widowed8.2% DivorcedFemales 40.4% Never married36.2% Now married2.7% Separated7.8% Widowed12.9% DivorcedWomen who gave birth in the past 12 months Now married:
29.5% (176)Unmarried:
70.5% (420)
Women who did not give birth in the past 12 months Now married:
34.3% (2,914)Unmarried:
65.7% (5,580)
Ancestries in Abilene
6,317 9.3% English5,064 7.4% American4,233 6.2% German3,535 5.2% Irish1,607 2.4% European967 1.4% Scottish728 1.1% Jamaican659 1.0% Italian567 0.8% Scotch-Irish379 0.6% French311 0.5% Norwegian306 0.4% Polish243 0.4% British222 0.3% Swedish216 0.3% Dutch209 0.3% African147 0.2% Danish110 0.2% Cajun110 0.2% Ethiopian105 0.2% Kenyan99 0.1% Canadian94 0.1% Scandinavian90 0.1% Pennsylvania German78 0.1% Latvian67 0.10% Lebanese66 0.10% Welsh64 0.09% French Canadian63 0.09% Moroccan58 0.08% Czechoslovakian34 0.05% Greek34 0.05% Turkish33 0.05% Northern European32 0.05% Sudanese25 0.04% Eastern European20 0.03% Trinidadian and Tobagonian19 0.03% Russian17 0.02% Lithuanian17 0.02% Swiss17 0.02% Hungarian14 0.02% Czech13 0.02% Albanian12 0.02% Nigerian11 0.02% Ghanaian11 0.02% Israeli11 0.02% Portuguese10 0.01% Iranian8 0.01% Brazilian
Geographical mobility in Abilene Same house 1 year ago 62,954 79.3% White (Caucasian)10,769 80.0% Black or African American287 69.3% American Indian / Alaska Native2,201 70.2% Asian8 36.8% Native Hawaiian / Pacific Islander4,091 74.2% Other race19,692 80.8% Two or more races58,164 80.0% White alone, not Hispanic / Latino26,900 79.9% Hispanic or LatinoMoved within same county 10,695 13.5% White / Caucasian1,351 10.0% Black or African American73 17.6% American Indian / Alaska Native51 1.6% Asian6 27.7% Native Hawaiian / Pacific Islander333 6.0% Other race2,499 10.3% Two or more races9,699 13.3% White alone, not Hispanic / Latino3,364 10.0% Hispanic or LatinoMoved within same state 3,375 4.3% White / Caucasian1,243 9.2% Black or African American40 9.6% American Indian / Alaska Native309 9.9% Asian774 14.0% Other race1,235 5.1% Two or more races2,895 4.0% White alone, not Hispanic / Latino2,066 6.1% Hispanic or LatinoMoved from different state 2,099 2.6% White / Caucasian68 0.5% Black or African American273 8.7% Asian298 5.4% Other race892 3.7% Two or more races1,793 2.5% White alone, not Hispanic / Latino1,146 3.4% Hispanic or LatinoMoved from abroad 287 0.4% White28 0.2% Black or African American300 9.6% Asian14 0.3% Other race52 0.2% Two or more races119 0.2% White alone, not Hispanic / Latino182 0.5% Hispanic or Latino
Children Nativity (place of birth) in Abilene
Children under 6 years - Living with two parents Both parents native 4,443 100.0% NativeBoth parents foreign-born 433 57.0% Native327 43.0% Foreign-bornOne native, one foreign-born parent 282 100.0% NativeChildren under 6 years - Living with one parent Native parent 3,247 100.0% NativeForeign-born parent 278 99.3% Native2 0.7% Foreign-bornChildren 6 to 17 years - Living with two parents Both parents native 9,347 100.0% Native2 0.0% Foreign-bornBoth parents foreign-born 603 53.3% Native529 46.7% Foreign-bornOne native, one foreign-born parent 649 97.8% Native15 2.2% Foreign-bornChildren 6 to 17 years - Living with one parent Native parent 6,360 100.0% NativeForeign-born parent 638 60.8% Native410 39.2% Foreign-born
Grandparents responsible for own grandchildren in Abilene
Grandparents (30 to 59 years) White / Caucasian 230 69.6% Responsible for grandchildren100 30.4% Not responsible for grandchildrenBlack or African American 69 42.9% Responsible for grandchildren91 57.1% Not responsible for grandchildrenAsian 9 100.0% Responsible for grandchildrenOther race 7 33.8% Responsible for grandchildren14 66.2% Not responsible for grandchildrenTwo or more races 191 100.0% Responsible for grandchildrenWhite alone, not Hispanic / Latino 228 62.4% Responsible for grandchildren137 37.6% Not responsible for grandchildrenHispanic or Latino 203 87.0% Responsible for grandchildren30 13.0% Not responsible for grandchildrenGrandparents (60 years and over) White / Caucasian 249 44.3% Responsible for grandchildren313 55.7% Not responsible for grandchildrenBlack or African American 51 24.8% Responsible for grandchildren154 75.2% Not responsible for grandchildrenAsian 13 53.1% Responsible for grandchildren12 46.9% Not responsible for grandchildrenOther race 192 48.0% Responsible for grandchildren208 52.0% Not responsible for grandchildrenTwo or more races 156 71.5% Responsible for grandchildren62 28.5% Not responsible for grandchildrenWhite alone, not Hispanic / Latino 256 62.1% Responsible for grandchildren156 37.9% Not responsible for grandchildrenHispanic or Latino 287 46.3% Responsible for grandchildren333 53.7% Not responsible for grandchildren