Races in Alamo, Texas (TX) Detailed Stats
Data:
Races - White alone (%)
Races - White alone (% change since 2000)
Races - Black alone (%)
Races - Black alone (% change since 2000)
Races - American Indian alone (%)
Races - American Indian alone (% change since 2000)
Races - Asian alone (%)
Races - Asian alone (% change since 2000)
Races - Hispanic (%)
Races - Hispanic (% change since 2000)
Races - Native Hawaiian and Other Pacific Islander alone (%)
Races - Native Hawaiian and Other Pacific Islander alone (% change since 2000)
Races - Two or more races(%)
Races - Two or more races(% change since 2000)
Races - Other race alone (%)
Races - Other race alone (% change since 2000)
Racial diversity
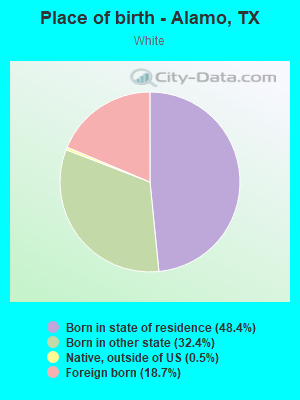
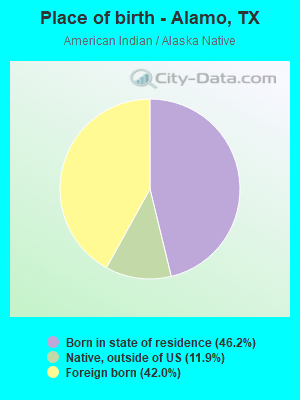
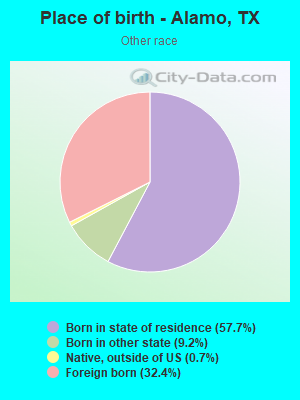
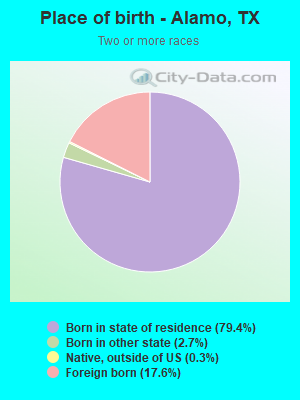
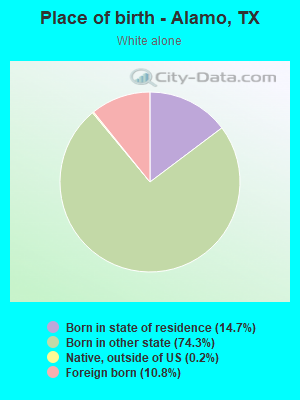
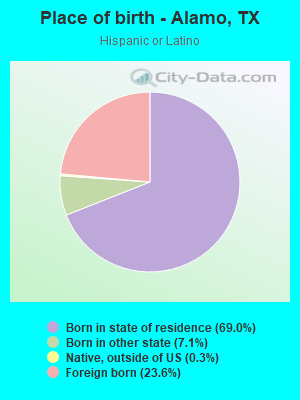
Place of birth - Born in state of residence (%)
Place of birth - Born in state of residence (%) - White
Place of birth - Born in state of residence (%) - Black or African American
Place of birth - Born in state of residence (%) - Asian
Place of birth - Born in state of residence (%) - Hispanic or Latino
Place of birth - Born in state of residence (%) - American Indian and Alaska Native
Place of birth - Born in state of residence (%) - Multirace
Place of birth - Born in state of residence (%) - Other Race
Place of birth - Born in other state (%)
Place of birth - Born in other state (%) - White
Place of birth - Born in other state (%) - Black or African American
Place of birth - Born in other state (%) - Asian
Place of birth - Born in other state (%) - Hispanic or Latino
Place of birth - Born in other state (%) - American Indian and Alaska Native
Place of birth - Born in other state (%) - Multirace
Place of birth - Born in other state (%) - Other Race
Place of birth - Native, outside of US (%)
Place of birth - Native, outside of US (%) - White
Place of birth - Native, outside of US (%) - Black or African American
Place of birth - Native, outside of US (%) - Asian
Place of birth - Native, outside of US (%) - Hispanic or Latino
Place of birth - Native, outside of US (%) - American Indian and Alaska Native
Place of birth - Native, outside of US (%) - Multirace
Place of birth - Native, outside of US (%) - Other Race
Place of birth - Foreign born (%)
Place of birth - Foreign born (%) - White
Place of birth - Foreign born (%) - Black or African American
Place of birth - Foreign born (%) - Asian
Place of birth - Foreign born (%) - Hispanic or Latino
Place of birth - Foreign born (%) - American Indian and Alaska Native
Place of birth - Foreign born (%) - Multirace
Place of birth - Foreign born (%) - Other Race
Residents speaking English at home (%)
Residents speaking English at home - Born in the United States (%)
Residents speaking English at home - Native, born elsewhere (%)
Residents speaking English at home - Foreign born (%)
Residents speaking Spanish at home (%)
Residents speaking Spanish at home - Born in the United States (%)
Residents speaking Spanish at home - Native, born elsewhere (%)
Residents speaking Spanish at home - Foreign born (%)
Residents speaking other language at home (%)
Residents speaking other language at home - Born in the United States (%)
Residents speaking other language at home - Native, born elsewhere (%)
Residents speaking other language at home - Foreign born (%)
Marital status - Never married (%)
Marital status - Now married (%)
Marital status - Separated (%)
Marital status - Widowed (%)
Marital status - Divorced (%)
Ancestries Reported - Arab (%)
Ancestries Reported - Czech (%)
Ancestries Reported - Danish (%)
Ancestries Reported - Dutch (%)
Ancestries Reported - English (%)
Ancestries Reported - French (%)
Ancestries Reported - French Canadian (%)
Ancestries Reported - German (%)
Ancestries Reported - Greek (%)
Ancestries Reported - Hungarian (%)
Ancestries Reported - Irish (%)
Ancestries Reported - Italian (%)
Ancestries Reported - Lithuanian (%)
Ancestries Reported - Norwegian (%)
Ancestries Reported - Polish (%)
Ancestries Reported - Portuguese (%)
Ancestries Reported - Russian (%)
Ancestries Reported - Scotch-Irish (%)
Ancestries Reported - Scottish (%)
Ancestries Reported - Slovak (%)
Ancestries Reported - Subsaharan African (%)
Ancestries Reported - Swedish (%)
Ancestries Reported - Swiss (%)
Ancestries Reported - Ukrainian (%)
Ancestries Reported - United States (%)
Ancestries Reported - Welsh (%)
Ancestries Reported - West Indian (%)
Ancestries Reported - Other (%)
Geographical mobility - Same house 1 year ago (%)
Geographical mobility - Same house 1 year ago (%) - White
Geographical mobility - Same house 1 year ago (%) - Black or African American
Geographical mobility - Same house 1 year ago (%) - Asian
Geographical mobility - Same house 1 year ago (%) - Hispanic or Latino
Geographical mobility - Same house 1 year ago (%) - American Indian and Alaska Native
Geographical mobility - Same house 1 year ago (%) - Multirace
Geographical mobility - Same house 1 year ago (%) - Other Race
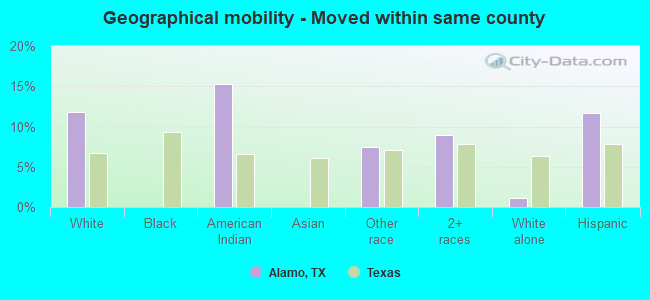
Geographical mobility - Moved within same county (%)
Geographical mobility - Moved within same county (%) - White
Geographical mobility - Moved within same county (%) - Black or African American
Geographical mobility - Moved within same county (%) - Asian
Geographical mobility - Moved within same county (%) - Hispanic or Latino
Geographical mobility - Moved within same county (%) - American Indian and Alaska Native
Geographical mobility - Moved within same county (%) - Multirace
Geographical mobility - Moved within same county (%) - Other Race
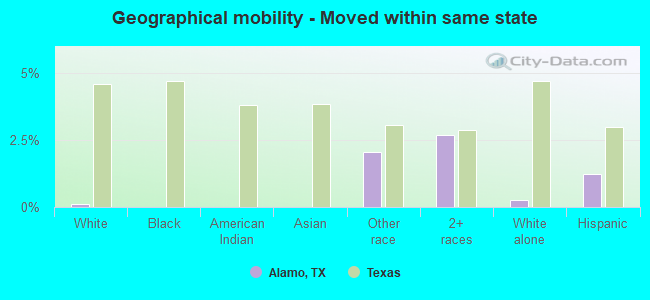
Geographical mobility - Moved from different county within same state (%)
Geographical mobility - Moved from different county within same state (%) - White
Geographical mobility - Moved from different county within same state (%) - Black or African American
Geographical mobility - Moved from different county within same state (%) - Asian
Geographical mobility - Moved from different county within same state (%) - Hispanic or Latino
Geographical mobility - Moved from different county within same state (%) - American Indian and Alaska Native
Geographical mobility - Moved from different county within same state (%) - Multirace
Geographical mobility - Moved from different county within same state (%) - Other Race
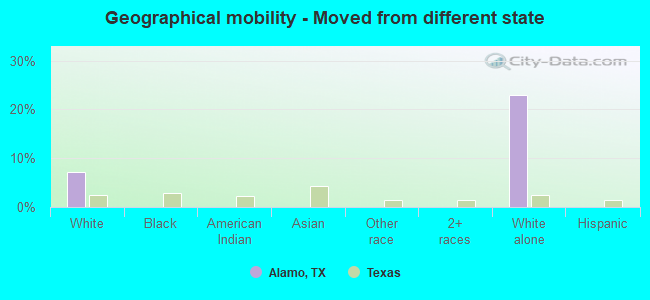
Geographical mobility - Moved from different state (%)
Geographical mobility - Moved from different state (%) - White
Geographical mobility - Moved from different state (%) - Black or African American
Geographical mobility - Moved from different state (%) - Asian
Geographical mobility - Moved from different state (%) - Hispanic or Latino
Geographical mobility - Moved from different state (%) - American Indian and Alaska Native
Geographical mobility - Moved from different state (%) - Multirace
Geographical mobility - Moved from different state (%) - Other Race
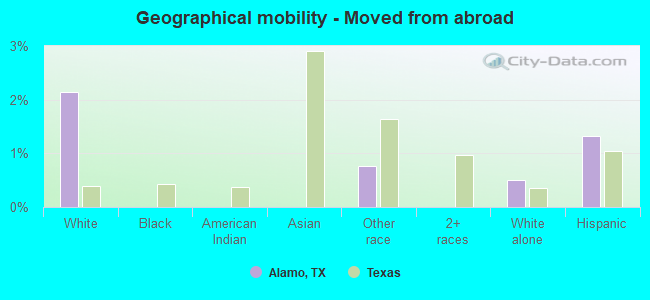
Geographical mobility - Moved from abroad (%)
Geographical mobility - Moved from abroad (%) - White
Geographical mobility - Moved from abroad (%) - Black or African American
Geographical mobility - Moved from abroad (%) - Asian
Geographical mobility - Moved from abroad (%) - Hispanic or Latino
Geographical mobility - Moved from abroad (%) - American Indian and Alaska Native
Geographical mobility - Moved from abroad (%) - Multirace
Geographical mobility - Moved from abroad (%) - Other Race
Place of birth for the foreign-born population - Ireland (%)
Place of birth for the foreign-born population - Denmark (%)
Place of birth for the foreign-born population - Norway (%)
Place of birth for the foreign-born population - Sweden (%)
Place of birth for the foreign-born population - United Kingdom (%)
Place of birth for the foreign-born population - England (%)
Place of birth for the foreign-born population - Scotland (%)
Place of birth for the foreign-born population - Other Northern Europe (%)
Place of birth for the foreign-born population - Austria (%)
Place of birth for the foreign-born population - Belgium (%)
Place of birth for the foreign-born population - France (%)
Place of birth for the foreign-born population - Germany (%)
Place of birth for the foreign-born population - Netherlands (%)
Place of birth for the foreign-born population - Switzerland (%)
Place of birth for the foreign-born population - Other Western Europe (%)
Place of birth for the foreign-born population - Greece (%)
Place of birth for the foreign-born population - Italy (%)
Place of birth for the foreign-born population - Portugal (%)
Place of birth for the foreign-born population - Spain (%)
Place of birth for the foreign-born population - Other Southern Europe (%)
Place of birth for the foreign-born population - Albania (%)
Place of birth for the foreign-born population - Belarus (%)
Place of birth for the foreign-born population - Bosnia and Herzegovina (%)
Place of birth for the foreign-born population - Bulgaria (%)
Place of birth for the foreign-born population - Croatia (%)
Place of birth for the foreign-born population - Czechoslovakia (%)
Place of birth for the foreign-born population - Hungary (%)
Place of birth for the foreign-born population - Latvia (%)
Place of birth for the foreign-born population - Lithuania (%)
Place of birth for the foreign-born population - North Macedonia (Macedonia) (%)
Place of birth for the foreign-born population - Moldova (%)
Place of birth for the foreign-born population - Poland (%)
Place of birth for the foreign-born population - Romania (%)
Place of birth for the foreign-born population - Russia (%)
Place of birth for the foreign-born population - Serbia (%)
Place of birth for the foreign-born population - Ukraine (%)
Place of birth for the foreign-born population - Other Eastern Europe (%)
Place of birth for the foreign-born population - China (%)
Place of birth for the foreign-born population - Hong Kong (%)
Place of birth for the foreign-born population - Taiwan (%)
Place of birth for the foreign-born population - Japan (%)
Place of birth for the foreign-born population - Korea (%)
Place of birth for the foreign-born population - Other Eastern Asia (%)
Place of birth for the foreign-born population - Afghanistan (%)
Place of birth for the foreign-born population - Bangladesh (%)
Place of birth for the foreign-born population - India (%)
Place of birth for the foreign-born population - Iran (%)
Place of birth for the foreign-born population - Kazakhstan (%)
Place of birth for the foreign-born population - Nepal (%)
Place of birth for the foreign-born population - Pakistan (%)
Place of birth for the foreign-born population - Sri Lanka (%)
Place of birth for the foreign-born population - Uzbekistan (%)
Place of birth for the foreign-born population - Other South Central Asia (%)
Place of birth for the foreign-born population - Burma (%)
Place of birth for the foreign-born population - Cambodia (%)
Place of birth for the foreign-born population - Indonesia (%)
Place of birth for the foreign-born population - Laos (%)
Place of birth for the foreign-born population - Malaysia (%)
Place of birth for the foreign-born population - Philippines (%)
Place of birth for the foreign-born population - Singapore (%)
Place of birth for the foreign-born population - Thailand (%)
Place of birth for the foreign-born population - Vietnam (%)
Place of birth for the foreign-born population - Other South Eastern Asia (%)
Place of birth for the foreign-born population - Armenia (%)
Place of birth for the foreign-born population - Iraq (%)
Place of birth for the foreign-born population - Israel (%)
Place of birth for the foreign-born population - Jordan (%)
Place of birth for the foreign-born population - Kuwait (%)
Place of birth for the foreign-born population - Lebanon (%)
Place of birth for the foreign-born population - Saudi Arabia (%)
Place of birth for the foreign-born population - Syria (%)
Place of birth for the foreign-born population - Turkey (%)
Place of birth for the foreign-born population - Yemen (%)
Place of birth for the foreign-born population - Other Western Asia (%)
Place of birth for the foreign-born population - Eritrea (%)
Place of birth for the foreign-born population - Ethiopia (%)
Place of birth for the foreign-born population - Kenya (%)
Place of birth for the foreign-born population - Somalia (%)
Place of birth for the foreign-born population - Uganda (%)
Place of birth for the foreign-born population - Zimbabwe (%)
Place of birth for the foreign-born population - Other Eastern Africa (%)
Place of birth for the foreign-born population - Cameroon (%)
Place of birth for the foreign-born population - Congo (%)
Place of birth for the foreign-born population - Democratic Republic of Congo (Zaire) (%)
Place of birth for the foreign-born population - Other Middle Africa (%)
Place of birth for the foreign-born population - Egypt (%)
Place of birth for the foreign-born population - Morocco (%)
Place of birth for the foreign-born population - Sudan (%)
Place of birth for the foreign-born population - Other Northern Africa (%)
Place of birth for the foreign-born population - South Africa (%)
Place of birth for the foreign-born population - Other Southern Africa (%)
Place of birth for the foreign-born population - Cabo Verde (%)
Place of birth for the foreign-born population - Ghana (%)
Place of birth for the foreign-born population - Liberia (%)
Place of birth for the foreign-born population - Nigeria (%)
Place of birth for the foreign-born population - Senegal (%)
Place of birth for the foreign-born population - Sierra Leone (%)
Place of birth for the foreign-born population - Other Western Africa (%)
Place of birth for the foreign-born population - Australia (%)
Place of birth for the foreign-born population - New Zealand (%)
Place of birth for the foreign-born population - Fiji (%)
Place of birth for the foreign-born population - Micronesia (%)
Place of birth for the foreign-born population - Bahamas (%)
Place of birth for the foreign-born population - Barbados (%)
Place of birth for the foreign-born population - Cuba (%)
Place of birth for the foreign-born population - Dominica (%)
Place of birth for the foreign-born population - Dominican Republic (%)
Place of birth for the foreign-born population - Grenada (%)
Place of birth for the foreign-born population - Haiti (%)
Place of birth for the foreign-born population - Jamaica (%)
Place of birth for the foreign-born population - St. Vincent and the Grenadines (%)
Place of birth for the foreign-born population - Trinidad and Tobago (%)
Place of birth for the foreign-born population - West Indies (%)
Place of birth for the foreign-born population - Other Caribbean (%)
Place of birth for the foreign-born population - Belize (%)
Place of birth for the foreign-born population - Costa Rica (%)
Place of birth for the foreign-born population - El Salvador (%)
Place of birth for the foreign-born population - Guatemala (%)
Place of birth for the foreign-born population - Honduras (%)
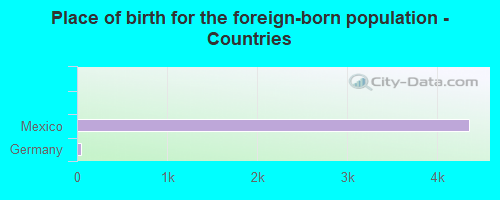
Place of birth for the foreign-born population - Mexico (%)
Place of birth for the foreign-born population - Nicaragua (%)
Place of birth for the foreign-born population - Panama (%)
Place of birth for the foreign-born population - Other Central America (%)
Place of birth for the foreign-born population - Argentina (%)
Place of birth for the foreign-born population - Bolivia (%)
Place of birth for the foreign-born population - Brazil (%)
Place of birth for the foreign-born population - Chile (%)
Place of birth for the foreign-born population - Colombia (%)
Place of birth for the foreign-born population - Ecuador (%)
Place of birth for the foreign-born population - Guyana (%)
Place of birth for the foreign-born population - Peru (%)
Place of birth for the foreign-born population - Uruguay (%)
Place of birth for the foreign-born population - Venezuela (%)
Place of birth for the foreign-born population - Other South America (%)
Place of birth for the foreign-born population - Canada (%)
Place of birth for the foreign-born population - Other Northern America (%)
Place of birth for the foreign-born population - Other (%)
Latest news about races in Alamo, TX collected exclusively by city-data.com from local newspapers, TV, and radio stations
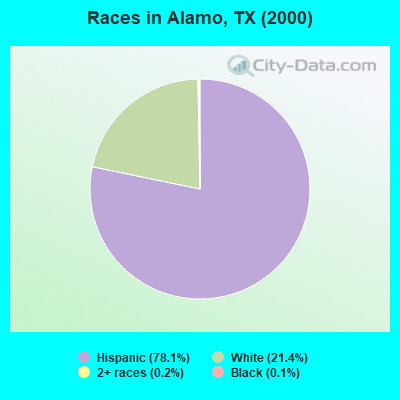
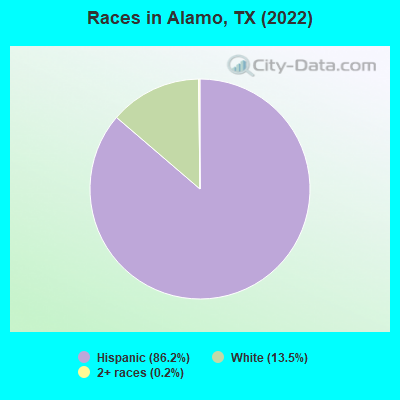
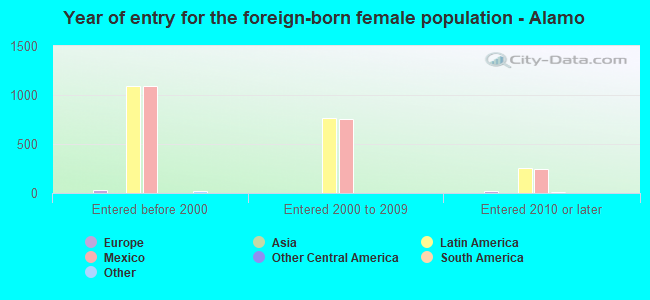
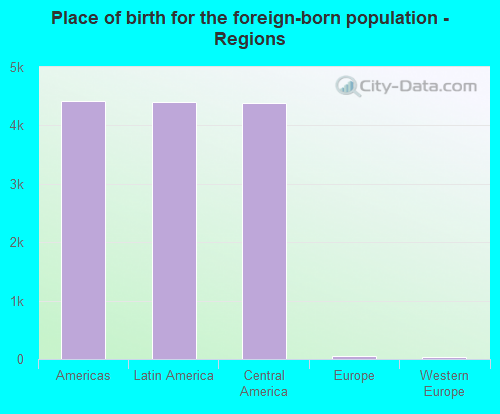
According to 2022 data, the most numerous races in Alamo, TX are Hispanic (17,365 residents), White alone (2,713 residents), and Black alone (11 residents). 27.0% of Alamo residents speak English at home. 22.2% of Alamo, TX residents are foreign-born (21.4% born in Latin America), which is 23.4% greater than the foreign-born rate of 17.0% across the entire state of Texas.
Race distribution in Alamo
2000 2022
10,933,313 52.4% White alone 6,669,666 32.0% Hispanic 2,364,255 11.3% Black alone 554,445 2.7% Asian alone 230,567 1.1% Two or more races 68,859 0.3% American Indian alone 19,958 0.10% Other race alone 10,757 0.05% Native Hawaiian and Other
12,070,642 40.2% Hispanic 11,683,430 38.9% White alone 3,508,706 11.7% Black alone 1,608,173 5.4% Asian alone 956,560 3.2% Two or more races 125,763 0.4% Other race alone 47,023 0.2% American Indian alone 29,275 0.10% Native Hawaiian and Other
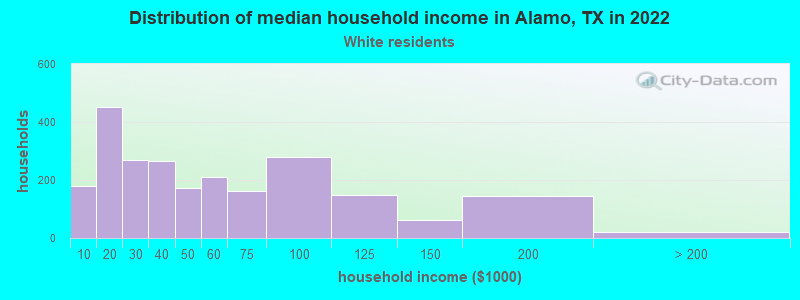
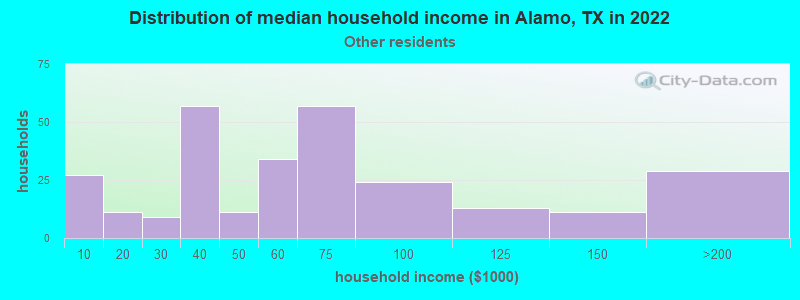
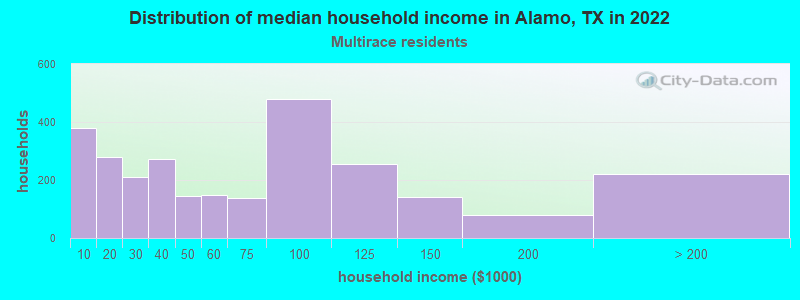
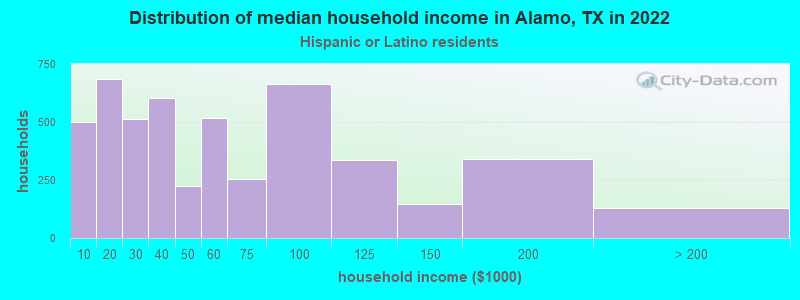
Income and house value in Alamo Median household income in 2022 $51,000 White non-Hispanic householders$65,946 Some other race householders$57,583 Two or more races householders$46,059 Hispanic or Latino race householdersMedian 2022 house value $251,349 White Non-Hispanic householders $180,726 Asian householders$102,875 Some other race householders$174,887 Two or more races householders$116,777 Hispanic or Latino householders
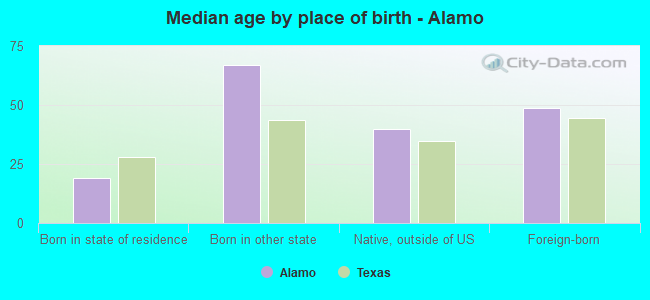
Median age by race in Alamo
35.9 Median age for White residents34.6 39.5 -636,150,234.1 Median age for Black or African American residents-682,648,401.1 -489,388,264.2 21.4 Median age for American Indian / Alaska Native residents21.2 -627,650,550.7 -666,666,666.0 Median age for Asian residents-602,763,384.5 -710,659,897.8 -581,560,283.1 Median age for Native Hawaiian / Pacific Islander residents-612,729,233.5 -577,777,777.2 29.2 Median age for Other race residents36.8 26.3 24.3 Median age for Two or more races residents25.6 22.3 67.7 Median age for White alone residents69.8 66.9 26.2 Median age for Hispanic or Latino residents26.2 26.2
Owner/renter occupied households by race in Alamo
House owners and renters - White residents 1,575 70.3% Owner occupied667 29.7% Renter occupiedHouse owners and renters - American Indian / Alaska Native residents 13 100.0% Renter occupiedHouse owners and renters - Other race residents 246 92.0% Owner occupied21 8.0% Renter occupiedHouse owners and renters - Two or more races residents 1,861 68.3% Owner occupied862 31.7% Renter occupiedHouse owners and renters - White alone residents 1,058 77.0% Owner occupied316 23.0% Renter occupiedHouse owners and renters - Hispanic or Latino residents 3,385 68.4% Owner occupied1,566 31.6% Renter occupied
Language usage in Alamo
English speakers - Total 27.0% of residents of Alamo speak English at home.
73.0% of residents speak Spanish at home 9,248 68.6% Speak English very well4,242 31.4% Speak English less than very well0.2% of residents speak other language at home 38 100.0% Speak English very well
English speakers - Born in the United States 66.4% of residents of Alamo speak English at home.
35.5% of residents speak Spanish at home 1,033 88.0% Speak English very well141 12.0% Speak English less than very well
English speakers - Native, born elsewhere 14.0% of residents of Alamo speak English at home.
78.0% of residents speak Spanish at home 26 66.7% Speak English very well13 33.3% Speak English less than very well
English speakers - Foreign-born 8.2% of residents of Alamo speak English at home.
90.8% of residents speak Spanish at home 1,154 28.7% Speak English very well2,869 71.3% Speak English less than very well1.0% of residents speak other language at home 44 100.0% Speak English very well
White (Caucasian) - Speak only English Native:
61.5% (3,053)Foreign-born:
10.4% (141)
White (Caucasian) - Speak another language Native:
47.2% (2,340)Foreign-born:
80.2% (1,081)
American Indian / Alaska Native - Speak another language Native:
100.0% (26)Foreign-born:
98.9% (34)
Other race - Speak only English Native:
2.3% (14)Foreign-born:
2.1% (7)
Other race - Speak another language Native:
91.8% (558)Foreign-born:
97.6% (313)
Two or more races - Speak only English Native:
15.7% (1,179)Foreign-born:
5.3% (96)
Two or more races - Speak another language Native:
84.1% (6,317)Foreign-born:
95.0% (1,734)
White alone - Speak only English Native:
94.3% (2,139)Foreign-born:
5.4% (16)
White alone - Speak another language Native:
5.9% (133)Foreign-born:
100.0% (293)
Hispanic or Latino - Speak only English Native:
20.4% (2,386)Foreign-born:
8.4% (345)
Hispanic or Latino - Speak another language Native:
79.6% (9,321)Foreign-born:
92.1% (3,784)
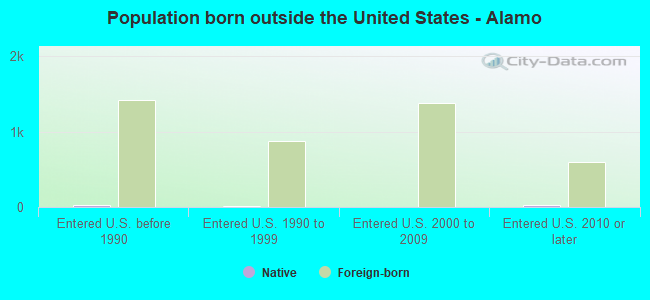
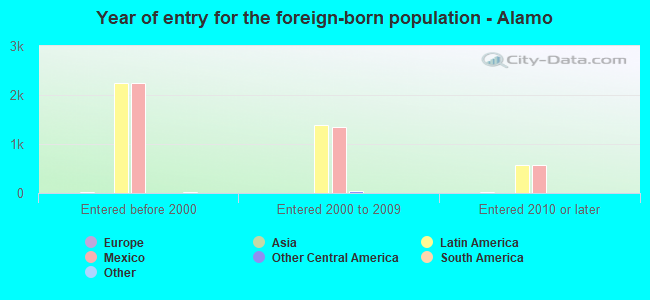
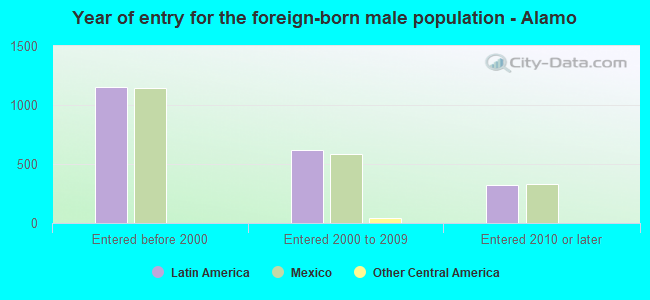
Foreign-born residents in Alamo 4,476 residents are foreign born (21.4% Latin America ).
This city:
22.2%Texas:
17.1%
Marital status for residents in Alamo Marital status - White (Caucasian) population 15 years and over
Males 26.2% Never married60.0% Now married2.7% Separated4.1% Widowed7.1% DivorcedFemales 27.3% Never married47.3% Now married3.6% Separated12.9% Widowed8.8% DivorcedWomen who gave birth in the past 12 months Now married:
100.0% (61)Unmarried:
0.0% (0)
Women who did not give birth in the past 12 months Now married:
41.2% (453)Unmarried:
58.8% (648)
Marital status - American Indian / Alaska Native population 15 years and over
Males 45.0% Never married55.0% Now married0.0% Separated0.0% Widowed0.0% DivorcedFemales 55.6% Never married44.4% Now married0.0% Separated0.0% Widowed0.0% DivorcedWomen who did not give birth in the past 12 months Now married:
0.0% (0)Unmarried:
100.0% (14)
Marital status - Other race population 15 years and over
Males 40.2% Never married54.8% Now married4.9% Separated0.0% Widowed0.0% DivorcedFemales 31.6% Never married48.0% Now married5.3% Separated8.1% Widowed7.1% DivorcedWomen who gave birth in the past 12 months Now married:
0.0% (0)Unmarried:
100.0% (9)
Women who did not give birth in the past 12 months Now married:
52.0% (140)Unmarried:
48.0% (129)
Marital status - Two or more races population 15 years and over
Males 42.5% Never married51.5% Now married0.9% Separated0.8% Widowed4.3% DivorcedFemales 41.9% Never married47.0% Now married2.9% Separated2.3% Widowed5.9% DivorcedWomen who gave birth in the past 12 months Now married:
40.7% (155)Unmarried:
59.3% (226)
Women who did not give birth in the past 12 months Now married:
41.9% (1,002)Unmarried:
58.1% (1,389)
Marital status - White alone, not Hispanic / Latino population 15 years and over
Males 11.6% Never married69.6% Now married0.0% Separated9.5% Widowed9.3% DivorcedFemales 14.5% Never married55.9% Now married1.3% Separated17.4% Widowed10.9% DivorcedWomen who did not give birth in the past 12 months Now married:
20.7% (50)Unmarried:
79.3% (192)
Marital status - Hispanic or Latino population 15 years and over
Males 35.5% Never married54.9% Now married2.8% Separated1.6% Widowed5.1% DivorcedFemales 35.4% Never married45.3% Now married4.1% Separated8.1% Widowed7.2% DivorcedWomen who gave birth in the past 12 months Now married:
62.7% (228)Unmarried:
37.3% (136)
Women who did not give birth in the past 12 months Now married:
43.3% (1,727)Unmarried:
56.7% (2,257)
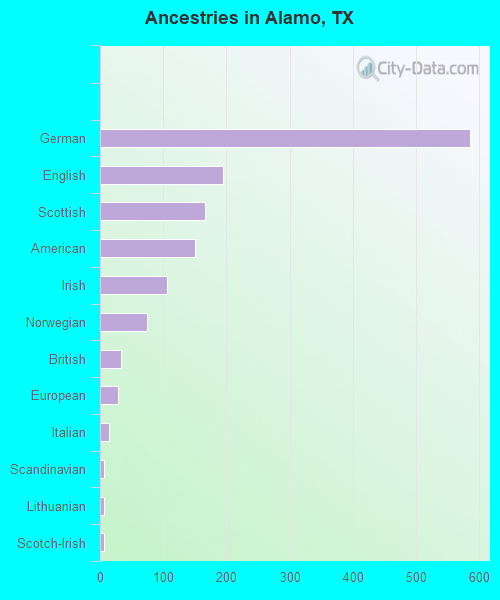
Ancestries in Alamo
586 3.7% German194 1.2% English166 1.0% Scottish151 1.0% American106 0.7% Irish75 0.5% Norwegian33 0.2% British28 0.2% European15 0.09% Italian7 0.04% Scandinavian6 0.04% Lithuanian6 0.04% Scotch-Irish
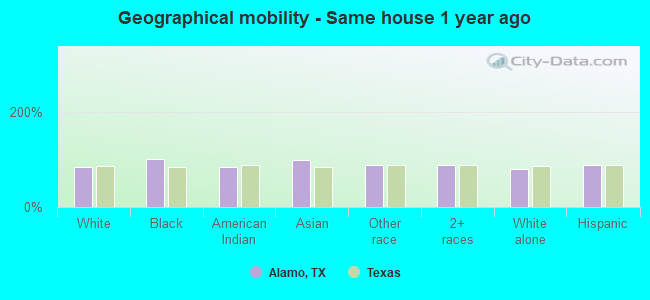
Geographical mobility in Alamo Same house 1 year ago 5,021 82.6% White (Caucasian)12 100.0% Black or African American59 83.4% American Indian / Alaska Native2 99.3% Asian866 89.5% Other race8,997 88.7% Two or more races2,181 80.5% White alone, not Hispanic / Latino14,824 86.6% Hispanic or LatinoMoved within same county 720 11.8% White / Caucasian11 15.3% American Indian / Alaska Native72 7.4% Other race910 9.0% Two or more races31 1.1% White alone, not Hispanic / Latino1,988 11.6% Hispanic or LatinoMoved within same state 7 0.1% White / Caucasian20 2.1% Other race272 2.7% Two or more races7 0.3% White alone, not Hispanic / Latino211 1.2% Hispanic or LatinoMoved from different state 431 7.1% White / Caucasian620 22.9% White alone, not Hispanic / Latino5 0.0% Hispanic or LatinoMoved from abroad 130 2.1% White7 0.8% Other race14 0.5% White alone, not Hispanic / Latino225 1.3% Hispanic or Latino
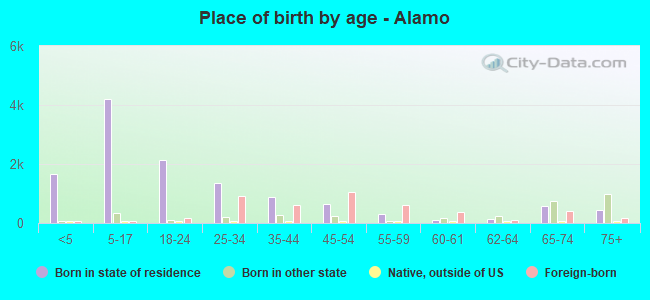
Children Nativity (place of birth) in Alamo
Children under 6 years - Living with two parents Both parents native 545 100.0% NativeBoth parents foreign-born 232 100.0% NativeOne native, one foreign-born parent 121 100.0% NativeChildren under 6 years - Living with one parent Native parent 851 100.0% NativeForeign-born parent 384 100.0% NativeChildren 6 to 17 years - Living with two parents Both parents native 1,168 100.0% NativeBoth parents foreign-born 557 96.9% Native18 3.1% Foreign-bornOne native, one foreign-born parent 332 100.0% NativeChildren 6 to 17 years - Living with one parent Native parent 1,141 100.0% NativeForeign-born parent 747 50.0% Native747 50.0% Foreign-born
Grandparents responsible for own grandchildren in Alamo
Grandparents (30 to 59 years) White / Caucasian 70 26.6% Responsible for grandchildren193 73.4% Not responsible for grandchildrenAmerican Indian / Alaska Native 14 100.0% Not responsible for grandchildrenOther race 17 100.0% Not responsible for grandchildrenTwo or more races 152 100.0% Not responsible for grandchildrenWhite alone, not Hispanic / Latino 116 100.0% Not responsible for grandchildrenHispanic or Latino 187 37.5% Responsible for grandchildren312 62.5% Not responsible for grandchildrenGrandparents (60 years and over) White / Caucasian 20 15.8% Responsible for grandchildren104 84.2% Not responsible for grandchildrenOther race 24 100.0% Not responsible for grandchildrenHispanic or Latino 35 16.7% Responsible for grandchildren177 83.3% Not responsible for grandchildren