Races in Asheville, North Carolina (NC) Detailed Stats
Data:
Races - White alone (%)
Races - White alone (% change since 2000)
Races - Black alone (%)
Races - Black alone (% change since 2000)
Races - American Indian alone (%)
Races - American Indian alone (% change since 2000)
Races - Asian alone (%)
Races - Asian alone (% change since 2000)
Races - Hispanic (%)
Races - Hispanic (% change since 2000)
Races - Native Hawaiian and Other Pacific Islander alone (%)
Races - Native Hawaiian and Other Pacific Islander alone (% change since 2000)
Races - Two or more races(%)
Races - Two or more races(% change since 2000)
Races - Other race alone (%)
Races - Other race alone (% change since 2000)
Racial diversity
Place of birth - Born in state of residence (%)
Place of birth - Born in state of residence (%) - White
Place of birth - Born in state of residence (%) - Black or African American
Place of birth - Born in state of residence (%) - Asian
Place of birth - Born in state of residence (%) - Hispanic or Latino
Place of birth - Born in state of residence (%) - American Indian and Alaska Native
Place of birth - Born in state of residence (%) - Multirace
Place of birth - Born in state of residence (%) - Other Race
Place of birth - Born in other state (%)
Place of birth - Born in other state (%) - White
Place of birth - Born in other state (%) - Black or African American
Place of birth - Born in other state (%) - Asian
Place of birth - Born in other state (%) - Hispanic or Latino
Place of birth - Born in other state (%) - American Indian and Alaska Native
Place of birth - Born in other state (%) - Multirace
Place of birth - Born in other state (%) - Other Race
Place of birth - Native, outside of US (%)
Place of birth - Native, outside of US (%) - White
Place of birth - Native, outside of US (%) - Black or African American
Place of birth - Native, outside of US (%) - Asian
Place of birth - Native, outside of US (%) - Hispanic or Latino
Place of birth - Native, outside of US (%) - American Indian and Alaska Native
Place of birth - Native, outside of US (%) - Multirace
Place of birth - Native, outside of US (%) - Other Race
Place of birth - Foreign born (%)
Place of birth - Foreign born (%) - White
Place of birth - Foreign born (%) - Black or African American
Place of birth - Foreign born (%) - Asian
Place of birth - Foreign born (%) - Hispanic or Latino
Place of birth - Foreign born (%) - American Indian and Alaska Native
Place of birth - Foreign born (%) - Multirace
Place of birth - Foreign born (%) - Other Race
Residents speaking English at home (%)
Residents speaking English at home - Born in the United States (%)
Residents speaking English at home - Native, born elsewhere (%)
Residents speaking English at home - Foreign born (%)
Residents speaking Spanish at home (%)
Residents speaking Spanish at home - Born in the United States (%)
Residents speaking Spanish at home - Native, born elsewhere (%)
Residents speaking Spanish at home - Foreign born (%)
Residents speaking other language at home (%)
Residents speaking other language at home - Born in the United States (%)
Residents speaking other language at home - Native, born elsewhere (%)
Residents speaking other language at home - Foreign born (%)
Marital status - Never married (%)
Marital status - Now married (%)
Marital status - Separated (%)
Marital status - Widowed (%)
Marital status - Divorced (%)
Ancestries Reported - Arab (%)
Ancestries Reported - Czech (%)
Ancestries Reported - Danish (%)
Ancestries Reported - Dutch (%)
Ancestries Reported - English (%)
Ancestries Reported - French (%)
Ancestries Reported - French Canadian (%)
Ancestries Reported - German (%)
Ancestries Reported - Greek (%)
Ancestries Reported - Hungarian (%)
Ancestries Reported - Irish (%)
Ancestries Reported - Italian (%)
Ancestries Reported - Lithuanian (%)
Ancestries Reported - Norwegian (%)
Ancestries Reported - Polish (%)
Ancestries Reported - Portuguese (%)
Ancestries Reported - Russian (%)
Ancestries Reported - Scotch-Irish (%)
Ancestries Reported - Scottish (%)
Ancestries Reported - Slovak (%)
Ancestries Reported - Subsaharan African (%)
Ancestries Reported - Swedish (%)
Ancestries Reported - Swiss (%)
Ancestries Reported - Ukrainian (%)
Ancestries Reported - United States (%)
Ancestries Reported - Welsh (%)
Ancestries Reported - West Indian (%)
Ancestries Reported - Other (%)
Geographical mobility - Same house 1 year ago (%)
Geographical mobility - Same house 1 year ago (%) - White
Geographical mobility - Same house 1 year ago (%) - Black or African American
Geographical mobility - Same house 1 year ago (%) - Asian
Geographical mobility - Same house 1 year ago (%) - Hispanic or Latino
Geographical mobility - Same house 1 year ago (%) - American Indian and Alaska Native
Geographical mobility - Same house 1 year ago (%) - Multirace
Geographical mobility - Same house 1 year ago (%) - Other Race
Geographical mobility - Moved within same county (%)
Geographical mobility - Moved within same county (%) - White
Geographical mobility - Moved within same county (%) - Black or African American
Geographical mobility - Moved within same county (%) - Asian
Geographical mobility - Moved within same county (%) - Hispanic or Latino
Geographical mobility - Moved within same county (%) - American Indian and Alaska Native
Geographical mobility - Moved within same county (%) - Multirace
Geographical mobility - Moved within same county (%) - Other Race
Geographical mobility - Moved from different county within same state (%)
Geographical mobility - Moved from different county within same state (%) - White
Geographical mobility - Moved from different county within same state (%) - Black or African American
Geographical mobility - Moved from different county within same state (%) - Asian
Geographical mobility - Moved from different county within same state (%) - Hispanic or Latino
Geographical mobility - Moved from different county within same state (%) - American Indian and Alaska Native
Geographical mobility - Moved from different county within same state (%) - Multirace
Geographical mobility - Moved from different county within same state (%) - Other Race
Geographical mobility - Moved from different state (%)
Geographical mobility - Moved from different state (%) - White
Geographical mobility - Moved from different state (%) - Black or African American
Geographical mobility - Moved from different state (%) - Asian
Geographical mobility - Moved from different state (%) - Hispanic or Latino
Geographical mobility - Moved from different state (%) - American Indian and Alaska Native
Geographical mobility - Moved from different state (%) - Multirace
Geographical mobility - Moved from different state (%) - Other Race
Geographical mobility - Moved from abroad (%)
Geographical mobility - Moved from abroad (%) - White
Geographical mobility - Moved from abroad (%) - Black or African American
Geographical mobility - Moved from abroad (%) - Asian
Geographical mobility - Moved from abroad (%) - Hispanic or Latino
Geographical mobility - Moved from abroad (%) - American Indian and Alaska Native
Geographical mobility - Moved from abroad (%) - Multirace
Geographical mobility - Moved from abroad (%) - Other Race
Place of birth for the foreign-born population - Ireland (%)
Place of birth for the foreign-born population - Denmark (%)
Place of birth for the foreign-born population - Norway (%)
Place of birth for the foreign-born population - Sweden (%)
Place of birth for the foreign-born population - United Kingdom (%)
Place of birth for the foreign-born population - England (%)
Place of birth for the foreign-born population - Scotland (%)
Place of birth for the foreign-born population - Other Northern Europe (%)
Place of birth for the foreign-born population - Austria (%)
Place of birth for the foreign-born population - Belgium (%)
Place of birth for the foreign-born population - France (%)
Place of birth for the foreign-born population - Germany (%)
Place of birth for the foreign-born population - Netherlands (%)
Place of birth for the foreign-born population - Switzerland (%)
Place of birth for the foreign-born population - Other Western Europe (%)
Place of birth for the foreign-born population - Greece (%)
Place of birth for the foreign-born population - Italy (%)
Place of birth for the foreign-born population - Portugal (%)
Place of birth for the foreign-born population - Spain (%)
Place of birth for the foreign-born population - Other Southern Europe (%)
Place of birth for the foreign-born population - Albania (%)
Place of birth for the foreign-born population - Belarus (%)
Place of birth for the foreign-born population - Bosnia and Herzegovina (%)
Place of birth for the foreign-born population - Bulgaria (%)
Place of birth for the foreign-born population - Croatia (%)
Place of birth for the foreign-born population - Czechoslovakia (%)
Place of birth for the foreign-born population - Hungary (%)
Place of birth for the foreign-born population - Latvia (%)
Place of birth for the foreign-born population - Lithuania (%)
Place of birth for the foreign-born population - North Macedonia (Macedonia) (%)
Place of birth for the foreign-born population - Moldova (%)
Place of birth for the foreign-born population - Poland (%)
Place of birth for the foreign-born population - Romania (%)
Place of birth for the foreign-born population - Russia (%)
Place of birth for the foreign-born population - Serbia (%)
Place of birth for the foreign-born population - Ukraine (%)
Place of birth for the foreign-born population - Other Eastern Europe (%)
Place of birth for the foreign-born population - China (%)
Place of birth for the foreign-born population - Hong Kong (%)
Place of birth for the foreign-born population - Taiwan (%)
Place of birth for the foreign-born population - Japan (%)
Place of birth for the foreign-born population - Korea (%)
Place of birth for the foreign-born population - Other Eastern Asia (%)
Place of birth for the foreign-born population - Afghanistan (%)
Place of birth for the foreign-born population - Bangladesh (%)
Place of birth for the foreign-born population - India (%)
Place of birth for the foreign-born population - Iran (%)
Place of birth for the foreign-born population - Kazakhstan (%)
Place of birth for the foreign-born population - Nepal (%)
Place of birth for the foreign-born population - Pakistan (%)
Place of birth for the foreign-born population - Sri Lanka (%)
Place of birth for the foreign-born population - Uzbekistan (%)
Place of birth for the foreign-born population - Other South Central Asia (%)
Place of birth for the foreign-born population - Burma (%)
Place of birth for the foreign-born population - Cambodia (%)
Place of birth for the foreign-born population - Indonesia (%)
Place of birth for the foreign-born population - Laos (%)
Place of birth for the foreign-born population - Malaysia (%)
Place of birth for the foreign-born population - Philippines (%)
Place of birth for the foreign-born population - Singapore (%)
Place of birth for the foreign-born population - Thailand (%)
Place of birth for the foreign-born population - Vietnam (%)
Place of birth for the foreign-born population - Other South Eastern Asia (%)
Place of birth for the foreign-born population - Armenia (%)
Place of birth for the foreign-born population - Iraq (%)
Place of birth for the foreign-born population - Israel (%)
Place of birth for the foreign-born population - Jordan (%)
Place of birth for the foreign-born population - Kuwait (%)
Place of birth for the foreign-born population - Lebanon (%)
Place of birth for the foreign-born population - Saudi Arabia (%)
Place of birth for the foreign-born population - Syria (%)
Place of birth for the foreign-born population - Turkey (%)
Place of birth for the foreign-born population - Yemen (%)
Place of birth for the foreign-born population - Other Western Asia (%)
Place of birth for the foreign-born population - Eritrea (%)
Place of birth for the foreign-born population - Ethiopia (%)
Place of birth for the foreign-born population - Kenya (%)
Place of birth for the foreign-born population - Somalia (%)
Place of birth for the foreign-born population - Uganda (%)
Place of birth for the foreign-born population - Zimbabwe (%)
Place of birth for the foreign-born population - Other Eastern Africa (%)
Place of birth for the foreign-born population - Cameroon (%)
Place of birth for the foreign-born population - Congo (%)
Place of birth for the foreign-born population - Democratic Republic of Congo (Zaire) (%)
Place of birth for the foreign-born population - Other Middle Africa (%)
Place of birth for the foreign-born population - Egypt (%)
Place of birth for the foreign-born population - Morocco (%)
Place of birth for the foreign-born population - Sudan (%)
Place of birth for the foreign-born population - Other Northern Africa (%)
Place of birth for the foreign-born population - South Africa (%)
Place of birth for the foreign-born population - Other Southern Africa (%)
Place of birth for the foreign-born population - Cabo Verde (%)
Place of birth for the foreign-born population - Ghana (%)
Place of birth for the foreign-born population - Liberia (%)
Place of birth for the foreign-born population - Nigeria (%)
Place of birth for the foreign-born population - Senegal (%)
Place of birth for the foreign-born population - Sierra Leone (%)
Place of birth for the foreign-born population - Other Western Africa (%)
Place of birth for the foreign-born population - Australia (%)
Place of birth for the foreign-born population - New Zealand (%)
Place of birth for the foreign-born population - Fiji (%)
Place of birth for the foreign-born population - Micronesia (%)
Place of birth for the foreign-born population - Bahamas (%)
Place of birth for the foreign-born population - Barbados (%)
Place of birth for the foreign-born population - Cuba (%)
Place of birth for the foreign-born population - Dominica (%)
Place of birth for the foreign-born population - Dominican Republic (%)
Place of birth for the foreign-born population - Grenada (%)
Place of birth for the foreign-born population - Haiti (%)
Place of birth for the foreign-born population - Jamaica (%)
Place of birth for the foreign-born population - St. Vincent and the Grenadines (%)
Place of birth for the foreign-born population - Trinidad and Tobago (%)
Place of birth for the foreign-born population - West Indies (%)
Place of birth for the foreign-born population - Other Caribbean (%)
Place of birth for the foreign-born population - Belize (%)
Place of birth for the foreign-born population - Costa Rica (%)
Place of birth for the foreign-born population - El Salvador (%)
Place of birth for the foreign-born population - Guatemala (%)
Place of birth for the foreign-born population - Honduras (%)
Place of birth for the foreign-born population - Mexico (%)
Place of birth for the foreign-born population - Nicaragua (%)
Place of birth for the foreign-born population - Panama (%)
Place of birth for the foreign-born population - Other Central America (%)
Place of birth for the foreign-born population - Argentina (%)
Place of birth for the foreign-born population - Bolivia (%)
Place of birth for the foreign-born population - Brazil (%)
Place of birth for the foreign-born population - Chile (%)
Place of birth for the foreign-born population - Colombia (%)
Place of birth for the foreign-born population - Ecuador (%)
Place of birth for the foreign-born population - Guyana (%)
Place of birth for the foreign-born population - Peru (%)
Place of birth for the foreign-born population - Uruguay (%)
Place of birth for the foreign-born population - Venezuela (%)
Place of birth for the foreign-born population - Other South America (%)
Place of birth for the foreign-born population - Canada (%)
Place of birth for the foreign-born population - Other Northern America (%)
Place of birth for the foreign-born population - Other (%)
Latest news about races in Asheville, NC collected exclusively by city-data.com from local newspapers, TV, and radio stations
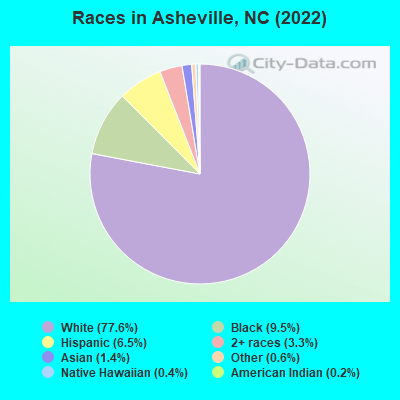
According to 2022 data, the most numerous races in Asheville, NC are White alone (73,843 residents), Black alone (9,082 residents), and Hispanic (6,163 residents). 92.1% of Asheville residents speak English at home. 7.9% of Asheville, NC residents are foreign-born (3.4% born in Latin America, 2.2% born in Europe, 1.6% born in Asia), which is about the same as the foreign-born rate of 8.0% across the entire state of North Carolina.
Race distribution in Asheville
2000 2022
5,647,155 70.2% White alone 1,723,301 21.4% Black alone 378,963 4.7% Hispanic 112,416 1.4% Asian alone 95,333 1.2% American Indian alone 79,965 1.0% Two or more races 9,015 0.1% Other race alone 3,165 0.04% Native Hawaiian and Other
6,497,519 60.7% White alone 2,155,650 20.1% Black alone 1,114,799 10.4% Hispanic 438,061 4.1% Two or more races 341,052 3.2% Asian alone 91,758 0.9% American Indian alone 50,180 0.5% Other race alone 9,954 0.09% Native Hawaiian and Other
Income and house value in Asheville Median household income in 2022 $70,221 White non-Hispanic householders$22,312 Black householders$93,629 Asian householders$59,196 Some other race householders$73,308 Two or more races householders$34,308 Hispanic or Latino race householdersMedian 2022 house value $449,582 White Non-Hispanic householders$313,108 Black or African American householders$292,442 American Indian or Alaska Native householders $348,592 Asian householders$264,758 Some other race householders$336,504 Two or more races householders$453,481 Hispanic or Latino householders
Median age by race in Asheville
42.5 Median age for White residents40.9 45.4 42.2 Median age for Black or African American residents45.3 28.8 -666,666,666.0 Median age for American Indian / Alaska Native residents-666,666,666.0 -666,666,666.0 40.7 Median age for Asian residents35.3 45.4 -666,666,666.0 Median age for Native Hawaiian / Pacific Islander residents-666,666,666.0 -666,666,666.0 46.9 Median age for Other race residents62.0 29.7 29.3 Median age for Two or more races residents26.6 29.5 42.6 Median age for White alone residents40.9 45.5 49.6 Median age for Hispanic or Latino residents50.9 29.9
Owner/renter occupied households by race in Asheville
House owners and renters - White residents 17,034 54.9% Owner occupied13,967 45.1% Renter occupiedHouse owners and renters - Black or African American residents 689 18.9% Owner occupied2,951 81.1% Renter occupiedHouse owners and renters - American Indian / Alaska Native residents 40 51.2% Owner occupied38 48.8% Renter occupiedHouse owners and renters - Asian residents 162 22.2% Owner occupied567 77.8% Renter occupiedHouse owners and renters - Native Hawaiian / Pacific Islander residents 49 100.0% Renter occupiedHouse owners and renters - Other race residents 291 66.9% Owner occupied144 33.1% Renter occupiedHouse owners and renters - Two or more races residents 632 40.5% Owner occupied927 59.5% Renter occupiedHouse owners and renters - White alone residents 17,034 55.0% Owner occupied13,917 45.0% Renter occupiedHouse owners and renters - Hispanic or Latino residents 534 65.4% Owner occupied282 34.6% Renter occupied
Language usage in Asheville
English speakers - Total 92.1% of residents of Asheville speak English at home.
3.2% of residents speak Spanish at home 2,383 82.9% Speak English very well490 17.1% Speak English less than very well4.7% of residents speak other language at home 3,096 73.5% Speak English very well1,115 26.5% Speak English less than very well
English speakers - Born in the United States 97.6% of residents of Asheville speak English at home.
1.7% of residents speak Spanish at home 708 88.6% Speak English very well91 11.4% Speak English less than very well0.7% of residents speak other language at home 335 100.0% Speak English very well
English speakers - Native, born elsewhere 92.2% of residents of Asheville speak English at home.
7.8% of residents speak Spanish at home 59 100.0% Speak English very well
English speakers - Foreign-born 40.4% of residents of Asheville speak English at home.
23.6% of residents speak Spanish at home 1,214 80.2% Speak English very well300 19.8% Speak English less than very well36.0% of residents speak other language at home 1,238 53.6% Speak English very well1,073 46.4% Speak English less than very well
White (Caucasian) - Speak only English Native:
96.0% (67,013)Foreign-born:
56.7% (2,192)
White (Caucasian) - Speak another language Native:
4.0% (2,805)Foreign-born:
43.3% (1,676)
Black or African American - Speak only English Native:
100.0% (8,764)Foreign-born:
48.3% (48)
American Indian / Alaska Native - Speak another language Native:
4.1% (9)Foreign-born:
100.0% (2)
Asian - Speak only English Native:
85.1% (347)Foreign-born:
34.3% (296)
Asian - Speak another language Native:
70.5% (287)Foreign-born:
64.9% (560)
Other race - Speak only English Native:
46.2% (730)Foreign-born:
2.8% (34)
Other race - Speak another language Native:
52.0% (822)Foreign-born:
75.2% (918)
Two or more races - Speak only English Native:
92.5% (2,586)Foreign-born:
28.9% (209)
Two or more races - Speak another language Native:
7.5% (210)Foreign-born:
71.1% (514)
White alone - Speak only English Native:
96.1% (66,959)Foreign-born:
56.7% (2,192)
White alone - Speak another language Native:
3.9% (2,732)Foreign-born:
43.3% (1,676)
Hispanic or Latino - Speak only English Native:
65.4% (837)Foreign-born:
8.1% (121)
Hispanic or Latino - Speak another language Native:
34.6% (442)Foreign-born:
91.9% (1,370)
Foreign-born residents in Asheville 7,551 residents are foreign born (3.4% Latin America , 2.2% Europe , 1.6% Asia ).
This city:
7.9%North Carolina:
8.3%
Marital status for residents in Asheville Marital status - White (Caucasian) population 15 years and over
Males 47.0% Never married42.1% Now married1.3% Separated2.0% Widowed7.7% DivorcedFemales 37.1% Never married35.1% Now married2.4% Separated9.7% Widowed15.8% DivorcedWomen who gave birth in the past 12 months Now married:
100.0% (212)Unmarried:
0.0% (0)
Women who did not give birth in the past 12 months Now married:
28.5% (5,609)Unmarried:
71.5% (14,051)
Marital status - Black or African American population 15 years and over
Males 73.4% Never married11.2% Now married0.6% Separated4.2% Widowed10.6% DivorcedFemales 60.1% Never married21.6% Now married0.0% Separated8.7% Widowed9.6% DivorcedWomen who gave birth in the past 12 months Now married:
26.5% (30)Unmarried:
73.5% (83)
Women who did not give birth in the past 12 months Now married:
18.7% (380)Unmarried:
81.3% (1,653)
Marital status - American Indian / Alaska Native population 15 years and over
Males 15.4% Never married81.5% Now married3.1% Separated0.0% Widowed0.0% DivorcedFemales 28.3% Never married36.2% Now married0.0% Separated27.6% Widowed7.9% DivorcedWomen who did not give birth in the past 12 months Now married:
33.7% (36)Unmarried:
66.3% (71)
Marital status - Asian population 15 years and over
Males 29.3% Never married60.5% Now married0.0% Separated0.0% Widowed10.2% DivorcedFemales 55.2% Never married37.3% Now married0.7% Separated5.7% Widowed1.2% DivorcedWomen who did not give birth in the past 12 months Now married:
29.9% (166)Unmarried:
70.1% (388)
Marital status - Native Hawaiian / Pacific Islander population 15 years and over
Males 0.0% Never married100.0% Now married0.0% Separated0.0% Widowed0.0% DivorcedFemales 51.0% Never married49.0% Now married0.0% Separated0.0% Widowed0.0% DivorcedWomen who gave birth in the past 12 months Now married:
100.0% (39)Unmarried:
0.0% (0)
Women who did not give birth in the past 12 months Now married:
0.0% (0)Unmarried:
100.0% (52)
Marital status - Other race population 15 years and over
Males 68.8% Never married18.9% Now married3.7% Separated0.0% Widowed8.5% DivorcedFemales 29.3% Never married59.5% Now married2.1% Separated0.0% Widowed9.1% DivorcedWomen who did not give birth in the past 12 months Now married:
63.5% (400)Unmarried:
36.5% (230)
Marital status - Two or more races population 15 years and over
Males 70.7% Never married17.9% Now married3.8% Separated0.0% Widowed7.6% DivorcedFemales 30.1% Never married41.2% Now married0.0% Separated9.0% Widowed19.7% DivorcedWomen who gave birth in the past 12 months Now married:
50.0% (16)Unmarried:
50.0% (16)
Women who did not give birth in the past 12 months Now married:
29.6% (354)Unmarried:
70.4% (842)
Marital status - White alone, not Hispanic / Latino population 15 years and over
Males 47.0% Never married42.1% Now married1.3% Separated2.0% Widowed7.7% DivorcedFemales 37.1% Never married35.1% Now married2.3% Separated9.7% Widowed15.8% DivorcedWomen who gave birth in the past 12 months Now married:
100.0% (212)Unmarried:
0.0% (0)
Women who did not give birth in the past 12 months Now married:
28.5% (5,588)Unmarried:
71.5% (13,999)
Marital status - Hispanic or Latino population 15 years and over
Males 51.5% Never married28.1% Now married0.5% Separated0.0% Widowed19.8% DivorcedFemales 32.6% Never married45.7% Now married3.5% Separated10.3% Widowed8.0% DivorcedWomen who gave birth in the past 12 months Now married:
100.0% (12)Unmarried:
0.0% (0)
Women who did not give birth in the past 12 months Now married:
50.4% (627)Unmarried:
49.6% (618)
Ancestries in Asheville
18,012 34.1% English3,011 5.7% German2,920 5.5% American2,808 5.3% Irish1,634 3.1% Italian1,375 2.6% Scotch-Irish1,363 2.6% Scottish1,268 2.4% French1,238 2.3% European822 1.6% Ukrainian602 1.1% Russian501 0.9% Polish473 0.9% British459 0.9% Greek245 0.5% Eastern European208 0.4% Jamaican198 0.4% Swedish156 0.3% Lithuanian149 0.3% Welsh131 0.2% Lebanese107 0.2% Romanian105 0.2% Dutch94 0.2% Norwegian90 0.2% Albanian82 0.2% Northern European80 0.2% Portuguese79 0.1% Czech74 0.1% Austrian67 0.1% French Canadian58 0.1% African57 0.1% Brazilian54 0.1% Scandinavian54 0.1% Nigerian52 0.10% Danish46 0.09% Jordanian37 0.07% Swiss35 0.07% Finnish33 0.06% Palestinian27 0.05% Belgian24 0.05% Slovene23 0.04% South African21 0.04% Slovak16 0.03% Turkish11 0.02% Israeli11 0.02% Iranian11 0.02% Canadian10 0.02% Croatian10 0.02% Ethiopian9 0.02% Hungarian4 0.01% Celtic4 0.01% Barbadian3 0.01% Bulgarian
Geographical mobility in Asheville Same house 1 year ago 63,242 83.5% White (Caucasian)7,859 82.7% Black or African American104 44.2% American Indian / Alaska Native1,164 78.5% Asian505 100.0% Native Hawaiian / Pacific Islander1,549 72.1% Other race5,641 88.1% Two or more races63,138 83.5% White alone, not Hispanic / Latino5,403 89.4% Hispanic or LatinoMoved within same county 4,565 6.0% White / Caucasian395 4.2% Black or African American86 36.7% American Indian / Alaska Native89 6.0% Asian134 6.2% Other race271 4.2% Two or more races4,565 6.0% White alone, not Hispanic / Latino261 4.3% Hispanic or LatinoMoved within same state 3,398 4.5% White / Caucasian1,102 11.6% Black or African American78 5.2% Asian370 17.2% Other race369 5.8% Two or more races3,375 4.5% White alone, not Hispanic / Latino180 3.0% Hispanic or LatinoMoved from different state 4,295 5.7% White / Caucasian148 1.6% Black or African American103 6.9% Asian117 5.5% Other race170 2.6% Two or more races4,295 5.7% White alone, not Hispanic / Latino354 5.9% Hispanic or LatinoMoved from abroad 204 0.3% White29 1.9% Asian204 0.3% White alone, not Hispanic / Latino6 0.1% Hispanic or Latino
Children Nativity (place of birth) in Asheville
Children under 6 years - Living with two parents Both parents native 1,913 100.0% NativeBoth parents foreign-born 400 76.3% Native124 23.7% Foreign-bornOne native, one foreign-born parent 344 100.0% NativeChildren under 6 years - Living with one parent Native parent 2,119 100.0% NativeForeign-born parent 80 100.0% NativeChildren 6 to 17 years - Living with two parents Both parents native 4,537 100.0% NativeBoth parents foreign-born 464 51.9% Native429 48.1% Foreign-bornOne native, one foreign-born parent 368 99.2% Native3 0.8% Foreign-bornChildren 6 to 17 years - Living with one parent Native parent 3,953 99.0% Native38 1.0% Foreign-bornForeign-born parent 138 66.3% Native70 33.7% Foreign-born
Grandparents responsible for own grandchildren in Asheville
Grandparents (30 to 59 years) White / Caucasian 10 11.5% Responsible for grandchildren74 88.5% Not responsible for grandchildrenBlack or African American 170 71.0% Responsible for grandchildren69 29.0% Not responsible for grandchildrenOther race 50 100.0% Not responsible for grandchildrenWhite alone, not Hispanic / Latino 10 9.7% Responsible for grandchildren89 90.3% Not responsible for grandchildrenHispanic or Latino 44 100.0% Not responsible for grandchildrenGrandparents (60 years and over) White / Caucasian 31 16.6% Responsible for grandchildren155 83.4% Not responsible for grandchildrenBlack or African American 31 17.7% Responsible for grandchildren145 82.3% Not responsible for grandchildrenWhite alone, not Hispanic / Latino 31 16.6% Responsible for grandchildren155 83.4% Not responsible for grandchildren