Races in Attleboro, Massachusetts (MA) Detailed Stats
Data:
Races - White alone (%)
Races - White alone (% change since 2000)
Races - Black alone (%)
Races - Black alone (% change since 2000)
Races - American Indian alone (%)
Races - American Indian alone (% change since 2000)
Races - Asian alone (%)
Races - Asian alone (% change since 2000)
Races - Hispanic (%)
Races - Hispanic (% change since 2000)
Races - Native Hawaiian and Other Pacific Islander alone (%)
Races - Native Hawaiian and Other Pacific Islander alone (% change since 2000)
Races - Two or more races(%)
Races - Two or more races(% change since 2000)
Races - Other race alone (%)
Races - Other race alone (% change since 2000)
Racial diversity
Place of birth - Born in state of residence (%)
Place of birth - Born in state of residence (%) - White
Place of birth - Born in state of residence (%) - Black or African American
Place of birth - Born in state of residence (%) - Asian
Place of birth - Born in state of residence (%) - Hispanic or Latino
Place of birth - Born in state of residence (%) - American Indian and Alaska Native
Place of birth - Born in state of residence (%) - Multirace
Place of birth - Born in state of residence (%) - Other Race
Place of birth - Born in other state (%)
Place of birth - Born in other state (%) - White
Place of birth - Born in other state (%) - Black or African American
Place of birth - Born in other state (%) - Asian
Place of birth - Born in other state (%) - Hispanic or Latino
Place of birth - Born in other state (%) - American Indian and Alaska Native
Place of birth - Born in other state (%) - Multirace
Place of birth - Born in other state (%) - Other Race
Place of birth - Native, outside of US (%)
Place of birth - Native, outside of US (%) - White
Place of birth - Native, outside of US (%) - Black or African American
Place of birth - Native, outside of US (%) - Asian
Place of birth - Native, outside of US (%) - Hispanic or Latino
Place of birth - Native, outside of US (%) - American Indian and Alaska Native
Place of birth - Native, outside of US (%) - Multirace
Place of birth - Native, outside of US (%) - Other Race
Place of birth - Foreign born (%)
Place of birth - Foreign born (%) - White
Place of birth - Foreign born (%) - Black or African American
Place of birth - Foreign born (%) - Asian
Place of birth - Foreign born (%) - Hispanic or Latino
Place of birth - Foreign born (%) - American Indian and Alaska Native
Place of birth - Foreign born (%) - Multirace
Place of birth - Foreign born (%) - Other Race
Residents speaking English at home (%)
Residents speaking English at home - Born in the United States (%)
Residents speaking English at home - Native, born elsewhere (%)
Residents speaking English at home - Foreign born (%)
Residents speaking Spanish at home (%)
Residents speaking Spanish at home - Born in the United States (%)
Residents speaking Spanish at home - Native, born elsewhere (%)
Residents speaking Spanish at home - Foreign born (%)
Residents speaking other language at home (%)
Residents speaking other language at home - Born in the United States (%)
Residents speaking other language at home - Native, born elsewhere (%)
Residents speaking other language at home - Foreign born (%)
Marital status - Never married (%)
Marital status - Now married (%)
Marital status - Separated (%)
Marital status - Widowed (%)
Marital status - Divorced (%)
Ancestries Reported - Arab (%)
Ancestries Reported - Czech (%)
Ancestries Reported - Danish (%)
Ancestries Reported - Dutch (%)
Ancestries Reported - English (%)
Ancestries Reported - French (%)
Ancestries Reported - French Canadian (%)
Ancestries Reported - German (%)
Ancestries Reported - Greek (%)
Ancestries Reported - Hungarian (%)
Ancestries Reported - Irish (%)
Ancestries Reported - Italian (%)
Ancestries Reported - Lithuanian (%)
Ancestries Reported - Norwegian (%)
Ancestries Reported - Polish (%)
Ancestries Reported - Portuguese (%)
Ancestries Reported - Russian (%)
Ancestries Reported - Scotch-Irish (%)
Ancestries Reported - Scottish (%)
Ancestries Reported - Slovak (%)
Ancestries Reported - Subsaharan African (%)
Ancestries Reported - Swedish (%)
Ancestries Reported - Swiss (%)
Ancestries Reported - Ukrainian (%)
Ancestries Reported - United States (%)
Ancestries Reported - Welsh (%)
Ancestries Reported - West Indian (%)
Ancestries Reported - Other (%)
Geographical mobility - Same house 1 year ago (%)
Geographical mobility - Same house 1 year ago (%) - White
Geographical mobility - Same house 1 year ago (%) - Black or African American
Geographical mobility - Same house 1 year ago (%) - Asian
Geographical mobility - Same house 1 year ago (%) - Hispanic or Latino
Geographical mobility - Same house 1 year ago (%) - American Indian and Alaska Native
Geographical mobility - Same house 1 year ago (%) - Multirace
Geographical mobility - Same house 1 year ago (%) - Other Race
Geographical mobility - Moved within same county (%)
Geographical mobility - Moved within same county (%) - White
Geographical mobility - Moved within same county (%) - Black or African American
Geographical mobility - Moved within same county (%) - Asian
Geographical mobility - Moved within same county (%) - Hispanic or Latino
Geographical mobility - Moved within same county (%) - American Indian and Alaska Native
Geographical mobility - Moved within same county (%) - Multirace
Geographical mobility - Moved within same county (%) - Other Race
Geographical mobility - Moved from different county within same state (%)
Geographical mobility - Moved from different county within same state (%) - White
Geographical mobility - Moved from different county within same state (%) - Black or African American
Geographical mobility - Moved from different county within same state (%) - Asian
Geographical mobility - Moved from different county within same state (%) - Hispanic or Latino
Geographical mobility - Moved from different county within same state (%) - American Indian and Alaska Native
Geographical mobility - Moved from different county within same state (%) - Multirace
Geographical mobility - Moved from different county within same state (%) - Other Race
Geographical mobility - Moved from different state (%)
Geographical mobility - Moved from different state (%) - White
Geographical mobility - Moved from different state (%) - Black or African American
Geographical mobility - Moved from different state (%) - Asian
Geographical mobility - Moved from different state (%) - Hispanic or Latino
Geographical mobility - Moved from different state (%) - American Indian and Alaska Native
Geographical mobility - Moved from different state (%) - Multirace
Geographical mobility - Moved from different state (%) - Other Race
Geographical mobility - Moved from abroad (%)
Geographical mobility - Moved from abroad (%) - White
Geographical mobility - Moved from abroad (%) - Black or African American
Geographical mobility - Moved from abroad (%) - Asian
Geographical mobility - Moved from abroad (%) - Hispanic or Latino
Geographical mobility - Moved from abroad (%) - American Indian and Alaska Native
Geographical mobility - Moved from abroad (%) - Multirace
Geographical mobility - Moved from abroad (%) - Other Race
Place of birth for the foreign-born population - Ireland (%)
Place of birth for the foreign-born population - Denmark (%)
Place of birth for the foreign-born population - Norway (%)
Place of birth for the foreign-born population - Sweden (%)
Place of birth for the foreign-born population - United Kingdom (%)
Place of birth for the foreign-born population - England (%)
Place of birth for the foreign-born population - Scotland (%)
Place of birth for the foreign-born population - Other Northern Europe (%)
Place of birth for the foreign-born population - Austria (%)
Place of birth for the foreign-born population - Belgium (%)
Place of birth for the foreign-born population - France (%)
Place of birth for the foreign-born population - Germany (%)
Place of birth for the foreign-born population - Netherlands (%)
Place of birth for the foreign-born population - Switzerland (%)
Place of birth for the foreign-born population - Other Western Europe (%)
Place of birth for the foreign-born population - Greece (%)
Place of birth for the foreign-born population - Italy (%)
Place of birth for the foreign-born population - Portugal (%)
Place of birth for the foreign-born population - Spain (%)
Place of birth for the foreign-born population - Other Southern Europe (%)
Place of birth for the foreign-born population - Albania (%)
Place of birth for the foreign-born population - Belarus (%)
Place of birth for the foreign-born population - Bosnia and Herzegovina (%)
Place of birth for the foreign-born population - Bulgaria (%)
Place of birth for the foreign-born population - Croatia (%)
Place of birth for the foreign-born population - Czechoslovakia (%)
Place of birth for the foreign-born population - Hungary (%)
Place of birth for the foreign-born population - Latvia (%)
Place of birth for the foreign-born population - Lithuania (%)
Place of birth for the foreign-born population - North Macedonia (Macedonia) (%)
Place of birth for the foreign-born population - Moldova (%)
Place of birth for the foreign-born population - Poland (%)
Place of birth for the foreign-born population - Romania (%)
Place of birth for the foreign-born population - Russia (%)
Place of birth for the foreign-born population - Serbia (%)
Place of birth for the foreign-born population - Ukraine (%)
Place of birth for the foreign-born population - Other Eastern Europe (%)
Place of birth for the foreign-born population - China (%)
Place of birth for the foreign-born population - Hong Kong (%)
Place of birth for the foreign-born population - Taiwan (%)
Place of birth for the foreign-born population - Japan (%)
Place of birth for the foreign-born population - Korea (%)
Place of birth for the foreign-born population - Other Eastern Asia (%)
Place of birth for the foreign-born population - Afghanistan (%)
Place of birth for the foreign-born population - Bangladesh (%)
Place of birth for the foreign-born population - India (%)
Place of birth for the foreign-born population - Iran (%)
Place of birth for the foreign-born population - Kazakhstan (%)
Place of birth for the foreign-born population - Nepal (%)
Place of birth for the foreign-born population - Pakistan (%)
Place of birth for the foreign-born population - Sri Lanka (%)
Place of birth for the foreign-born population - Uzbekistan (%)
Place of birth for the foreign-born population - Other South Central Asia (%)
Place of birth for the foreign-born population - Burma (%)
Place of birth for the foreign-born population - Cambodia (%)
Place of birth for the foreign-born population - Indonesia (%)
Place of birth for the foreign-born population - Laos (%)
Place of birth for the foreign-born population - Malaysia (%)
Place of birth for the foreign-born population - Philippines (%)
Place of birth for the foreign-born population - Singapore (%)
Place of birth for the foreign-born population - Thailand (%)
Place of birth for the foreign-born population - Vietnam (%)
Place of birth for the foreign-born population - Other South Eastern Asia (%)
Place of birth for the foreign-born population - Armenia (%)
Place of birth for the foreign-born population - Iraq (%)
Place of birth for the foreign-born population - Israel (%)
Place of birth for the foreign-born population - Jordan (%)
Place of birth for the foreign-born population - Kuwait (%)
Place of birth for the foreign-born population - Lebanon (%)
Place of birth for the foreign-born population - Saudi Arabia (%)
Place of birth for the foreign-born population - Syria (%)
Place of birth for the foreign-born population - Turkey (%)
Place of birth for the foreign-born population - Yemen (%)
Place of birth for the foreign-born population - Other Western Asia (%)
Place of birth for the foreign-born population - Eritrea (%)
Place of birth for the foreign-born population - Ethiopia (%)
Place of birth for the foreign-born population - Kenya (%)
Place of birth for the foreign-born population - Somalia (%)
Place of birth for the foreign-born population - Uganda (%)
Place of birth for the foreign-born population - Zimbabwe (%)
Place of birth for the foreign-born population - Other Eastern Africa (%)
Place of birth for the foreign-born population - Cameroon (%)
Place of birth for the foreign-born population - Congo (%)
Place of birth for the foreign-born population - Democratic Republic of Congo (Zaire) (%)
Place of birth for the foreign-born population - Other Middle Africa (%)
Place of birth for the foreign-born population - Egypt (%)
Place of birth for the foreign-born population - Morocco (%)
Place of birth for the foreign-born population - Sudan (%)
Place of birth for the foreign-born population - Other Northern Africa (%)
Place of birth for the foreign-born population - South Africa (%)
Place of birth for the foreign-born population - Other Southern Africa (%)
Place of birth for the foreign-born population - Cabo Verde (%)
Place of birth for the foreign-born population - Ghana (%)
Place of birth for the foreign-born population - Liberia (%)
Place of birth for the foreign-born population - Nigeria (%)
Place of birth for the foreign-born population - Senegal (%)
Place of birth for the foreign-born population - Sierra Leone (%)
Place of birth for the foreign-born population - Other Western Africa (%)
Place of birth for the foreign-born population - Australia (%)
Place of birth for the foreign-born population - New Zealand (%)
Place of birth for the foreign-born population - Fiji (%)
Place of birth for the foreign-born population - Micronesia (%)
Place of birth for the foreign-born population - Bahamas (%)
Place of birth for the foreign-born population - Barbados (%)
Place of birth for the foreign-born population - Cuba (%)
Place of birth for the foreign-born population - Dominica (%)
Place of birth for the foreign-born population - Dominican Republic (%)
Place of birth for the foreign-born population - Grenada (%)
Place of birth for the foreign-born population - Haiti (%)
Place of birth for the foreign-born population - Jamaica (%)
Place of birth for the foreign-born population - St. Vincent and the Grenadines (%)
Place of birth for the foreign-born population - Trinidad and Tobago (%)
Place of birth for the foreign-born population - West Indies (%)
Place of birth for the foreign-born population - Other Caribbean (%)
Place of birth for the foreign-born population - Belize (%)
Place of birth for the foreign-born population - Costa Rica (%)
Place of birth for the foreign-born population - El Salvador (%)
Place of birth for the foreign-born population - Guatemala (%)
Place of birth for the foreign-born population - Honduras (%)
Place of birth for the foreign-born population - Mexico (%)
Place of birth for the foreign-born population - Nicaragua (%)
Place of birth for the foreign-born population - Panama (%)
Place of birth for the foreign-born population - Other Central America (%)
Place of birth for the foreign-born population - Argentina (%)
Place of birth for the foreign-born population - Bolivia (%)
Place of birth for the foreign-born population - Brazil (%)
Place of birth for the foreign-born population - Chile (%)
Place of birth for the foreign-born population - Colombia (%)
Place of birth for the foreign-born population - Ecuador (%)
Place of birth for the foreign-born population - Guyana (%)
Place of birth for the foreign-born population - Peru (%)
Place of birth for the foreign-born population - Uruguay (%)
Place of birth for the foreign-born population - Venezuela (%)
Place of birth for the foreign-born population - Other South America (%)
Place of birth for the foreign-born population - Canada (%)
Place of birth for the foreign-born population - Other Northern America (%)
Place of birth for the foreign-born population - Other (%)
Latest news about races in Attleboro, MA collected exclusively by city-data.com from local newspapers, TV, and radio stations
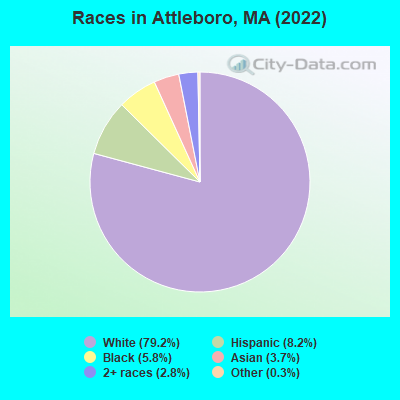
According to 2022 data, the most numerous races in Attleboro, MA are White alone (36,934 residents), Hispanic (3,838 residents), and Asian alone (1,727 residents). 86.9% of Attleboro residents speak English at home. 10.8% of Attleboro, MA residents are foreign-born (3.9% born in Latin America, 2.7% born in Europe, 2.4% born in Asia), which is 66.6% less than the foreign-born rate of 18.0% across the entire state of Massachusetts.
Race distribution in Attleboro
2000 2022
5,198,359 81.9% White alone 428,729 6.8% Hispanic 318,329 5.0% Black alone 236,786 3.7% Asian alone 110,338 1.7% Two or more races 43,586 0.7% Other race alone 11,264 0.2% American Indian alone 1,706 0.03% Native Hawaiian and Other
4,676,627 67.0% White alone 911,038 13.0% Hispanic 501,463 7.2% Asian alone 459,740 6.6% Black alone 341,889 4.9% Two or more races 84,403 1.2% Other race alone 5,838 0.08% American Indian alone 976 0.01% Native Hawaiian and Other
Income and house value in Attleboro Median household income in 2022 $93,583 White non-Hispanic householders$69,241 Black householders$143,081 Asian householders$79,572 Two or more races householders$74,077 Hispanic or Latino race householdersMedian 2022 house value $441,618 White Non-Hispanic householders$443,640 Black or African American householders $469,346 Asian householders$363,634 Some other race householders$443,640 Two or more races householders$387,607 Hispanic or Latino householders
Median age by race in Attleboro
42.6 Median age for White residents41.8 43.9 26.1 Median age for Black or African American residents23.6 27.1 -539,325,842.2 Median age for American Indian / Alaska Native residents-545,905,706.7 -495,433,789.5 38.4 Median age for Asian residents34.4 42.7 -319,845,857.1 Median age for Native Hawaiian / Pacific Islander residents-666,666,666.0 -508,717,948.2 29.4 Median age for Other race residents24.3 32.7 37.9 Median age for Two or more races residents44.0 34.0 43.0 Median age for White alone residents41.7 44.1 29.0 Median age for Hispanic or Latino residents29.3 29.4
Owner/renter occupied households by race in Attleboro
House owners and renters - White residents 10,695 68.5% Owner occupied4,910 31.5% Renter occupiedHouse owners and renters - Black or African American residents 557 58.3% Owner occupied398 41.7% Renter occupiedHouse owners and renters - American Indian / Alaska Native residents 3 100.0% Renter occupiedHouse owners and renters - Asian residents 248 49.1% Owner occupied257 50.9% Renter occupiedHouse owners and renters - Native Hawaiian / Pacific Islander residents 49 100.0% Owner occupiedHouse owners and renters - Other race residents 85 23.3% Owner occupied279 76.7% Renter occupiedHouse owners and renters - Two or more races residents 407 58.2% Owner occupied292 41.8% Renter occupiedHouse owners and renters - White alone residents 10,626 69.2% Owner occupied4,738 30.8% Renter occupiedHouse owners and renters - Hispanic or Latino residents 277 27.6% Owner occupied724 72.4% Renter occupied
Language usage in Attleboro
English speakers - Total 86.9% of residents of Attleboro speak English at home.
4.5% of residents speak Spanish at home 1,104 57.1% Speak English very well830 42.9% Speak English less than very well9.0% of residents speak other language at home 2,188 56.4% Speak English very well1,689 43.6% Speak English less than very well
English speakers - Born in the United States 95.9% of residents of Attleboro speak English at home.
2.2% of residents speak Spanish at home 202 72.4% Speak English very well77 27.6% Speak English less than very well2.0% of residents speak other language at home 236 92.5% Speak English very well19 7.5% Speak English less than very well
English speakers - Native, born elsewhere 50.8% of residents of Attleboro speak English at home.
44.6% of residents speak Spanish at home 126 58.3% Speak English very well90 41.7% Speak English less than very well7.2% of residents speak other language at home 35 100.0% Speak English very well
English speakers - Foreign-born 19.6% of residents of Attleboro speak English at home.
21.6% of residents speak Spanish at home 420 38.8% Speak English very well663 61.2% Speak English less than very well59.3% of residents speak other language at home 1,410 47.4% Speak English very well1,565 52.6% Speak English less than very well
White (Caucasian) - Speak only English Native:
98.7% (32,854)Foreign-born:
24.9% (551)
White (Caucasian) - Speak another language Native:
2.5% (817)Foreign-born:
75.8% (1,679)
Black or African American - Speak only English Native:
88.9% (1,632)Foreign-born:
30.3% (205)
Black or African American - Speak another language Native:
11.6% (213)Foreign-born:
64.2% (435)
Asian - Speak only English Native:
73.2% (322)Foreign-born:
9.9% (101)
Asian - Speak another language Native:
28.1% (124)Foreign-born:
90.1% (924)
Other race - Speak only English Native:
46.8% (384)Foreign-born:
4.3% (22)
Other race - Speak another language Native:
52.9% (434)Foreign-born:
94.8% (493)
Two or more races - Speak only English Native:
81.5% (1,297)Foreign-born:
12.1% (68)
Two or more races - Speak another language Native:
12.2% (195)Foreign-born:
87.8% (494)
White alone - Speak only English Native:
99.1% (32,574)Foreign-born:
29.3% (545)
White alone - Speak another language Native:
1.8% (600)Foreign-born:
71.8% (1,332)
Hispanic or Latino - Speak only English Native:
59.8% (1,274)Foreign-born:
6.3% (81)
Hispanic or Latino - Speak another language Native:
42.7% (909)Foreign-born:
91.5% (1,164)
Foreign-born residents in Attleboro 5,042 residents are foreign born (3.9% Latin America , 2.7% Europe , 2.4% Asia ).
This city:
10.8%Massachusetts:
17.6%
Marital status for residents in Attleboro Marital status - White (Caucasian) population 15 years and over
Males 34.3% Never married49.1% Now married0.6% Separated3.6% Widowed12.4% DivorcedFemales 26.0% Never married47.7% Now married1.4% Separated10.8% Widowed14.0% DivorcedWomen who gave birth in the past 12 months Now married:
91.1% (482)Unmarried:
8.9% (47)
Women who did not give birth in the past 12 months Now married:
43.9% (3,350)Unmarried:
56.1% (4,286)
Marital status - Black or African American population 15 years and over
Males 49.6% Never married35.5% Now married7.7% Separated0.0% Widowed7.2% DivorcedFemales 57.5% Never married20.5% Now married7.3% Separated6.5% Widowed8.2% DivorcedWomen who gave birth in the past 12 months Now married:
0.0% (0)Unmarried:
100.0% (117)
Women who did not give birth in the past 12 months Now married:
23.3% (161)Unmarried:
76.7% (531)
Marital status - Asian population 15 years and over
Males 12.1% Never married85.9% Now married0.0% Separated2.0% Widowed0.0% DivorcedFemales 17.7% Never married65.2% Now married0.0% Separated11.1% Widowed6.0% DivorcedWomen who gave birth in the past 12 months Now married:
100.0% (68)Unmarried:
0.0% (0)
Women who did not give birth in the past 12 months Now married:
55.7% (255)Unmarried:
44.3% (203)
Marital status - Other race population 15 years and over
Males 34.4% Never married43.0% Now married2.0% Separated7.8% Widowed12.7% DivorcedFemales 46.8% Never married21.5% Now married11.3% Separated9.2% Widowed11.2% DivorcedWomen who did not give birth in the past 12 months Now married:
38.5% (181)Unmarried:
61.5% (289)
Marital status - Two or more races population 15 years and over
Males 47.3% Never married46.9% Now married3.2% Separated1.3% Widowed1.3% DivorcedFemales 13.3% Never married51.0% Now married1.9% Separated8.1% Widowed25.7% DivorcedWomen who did not give birth in the past 12 months Now married:
53.7% (242)Unmarried:
46.3% (208)
Marital status - White alone, not Hispanic / Latino population 15 years and over
Males 33.8% Never married49.0% Now married0.6% Separated3.7% Widowed12.9% DivorcedFemales 25.9% Never married47.2% Now married1.3% Separated11.2% Widowed14.3% DivorcedWomen who gave birth in the past 12 months Now married:
91.0% (483)Unmarried:
9.0% (48)
Women who did not give birth in the past 12 months Now married:
42.6% (3,146)Unmarried:
57.4% (4,235)
Marital status - Hispanic or Latino population 15 years and over
Males 44.6% Never married46.7% Now married0.7% Separated4.0% Widowed4.1% DivorcedFemales 36.1% Never married41.4% Now married7.9% Separated5.0% Widowed9.7% DivorcedWomen who gave birth in the past 12 months Now married:
32.1% (10)Unmarried:
67.9% (21)
Women who did not give birth in the past 12 months Now married:
51.0% (525)Unmarried:
49.0% (504)
Ancestries in Attleboro
3,155 15.2% Irish1,730 8.3% English1,703 8.2% Portuguese1,560 7.5% Italian1,199 5.8% French1,143 5.5% French Canadian995 4.8% American892 4.3% Polish634 3.0% German384 1.8% Brazilian286 1.4% Egyptian227 1.1% Haitian207 1.0% Cape Verdean197 0.9% Scottish195 0.9% European143 0.7% African129 0.6% Russian109 0.5% Ukrainian103 0.5% Czech97 0.5% Swedish84 0.4% Jamaican78 0.4% Armenian71 0.3% Greek67 0.3% Albanian64 0.3% Jordanian61 0.3% Syrian58 0.3% Arab56 0.3% Canadian43 0.2% Eastern European39 0.2% Moroccan39 0.2% Lebanese37 0.2% Serbian36 0.2% Danish34 0.2% Lithuanian31 0.1% Scotch-Irish29 0.1% West Indian27 0.1% Yugoslavian24 0.1% Norwegian23 0.1% Dutch22 0.1% Scandinavian22 0.1% Senegalese12 0.06% Austrian12 0.06% British West Indian9 0.04% Pennsylvania German3 0.01% Welsh2 0.01% British
Geographical mobility in Attleboro Same house 1 year ago 35,073 94.1% White (Caucasian)2,593 97.5% Black or African American15 100.0% American Indian / Alaska Native1,576 98.0% Asian45 100.0% Native Hawaiian / Pacific Islander1,103 78.2% Other race2,266 90.3% Two or more races34,390 94.3% White alone, not Hispanic / Latino3,207 84.7% Hispanic or LatinoMoved within same county 927 2.5% White / Caucasian73 2.8% Black or African American24 1.5% Asian278 19.7% Other race111 4.4% Two or more races901 2.5% White alone, not Hispanic / Latino339 9.0% Hispanic or LatinoMoved within same state 848 2.3% White / Caucasian6 0.2% Black or African American0 0.0% Other race1 0.0% Two or more races832 2.3% White alone, not Hispanic / Latino27 0.7% Hispanic or LatinoMoved from different state 456 1.2% White / Caucasian2 0.1% Black or African American13 0.8% Asian78 5.5% Other race107 4.2% Two or more races453 1.2% White alone, not Hispanic / Latino155 4.1% Hispanic or LatinoMoved from abroad 99 0.3% White42 0.1% White alone, not Hispanic / Latino44 1.2% Hispanic or Latino
Children Nativity (place of birth) in Attleboro
Children under 6 years - Living with two parents Both parents native 2,119 100.0% NativeBoth parents foreign-born 362 100.0% NativeOne native, one foreign-born parent 109 100.0% NativeChildren under 6 years - Living with one parent Native parent 988 100.0% NativeForeign-born parent 47 55.6% Native37 44.4% Foreign-bornChildren 6 to 17 years - Living with two parents Both parents native 2,914 100.0% NativeBoth parents foreign-born 521 84.9% Native93 15.1% Foreign-bornOne native, one foreign-born parent 242 100.0% NativeChildren 6 to 17 years - Living with one parent Native parent 1,632 100.0% NativeForeign-born parent 550 51.1% Native526 48.9% Foreign-born
Grandparents responsible for own grandchildren in Attleboro
Grandparents (30 to 59 years) White / Caucasian 8 3.6% Responsible for grandchildren208 96.4% Not responsible for grandchildrenBlack or African American 25 100.0% Not responsible for grandchildrenOther race 42 100.0% Not responsible for grandchildrenWhite alone, not Hispanic / Latino 8 3.5% Responsible for grandchildren208 96.5% Not responsible for grandchildrenHispanic or Latino 27 100.0% Not responsible for grandchildrenGrandparents (60 years and over) White / Caucasian 98 26.2% Responsible for grandchildren276 73.8% Not responsible for grandchildrenBlack or African American 31 58.9% Responsible for grandchildren22 41.1% Not responsible for grandchildrenOther race 45 100.0% Not responsible for grandchildrenWhite alone, not Hispanic / Latino 99 27.4% Responsible for grandchildren262 72.6% Not responsible for grandchildrenHispanic or Latino 67 100.0% Not responsible for grandchildren