Races in Balmville, New York (NY) Detailed Stats
Data:
Races - White alone (%)
Races - White alone (% change since 2000)
Races - Black alone (%)
Races - Black alone (% change since 2000)
Races - American Indian alone (%)
Races - American Indian alone (% change since 2000)
Races - Asian alone (%)
Races - Asian alone (% change since 2000)
Races - Hispanic (%)
Races - Hispanic (% change since 2000)
Races - Native Hawaiian and Other Pacific Islander alone (%)
Races - Native Hawaiian and Other Pacific Islander alone (% change since 2000)
Races - Two or more races(%)
Races - Two or more races(% change since 2000)
Races - Other race alone (%)
Races - Other race alone (% change since 2000)
Racial diversity
Place of birth - Born in state of residence (%)
Place of birth - Born in state of residence (%) - White
Place of birth - Born in state of residence (%) - Black or African American
Place of birth - Born in state of residence (%) - Asian
Place of birth - Born in state of residence (%) - Hispanic or Latino
Place of birth - Born in state of residence (%) - American Indian and Alaska Native
Place of birth - Born in state of residence (%) - Multirace
Place of birth - Born in state of residence (%) - Other Race
Place of birth - Born in other state (%)
Place of birth - Born in other state (%) - White
Place of birth - Born in other state (%) - Black or African American
Place of birth - Born in other state (%) - Asian
Place of birth - Born in other state (%) - Hispanic or Latino
Place of birth - Born in other state (%) - American Indian and Alaska Native
Place of birth - Born in other state (%) - Multirace
Place of birth - Born in other state (%) - Other Race
Place of birth - Native, outside of US (%)
Place of birth - Native, outside of US (%) - White
Place of birth - Native, outside of US (%) - Black or African American
Place of birth - Native, outside of US (%) - Asian
Place of birth - Native, outside of US (%) - Hispanic or Latino
Place of birth - Native, outside of US (%) - American Indian and Alaska Native
Place of birth - Native, outside of US (%) - Multirace
Place of birth - Native, outside of US (%) - Other Race
Place of birth - Foreign born (%)
Place of birth - Foreign born (%) - White
Place of birth - Foreign born (%) - Black or African American
Place of birth - Foreign born (%) - Asian
Place of birth - Foreign born (%) - Hispanic or Latino
Place of birth - Foreign born (%) - American Indian and Alaska Native
Place of birth - Foreign born (%) - Multirace
Place of birth - Foreign born (%) - Other Race
Residents speaking English at home (%)
Residents speaking English at home - Born in the United States (%)
Residents speaking English at home - Native, born elsewhere (%)
Residents speaking English at home - Foreign born (%)
Residents speaking Spanish at home (%)
Residents speaking Spanish at home - Born in the United States (%)
Residents speaking Spanish at home - Native, born elsewhere (%)
Residents speaking Spanish at home - Foreign born (%)
Residents speaking other language at home (%)
Residents speaking other language at home - Born in the United States (%)
Residents speaking other language at home - Native, born elsewhere (%)
Residents speaking other language at home - Foreign born (%)
Marital status - Never married (%)
Marital status - Now married (%)
Marital status - Separated (%)
Marital status - Widowed (%)
Marital status - Divorced (%)
Ancestries Reported - Arab (%)
Ancestries Reported - Czech (%)
Ancestries Reported - Danish (%)
Ancestries Reported - Dutch (%)
Ancestries Reported - English (%)
Ancestries Reported - French (%)
Ancestries Reported - French Canadian (%)
Ancestries Reported - German (%)
Ancestries Reported - Greek (%)
Ancestries Reported - Hungarian (%)
Ancestries Reported - Irish (%)
Ancestries Reported - Italian (%)
Ancestries Reported - Lithuanian (%)
Ancestries Reported - Norwegian (%)
Ancestries Reported - Polish (%)
Ancestries Reported - Portuguese (%)
Ancestries Reported - Russian (%)
Ancestries Reported - Scotch-Irish (%)
Ancestries Reported - Scottish (%)
Ancestries Reported - Slovak (%)
Ancestries Reported - Subsaharan African (%)
Ancestries Reported - Swedish (%)
Ancestries Reported - Swiss (%)
Ancestries Reported - Ukrainian (%)
Ancestries Reported - United States (%)
Ancestries Reported - Welsh (%)
Ancestries Reported - West Indian (%)
Ancestries Reported - Other (%)
Geographical mobility - Same house 1 year ago (%)
Geographical mobility - Same house 1 year ago (%) - White
Geographical mobility - Same house 1 year ago (%) - Black or African American
Geographical mobility - Same house 1 year ago (%) - Asian
Geographical mobility - Same house 1 year ago (%) - Hispanic or Latino
Geographical mobility - Same house 1 year ago (%) - American Indian and Alaska Native
Geographical mobility - Same house 1 year ago (%) - Multirace
Geographical mobility - Same house 1 year ago (%) - Other Race
Geographical mobility - Moved within same county (%)
Geographical mobility - Moved within same county (%) - White
Geographical mobility - Moved within same county (%) - Black or African American
Geographical mobility - Moved within same county (%) - Asian
Geographical mobility - Moved within same county (%) - Hispanic or Latino
Geographical mobility - Moved within same county (%) - American Indian and Alaska Native
Geographical mobility - Moved within same county (%) - Multirace
Geographical mobility - Moved within same county (%) - Other Race
Geographical mobility - Moved from different county within same state (%)
Geographical mobility - Moved from different county within same state (%) - White
Geographical mobility - Moved from different county within same state (%) - Black or African American
Geographical mobility - Moved from different county within same state (%) - Asian
Geographical mobility - Moved from different county within same state (%) - Hispanic or Latino
Geographical mobility - Moved from different county within same state (%) - American Indian and Alaska Native
Geographical mobility - Moved from different county within same state (%) - Multirace
Geographical mobility - Moved from different county within same state (%) - Other Race
Geographical mobility - Moved from different state (%)
Geographical mobility - Moved from different state (%) - White
Geographical mobility - Moved from different state (%) - Black or African American
Geographical mobility - Moved from different state (%) - Asian
Geographical mobility - Moved from different state (%) - Hispanic or Latino
Geographical mobility - Moved from different state (%) - American Indian and Alaska Native
Geographical mobility - Moved from different state (%) - Multirace
Geographical mobility - Moved from different state (%) - Other Race
Geographical mobility - Moved from abroad (%)
Geographical mobility - Moved from abroad (%) - White
Geographical mobility - Moved from abroad (%) - Black or African American
Geographical mobility - Moved from abroad (%) - Asian
Geographical mobility - Moved from abroad (%) - Hispanic or Latino
Geographical mobility - Moved from abroad (%) - American Indian and Alaska Native
Geographical mobility - Moved from abroad (%) - Multirace
Geographical mobility - Moved from abroad (%) - Other Race
Place of birth for the foreign-born population - Ireland (%)
Place of birth for the foreign-born population - Denmark (%)
Place of birth for the foreign-born population - Norway (%)
Place of birth for the foreign-born population - Sweden (%)
Place of birth for the foreign-born population - United Kingdom (%)
Place of birth for the foreign-born population - England (%)
Place of birth for the foreign-born population - Scotland (%)
Place of birth for the foreign-born population - Other Northern Europe (%)
Place of birth for the foreign-born population - Austria (%)
Place of birth for the foreign-born population - Belgium (%)
Place of birth for the foreign-born population - France (%)
Place of birth for the foreign-born population - Germany (%)
Place of birth for the foreign-born population - Netherlands (%)
Place of birth for the foreign-born population - Switzerland (%)
Place of birth for the foreign-born population - Other Western Europe (%)
Place of birth for the foreign-born population - Greece (%)
Place of birth for the foreign-born population - Italy (%)
Place of birth for the foreign-born population - Portugal (%)
Place of birth for the foreign-born population - Spain (%)
Place of birth for the foreign-born population - Other Southern Europe (%)
Place of birth for the foreign-born population - Albania (%)
Place of birth for the foreign-born population - Belarus (%)
Place of birth for the foreign-born population - Bosnia and Herzegovina (%)
Place of birth for the foreign-born population - Bulgaria (%)
Place of birth for the foreign-born population - Croatia (%)
Place of birth for the foreign-born population - Czechoslovakia (%)
Place of birth for the foreign-born population - Hungary (%)
Place of birth for the foreign-born population - Latvia (%)
Place of birth for the foreign-born population - Lithuania (%)
Place of birth for the foreign-born population - North Macedonia (Macedonia) (%)
Place of birth for the foreign-born population - Moldova (%)
Place of birth for the foreign-born population - Poland (%)
Place of birth for the foreign-born population - Romania (%)
Place of birth for the foreign-born population - Russia (%)
Place of birth for the foreign-born population - Serbia (%)
Place of birth for the foreign-born population - Ukraine (%)
Place of birth for the foreign-born population - Other Eastern Europe (%)
Place of birth for the foreign-born population - China (%)
Place of birth for the foreign-born population - Hong Kong (%)
Place of birth for the foreign-born population - Taiwan (%)
Place of birth for the foreign-born population - Japan (%)
Place of birth for the foreign-born population - Korea (%)
Place of birth for the foreign-born population - Other Eastern Asia (%)
Place of birth for the foreign-born population - Afghanistan (%)
Place of birth for the foreign-born population - Bangladesh (%)
Place of birth for the foreign-born population - India (%)
Place of birth for the foreign-born population - Iran (%)
Place of birth for the foreign-born population - Kazakhstan (%)
Place of birth for the foreign-born population - Nepal (%)
Place of birth for the foreign-born population - Pakistan (%)
Place of birth for the foreign-born population - Sri Lanka (%)
Place of birth for the foreign-born population - Uzbekistan (%)
Place of birth for the foreign-born population - Other South Central Asia (%)
Place of birth for the foreign-born population - Burma (%)
Place of birth for the foreign-born population - Cambodia (%)
Place of birth for the foreign-born population - Indonesia (%)
Place of birth for the foreign-born population - Laos (%)
Place of birth for the foreign-born population - Malaysia (%)
Place of birth for the foreign-born population - Philippines (%)
Place of birth for the foreign-born population - Singapore (%)
Place of birth for the foreign-born population - Thailand (%)
Place of birth for the foreign-born population - Vietnam (%)
Place of birth for the foreign-born population - Other South Eastern Asia (%)
Place of birth for the foreign-born population - Armenia (%)
Place of birth for the foreign-born population - Iraq (%)
Place of birth for the foreign-born population - Israel (%)
Place of birth for the foreign-born population - Jordan (%)
Place of birth for the foreign-born population - Kuwait (%)
Place of birth for the foreign-born population - Lebanon (%)
Place of birth for the foreign-born population - Saudi Arabia (%)
Place of birth for the foreign-born population - Syria (%)
Place of birth for the foreign-born population - Turkey (%)
Place of birth for the foreign-born population - Yemen (%)
Place of birth for the foreign-born population - Other Western Asia (%)
Place of birth for the foreign-born population - Eritrea (%)
Place of birth for the foreign-born population - Ethiopia (%)
Place of birth for the foreign-born population - Kenya (%)
Place of birth for the foreign-born population - Somalia (%)
Place of birth for the foreign-born population - Uganda (%)
Place of birth for the foreign-born population - Zimbabwe (%)
Place of birth for the foreign-born population - Other Eastern Africa (%)
Place of birth for the foreign-born population - Cameroon (%)
Place of birth for the foreign-born population - Congo (%)
Place of birth for the foreign-born population - Democratic Republic of Congo (Zaire) (%)
Place of birth for the foreign-born population - Other Middle Africa (%)
Place of birth for the foreign-born population - Egypt (%)
Place of birth for the foreign-born population - Morocco (%)
Place of birth for the foreign-born population - Sudan (%)
Place of birth for the foreign-born population - Other Northern Africa (%)
Place of birth for the foreign-born population - South Africa (%)
Place of birth for the foreign-born population - Other Southern Africa (%)
Place of birth for the foreign-born population - Cabo Verde (%)
Place of birth for the foreign-born population - Ghana (%)
Place of birth for the foreign-born population - Liberia (%)
Place of birth for the foreign-born population - Nigeria (%)
Place of birth for the foreign-born population - Senegal (%)
Place of birth for the foreign-born population - Sierra Leone (%)
Place of birth for the foreign-born population - Other Western Africa (%)
Place of birth for the foreign-born population - Australia (%)
Place of birth for the foreign-born population - New Zealand (%)
Place of birth for the foreign-born population - Fiji (%)
Place of birth for the foreign-born population - Micronesia (%)
Place of birth for the foreign-born population - Bahamas (%)
Place of birth for the foreign-born population - Barbados (%)
Place of birth for the foreign-born population - Cuba (%)
Place of birth for the foreign-born population - Dominica (%)
Place of birth for the foreign-born population - Dominican Republic (%)
Place of birth for the foreign-born population - Grenada (%)
Place of birth for the foreign-born population - Haiti (%)
Place of birth for the foreign-born population - Jamaica (%)
Place of birth for the foreign-born population - St. Vincent and the Grenadines (%)
Place of birth for the foreign-born population - Trinidad and Tobago (%)
Place of birth for the foreign-born population - West Indies (%)
Place of birth for the foreign-born population - Other Caribbean (%)
Place of birth for the foreign-born population - Belize (%)
Place of birth for the foreign-born population - Costa Rica (%)
Place of birth for the foreign-born population - El Salvador (%)
Place of birth for the foreign-born population - Guatemala (%)
Place of birth for the foreign-born population - Honduras (%)
Place of birth for the foreign-born population - Mexico (%)
Place of birth for the foreign-born population - Nicaragua (%)
Place of birth for the foreign-born population - Panama (%)
Place of birth for the foreign-born population - Other Central America (%)
Place of birth for the foreign-born population - Argentina (%)
Place of birth for the foreign-born population - Bolivia (%)
Place of birth for the foreign-born population - Brazil (%)
Place of birth for the foreign-born population - Chile (%)
Place of birth for the foreign-born population - Colombia (%)
Place of birth for the foreign-born population - Ecuador (%)
Place of birth for the foreign-born population - Guyana (%)
Place of birth for the foreign-born population - Peru (%)
Place of birth for the foreign-born population - Uruguay (%)
Place of birth for the foreign-born population - Venezuela (%)
Place of birth for the foreign-born population - Other South America (%)
Place of birth for the foreign-born population - Canada (%)
Place of birth for the foreign-born population - Other Northern America (%)
Place of birth for the foreign-born population - Other (%)
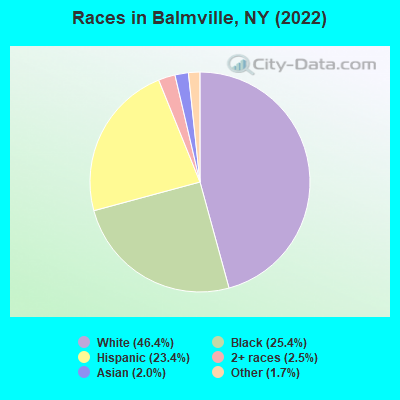
According to 2022 data, the most numerous races in Balmville, NY are White alone (1,773 residents), Hispanic (896 residents), and Black alone (971 residents). 71.6% of Balmville residents speak English at home. 21.7% of Balmville, NY residents are foreign-born (16.4% born in Latin America, 2.9% born in Europe, 2.5% born in Asia), which is about the same as the foreign-born rate of 22.0% across the entire state of New York.
Race distribution in Balmville
2000 2022
11,760,981 62.0% White alone 2,867,583 15.1% Hispanic 2,812,623 14.8% Black alone 1,035,926 5.5% Asian alone 366,116 1.9% Two or more races 75,499 0.4% Other race alone 52,499 0.3% American Indian alone 5,230 0.03% Native Hawaiian and Other
10,408,933 52.9% White alone 3,867,299 19.7% Hispanic 2,633,840 13.4% Black alone 1,776,286 9.0% Asian alone 732,670 3.7% Two or more races 216,110 1.1% Other race alone 35,082 0.2% American Indian alone 6,931 0.04% Native Hawaiian and Other
Income and house value in Balmville Median household income in 2022 $114,593 White non-Hispanic householders$80,959 Black householders$109,216 Some other race householders$84,855 Hispanic or Latino race householdersMedian 2022 house value $391,346 White Non-Hispanic householders$370,185 Black or African American householders $287,370 Asian householders$435,497 Some other race householders$125,920 Two or more races householders$452,216 Hispanic or Latino householders
Median age by race in Balmville
51.4 Median age for White residents47.1 57.8 48.7 Median age for Black or African American residents49.1 48.1 -671,929,823.9 Median age for American Indian / Alaska Native residents-677,083,332.7 -603,603,603.0 53.5 Median age for Asian residents58.9 47.8 9.2 Median age for Native Hawaiian / Pacific Islander residents-477,502,295.2 -497,387,669.3 31.5 Median age for Other race residents12.1 55.9 34.0 Median age for Two or more races residents29.0 42.1 50.2 Median age for White alone residents46.3 55.9 32.8 Median age for Hispanic or Latino residents25.7 37.0
Owner/renter occupied households by race in Balmville
House owners and renters - White residents 603 80.1% Owner occupied150 19.9% Renter occupiedHouse owners and renters - Black or African American residents 195 54.7% Owner occupied162 45.3% Renter occupiedHouse owners and renters - Asian residents 5 22.0% Owner occupied16 78.0% Renter occupiedHouse owners and renters - Other race residents 54 71.2% Owner occupied22 28.8% Renter occupiedHouse owners and renters - Two or more races residents 123 95.4% Owner occupied6 4.6% Renter occupiedHouse owners and renters - White alone residents 615 82.4% Owner occupied131 17.6% Renter occupiedHouse owners and renters - Hispanic or Latino residents 131 58.1% Owner occupied95 41.9% Renter occupied
Language usage in Balmville
English speakers - Total 71.6% of residents of Balmville speak English at home.
13.6% of residents speak Spanish at home 295 58.8% Speak English very well207 41.2% Speak English less than very well14.2% of residents speak other language at home 343 65.6% Speak English very well180 34.4% Speak English less than very well
English speakers - Born in the United States 98.5% of residents of Balmville speak English at home.
2.4% of residents speak other language at home 8 100.0% Speak English very well
English speakers - Native, born elsewhere 75.3% of residents of Balmville speak English at home.
20.5% of residents speak other language at home 30 100.0% Speak English very well
English speakers - Foreign-born 19.3% of residents of Balmville speak English at home.
37.8% of residents speak Spanish at home 146 45.2% Speak English very well177 54.8% Speak English less than very well41.9% of residents speak other language at home 210 58.7% Speak English very well148 41.3% Speak English less than very well
White (Caucasian) - Speak only English Native:
91.5% (1,431)Foreign-born:
9.2% (11)
White (Caucasian) - Speak another language Native:
5.8% (90)Foreign-born:
78.9% (97)
Black or African American - Speak only English Native:
96.8% (713)Foreign-born:
23.1% (63)
Asian - Speak only English Native:
90.3% (34)Foreign-born:
14.9% (9)
Asian - Speak another language Native:
16.6% (6)Foreign-born:
84.9% (49)
Other race - Speak only English Native:
44.7% (74)Foreign-born:
70.6% (67)
Other race - Speak another language Native:
55.1% (91)Foreign-born:
50.5% (48)
Two or more races - Speak only English Native:
64.1% (225)Foreign-born:
6.9% (30)
Two or more races - Speak another language Native:
37.0% (129)Foreign-born:
95.6% (411)
White alone - Speak only English Native:
89.5% (1,412)Foreign-born:
7.6% (11)
White alone - Speak another language Native:
6.8% (107)Foreign-born:
85.3% (124)
Hispanic or Latino - Speak only English Native:
58.9% (272)Foreign-born:
18.4% (72)
Hispanic or Latino - Speak another language Native:
40.9% (189)Foreign-born:
78.9% (309)
Foreign-born residents in Balmville 830 residents are foreign born (16.4% Latin America , 2.9% Europe , 2.5% Asia ).
This city:
21.7%New York:
22.6%
Marital status for residents in Balmville Marital status - White (Caucasian) population 15 years and over
Males 23.2% Never married60.7% Now married0.0% Separated1.5% Widowed14.6% DivorcedFemales 19.8% Never married48.5% Now married2.0% Separated16.4% Widowed13.2% DivorcedWomen who did not give birth in the past 12 months Now married:
49.0% (128)Unmarried:
51.0% (133)
Marital status - Black or African American population 15 years and over
Males 29.7% Never married48.7% Now married11.2% Separated0.0% Widowed10.4% DivorcedFemales 58.5% Never married28.9% Now married7.7% Separated2.8% Widowed2.0% DivorcedWomen who did not give birth in the past 12 months Now married:
28.5% (87)Unmarried:
71.5% (219)
Marital status - Asian population 15 years and over
Males 36.8% Never married63.2% Now married0.0% Separated0.0% Widowed0.0% DivorcedFemales 42.9% Never married57.1% Now married0.0% Separated0.0% Widowed0.0% DivorcedWomen who did not give birth in the past 12 months Now married:
30.8% (4)Unmarried:
69.2% (10)
Marital status - Other race population 15 years and over
Males 68.3% Never married31.7% Now married0.0% Separated0.0% Widowed0.0% DivorcedFemales 23.9% Never married76.1% Now married0.0% Separated0.0% Widowed0.0% DivorcedWomen who did not give birth in the past 12 months Now married:
40.7% (15)Unmarried:
59.3% (21)
Marital status - Two or more races population 15 years and over
Males 56.4% Never married41.3% Now married0.0% Separated0.0% Widowed2.3% DivorcedFemales 27.8% Never married64.6% Now married0.0% Separated7.6% Widowed0.0% DivorcedWomen who did not give birth in the past 12 months Now married:
61.4% (97)Unmarried:
38.6% (61)
Marital status - White alone, not Hispanic / Latino population 15 years and over
Males 23.2% Never married60.7% Now married0.0% Separated1.5% Widowed14.6% DivorcedFemales 20.8% Never married46.9% Now married2.1% Separated16.3% Widowed13.8% DivorcedWomen who did not give birth in the past 12 months Now married:
49.0% (137)Unmarried:
51.0% (142)
Marital status - Hispanic or Latino population 15 years and over
Males 64.6% Never married35.4% Now married0.0% Separated0.0% Widowed0.0% DivorcedFemales 19.8% Never married77.1% Now married0.0% Separated3.1% Widowed0.0% DivorcedWomen who did not give birth in the past 12 months Now married:
60.9% (86)Unmarried:
39.1% (55)
Ancestries in Balmville
232 11.0% Jamaican140 6.6% Irish101 4.8% Italian87 4.1% American39 1.8% Lebanese30 1.4% British29 1.4% Albanian22 1.0% Eastern European16 0.8% French13 0.6% European12 0.6% Cypriot12 0.6% English12 0.6% Turkish10 0.5% Polish8 0.4% French Canadian8 0.4% Romanian6 0.3% Northern European5 0.2% Austrian
Children Nativity (place of birth) in Balmville
Children under 6 years - Living with two parents Both parents native 31 100.0% NativeBoth parents foreign-born 23 100.0% NativeChildren under 6 years - Living with one parent Native parent 52 100.0% NativeForeign-born parent 55 100.0% Foreign-bornChildren 6 to 17 years - Living with two parents Both parents native 86 100.0% NativeBoth parents foreign-born 30 100.0% NativeOne native, one foreign-born parent 30 100.0% NativeChildren 6 to 17 years - Living with one parent Native parent 188 83.9% Native36 16.1% Foreign-bornForeign-born parent 161 68.4% Native74 31.6% Foreign-born
Grandparents responsible for own grandchildren in Balmville
Grandparents (30 to 59 years) White / Caucasian 21 100.0% Not responsible for grandchildrenBlack or African American 24 100.0% Responsible for grandchildrenOther race 41 100.0% Not responsible for grandchildrenTwo or more races 19 100.0% Not responsible for grandchildrenWhite alone, not Hispanic / Latino 27 100.0% Not responsible for grandchildrenHispanic or Latino 42 100.0% Not responsible for grandchildren
Grandparents (60 years and over) White / Caucasian 39 100.0% Not responsible for grandchildrenBlack or African American 52 100.0% Not responsible for grandchildrenOther race 9 100.0% Responsible for grandchildrenTwo or more races 66 100.0% Responsible for grandchildrenWhite alone, not Hispanic / Latino 40 100.0% Not responsible for grandchildrenHispanic or Latino 52 100.0% Responsible for grandchildren