Races in Bell, California (CA) Detailed Stats
Data:
Races - White alone (%)
Races - White alone (% change since 2000)
Races - Black alone (%)
Races - Black alone (% change since 2000)
Races - American Indian alone (%)
Races - American Indian alone (% change since 2000)
Races - Asian alone (%)
Races - Asian alone (% change since 2000)
Races - Hispanic (%)
Races - Hispanic (% change since 2000)
Races - Native Hawaiian and Other Pacific Islander alone (%)
Races - Native Hawaiian and Other Pacific Islander alone (% change since 2000)
Races - Two or more races(%)
Races - Two or more races(% change since 2000)
Races - Other race alone (%)
Races - Other race alone (% change since 2000)
Racial diversity
Place of birth - Born in state of residence (%)
Place of birth - Born in state of residence (%) - White
Place of birth - Born in state of residence (%) - Black or African American
Place of birth - Born in state of residence (%) - Asian
Place of birth - Born in state of residence (%) - Hispanic or Latino
Place of birth - Born in state of residence (%) - American Indian and Alaska Native
Place of birth - Born in state of residence (%) - Multirace
Place of birth - Born in state of residence (%) - Other Race
Place of birth - Born in other state (%)
Place of birth - Born in other state (%) - White
Place of birth - Born in other state (%) - Black or African American
Place of birth - Born in other state (%) - Asian
Place of birth - Born in other state (%) - Hispanic or Latino
Place of birth - Born in other state (%) - American Indian and Alaska Native
Place of birth - Born in other state (%) - Multirace
Place of birth - Born in other state (%) - Other Race
Place of birth - Native, outside of US (%)
Place of birth - Native, outside of US (%) - White
Place of birth - Native, outside of US (%) - Black or African American
Place of birth - Native, outside of US (%) - Asian
Place of birth - Native, outside of US (%) - Hispanic or Latino
Place of birth - Native, outside of US (%) - American Indian and Alaska Native
Place of birth - Native, outside of US (%) - Multirace
Place of birth - Native, outside of US (%) - Other Race
Place of birth - Foreign born (%)
Place of birth - Foreign born (%) - White
Place of birth - Foreign born (%) - Black or African American
Place of birth - Foreign born (%) - Asian
Place of birth - Foreign born (%) - Hispanic or Latino
Place of birth - Foreign born (%) - American Indian and Alaska Native
Place of birth - Foreign born (%) - Multirace
Place of birth - Foreign born (%) - Other Race
Residents speaking English at home (%)
Residents speaking English at home - Born in the United States (%)
Residents speaking English at home - Native, born elsewhere (%)
Residents speaking English at home - Foreign born (%)
Residents speaking Spanish at home (%)
Residents speaking Spanish at home - Born in the United States (%)
Residents speaking Spanish at home - Native, born elsewhere (%)
Residents speaking Spanish at home - Foreign born (%)
Residents speaking other language at home (%)
Residents speaking other language at home - Born in the United States (%)
Residents speaking other language at home - Native, born elsewhere (%)
Residents speaking other language at home - Foreign born (%)
Marital status - Never married (%)
Marital status - Now married (%)
Marital status - Separated (%)
Marital status - Widowed (%)
Marital status - Divorced (%)
Ancestries Reported - Arab (%)
Ancestries Reported - Czech (%)
Ancestries Reported - Danish (%)
Ancestries Reported - Dutch (%)
Ancestries Reported - English (%)
Ancestries Reported - French (%)
Ancestries Reported - French Canadian (%)
Ancestries Reported - German (%)
Ancestries Reported - Greek (%)
Ancestries Reported - Hungarian (%)
Ancestries Reported - Irish (%)
Ancestries Reported - Italian (%)
Ancestries Reported - Lithuanian (%)
Ancestries Reported - Norwegian (%)
Ancestries Reported - Polish (%)
Ancestries Reported - Portuguese (%)
Ancestries Reported - Russian (%)
Ancestries Reported - Scotch-Irish (%)
Ancestries Reported - Scottish (%)
Ancestries Reported - Slovak (%)
Ancestries Reported - Subsaharan African (%)
Ancestries Reported - Swedish (%)
Ancestries Reported - Swiss (%)
Ancestries Reported - Ukrainian (%)
Ancestries Reported - United States (%)
Ancestries Reported - Welsh (%)
Ancestries Reported - West Indian (%)
Ancestries Reported - Other (%)
Geographical mobility - Same house 1 year ago (%)
Geographical mobility - Same house 1 year ago (%) - White
Geographical mobility - Same house 1 year ago (%) - Black or African American
Geographical mobility - Same house 1 year ago (%) - Asian
Geographical mobility - Same house 1 year ago (%) - Hispanic or Latino
Geographical mobility - Same house 1 year ago (%) - American Indian and Alaska Native
Geographical mobility - Same house 1 year ago (%) - Multirace
Geographical mobility - Same house 1 year ago (%) - Other Race
Geographical mobility - Moved within same county (%)
Geographical mobility - Moved within same county (%) - White
Geographical mobility - Moved within same county (%) - Black or African American
Geographical mobility - Moved within same county (%) - Asian
Geographical mobility - Moved within same county (%) - Hispanic or Latino
Geographical mobility - Moved within same county (%) - American Indian and Alaska Native
Geographical mobility - Moved within same county (%) - Multirace
Geographical mobility - Moved within same county (%) - Other Race
Geographical mobility - Moved from different county within same state (%)
Geographical mobility - Moved from different county within same state (%) - White
Geographical mobility - Moved from different county within same state (%) - Black or African American
Geographical mobility - Moved from different county within same state (%) - Asian
Geographical mobility - Moved from different county within same state (%) - Hispanic or Latino
Geographical mobility - Moved from different county within same state (%) - American Indian and Alaska Native
Geographical mobility - Moved from different county within same state (%) - Multirace
Geographical mobility - Moved from different county within same state (%) - Other Race
Geographical mobility - Moved from different state (%)
Geographical mobility - Moved from different state (%) - White
Geographical mobility - Moved from different state (%) - Black or African American
Geographical mobility - Moved from different state (%) - Asian
Geographical mobility - Moved from different state (%) - Hispanic or Latino
Geographical mobility - Moved from different state (%) - American Indian and Alaska Native
Geographical mobility - Moved from different state (%) - Multirace
Geographical mobility - Moved from different state (%) - Other Race
Geographical mobility - Moved from abroad (%)
Geographical mobility - Moved from abroad (%) - White
Geographical mobility - Moved from abroad (%) - Black or African American
Geographical mobility - Moved from abroad (%) - Asian
Geographical mobility - Moved from abroad (%) - Hispanic or Latino
Geographical mobility - Moved from abroad (%) - American Indian and Alaska Native
Geographical mobility - Moved from abroad (%) - Multirace
Geographical mobility - Moved from abroad (%) - Other Race
Place of birth for the foreign-born population - Ireland (%)
Place of birth for the foreign-born population - Denmark (%)
Place of birth for the foreign-born population - Norway (%)
Place of birth for the foreign-born population - Sweden (%)
Place of birth for the foreign-born population - United Kingdom (%)
Place of birth for the foreign-born population - England (%)
Place of birth for the foreign-born population - Scotland (%)
Place of birth for the foreign-born population - Other Northern Europe (%)
Place of birth for the foreign-born population - Austria (%)
Place of birth for the foreign-born population - Belgium (%)
Place of birth for the foreign-born population - France (%)
Place of birth for the foreign-born population - Germany (%)
Place of birth for the foreign-born population - Netherlands (%)
Place of birth for the foreign-born population - Switzerland (%)
Place of birth for the foreign-born population - Other Western Europe (%)
Place of birth for the foreign-born population - Greece (%)
Place of birth for the foreign-born population - Italy (%)
Place of birth for the foreign-born population - Portugal (%)
Place of birth for the foreign-born population - Spain (%)
Place of birth for the foreign-born population - Other Southern Europe (%)
Place of birth for the foreign-born population - Albania (%)
Place of birth for the foreign-born population - Belarus (%)
Place of birth for the foreign-born population - Bosnia and Herzegovina (%)
Place of birth for the foreign-born population - Bulgaria (%)
Place of birth for the foreign-born population - Croatia (%)
Place of birth for the foreign-born population - Czechoslovakia (%)
Place of birth for the foreign-born population - Hungary (%)
Place of birth for the foreign-born population - Latvia (%)
Place of birth for the foreign-born population - Lithuania (%)
Place of birth for the foreign-born population - North Macedonia (Macedonia) (%)
Place of birth for the foreign-born population - Moldova (%)
Place of birth for the foreign-born population - Poland (%)
Place of birth for the foreign-born population - Romania (%)
Place of birth for the foreign-born population - Russia (%)
Place of birth for the foreign-born population - Serbia (%)
Place of birth for the foreign-born population - Ukraine (%)
Place of birth for the foreign-born population - Other Eastern Europe (%)
Place of birth for the foreign-born population - China (%)
Place of birth for the foreign-born population - Hong Kong (%)
Place of birth for the foreign-born population - Taiwan (%)
Place of birth for the foreign-born population - Japan (%)
Place of birth for the foreign-born population - Korea (%)
Place of birth for the foreign-born population - Other Eastern Asia (%)
Place of birth for the foreign-born population - Afghanistan (%)
Place of birth for the foreign-born population - Bangladesh (%)
Place of birth for the foreign-born population - India (%)
Place of birth for the foreign-born population - Iran (%)
Place of birth for the foreign-born population - Kazakhstan (%)
Place of birth for the foreign-born population - Nepal (%)
Place of birth for the foreign-born population - Pakistan (%)
Place of birth for the foreign-born population - Sri Lanka (%)
Place of birth for the foreign-born population - Uzbekistan (%)
Place of birth for the foreign-born population - Other South Central Asia (%)
Place of birth for the foreign-born population - Burma (%)
Place of birth for the foreign-born population - Cambodia (%)
Place of birth for the foreign-born population - Indonesia (%)
Place of birth for the foreign-born population - Laos (%)
Place of birth for the foreign-born population - Malaysia (%)
Place of birth for the foreign-born population - Philippines (%)
Place of birth for the foreign-born population - Singapore (%)
Place of birth for the foreign-born population - Thailand (%)
Place of birth for the foreign-born population - Vietnam (%)
Place of birth for the foreign-born population - Other South Eastern Asia (%)
Place of birth for the foreign-born population - Armenia (%)
Place of birth for the foreign-born population - Iraq (%)
Place of birth for the foreign-born population - Israel (%)
Place of birth for the foreign-born population - Jordan (%)
Place of birth for the foreign-born population - Kuwait (%)
Place of birth for the foreign-born population - Lebanon (%)
Place of birth for the foreign-born population - Saudi Arabia (%)
Place of birth for the foreign-born population - Syria (%)
Place of birth for the foreign-born population - Turkey (%)
Place of birth for the foreign-born population - Yemen (%)
Place of birth for the foreign-born population - Other Western Asia (%)
Place of birth for the foreign-born population - Eritrea (%)
Place of birth for the foreign-born population - Ethiopia (%)
Place of birth for the foreign-born population - Kenya (%)
Place of birth for the foreign-born population - Somalia (%)
Place of birth for the foreign-born population - Uganda (%)
Place of birth for the foreign-born population - Zimbabwe (%)
Place of birth for the foreign-born population - Other Eastern Africa (%)
Place of birth for the foreign-born population - Cameroon (%)
Place of birth for the foreign-born population - Congo (%)
Place of birth for the foreign-born population - Democratic Republic of Congo (Zaire) (%)
Place of birth for the foreign-born population - Other Middle Africa (%)
Place of birth for the foreign-born population - Egypt (%)
Place of birth for the foreign-born population - Morocco (%)
Place of birth for the foreign-born population - Sudan (%)
Place of birth for the foreign-born population - Other Northern Africa (%)
Place of birth for the foreign-born population - South Africa (%)
Place of birth for the foreign-born population - Other Southern Africa (%)
Place of birth for the foreign-born population - Cabo Verde (%)
Place of birth for the foreign-born population - Ghana (%)
Place of birth for the foreign-born population - Liberia (%)
Place of birth for the foreign-born population - Nigeria (%)
Place of birth for the foreign-born population - Senegal (%)
Place of birth for the foreign-born population - Sierra Leone (%)
Place of birth for the foreign-born population - Other Western Africa (%)
Place of birth for the foreign-born population - Australia (%)
Place of birth for the foreign-born population - New Zealand (%)
Place of birth for the foreign-born population - Fiji (%)
Place of birth for the foreign-born population - Micronesia (%)
Place of birth for the foreign-born population - Bahamas (%)
Place of birth for the foreign-born population - Barbados (%)
Place of birth for the foreign-born population - Cuba (%)
Place of birth for the foreign-born population - Dominica (%)
Place of birth for the foreign-born population - Dominican Republic (%)
Place of birth for the foreign-born population - Grenada (%)
Place of birth for the foreign-born population - Haiti (%)
Place of birth for the foreign-born population - Jamaica (%)
Place of birth for the foreign-born population - St. Vincent and the Grenadines (%)
Place of birth for the foreign-born population - Trinidad and Tobago (%)
Place of birth for the foreign-born population - West Indies (%)
Place of birth for the foreign-born population - Other Caribbean (%)
Place of birth for the foreign-born population - Belize (%)
Place of birth for the foreign-born population - Costa Rica (%)
Place of birth for the foreign-born population - El Salvador (%)
Place of birth for the foreign-born population - Guatemala (%)
Place of birth for the foreign-born population - Honduras (%)
Place of birth for the foreign-born population - Mexico (%)
Place of birth for the foreign-born population - Nicaragua (%)
Place of birth for the foreign-born population - Panama (%)
Place of birth for the foreign-born population - Other Central America (%)
Place of birth for the foreign-born population - Argentina (%)
Place of birth for the foreign-born population - Bolivia (%)
Place of birth for the foreign-born population - Brazil (%)
Place of birth for the foreign-born population - Chile (%)
Place of birth for the foreign-born population - Colombia (%)
Place of birth for the foreign-born population - Ecuador (%)
Place of birth for the foreign-born population - Guyana (%)
Place of birth for the foreign-born population - Peru (%)
Place of birth for the foreign-born population - Uruguay (%)
Place of birth for the foreign-born population - Venezuela (%)
Place of birth for the foreign-born population - Other South America (%)
Place of birth for the foreign-born population - Canada (%)
Place of birth for the foreign-born population - Other Northern America (%)
Place of birth for the foreign-born population - Other (%)
Latest news about races in Bell, CA collected exclusively by city-data.com from local newspapers, TV, and radio stations
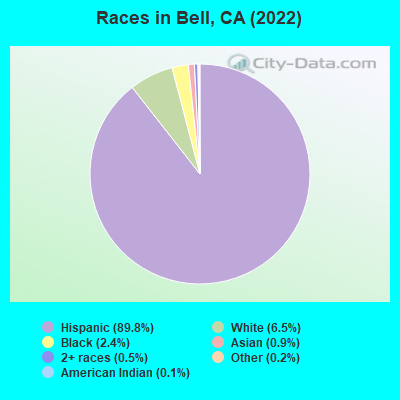
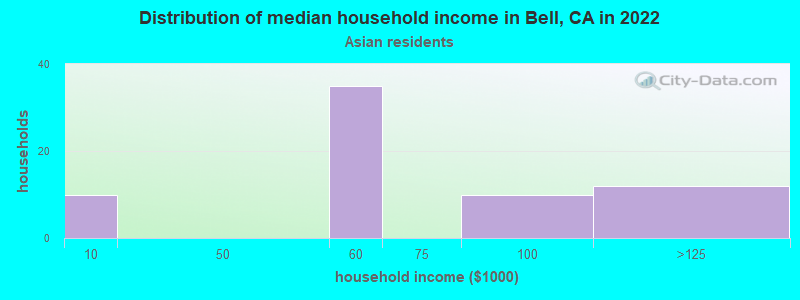
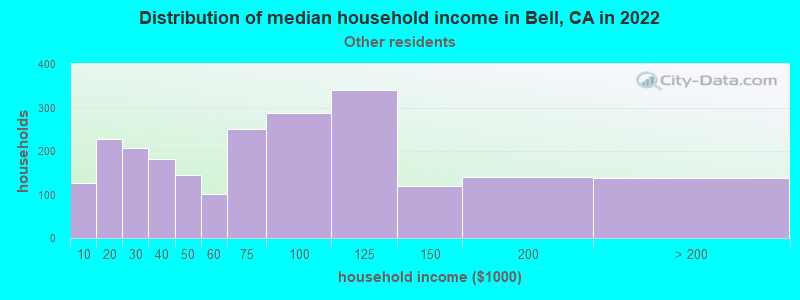
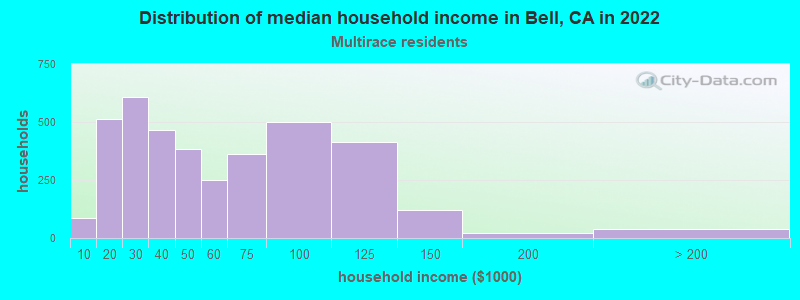
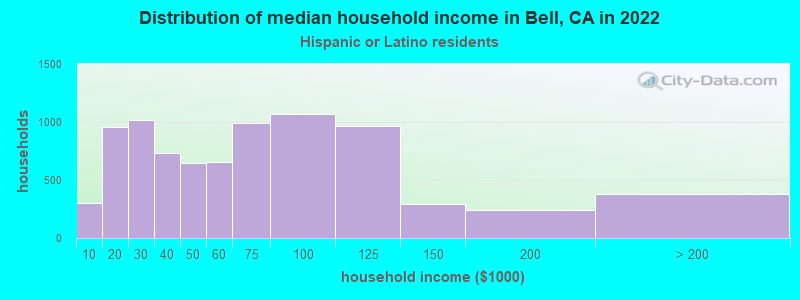
According to 2022 data, the most numerous races in Bell, CA are Hispanic (33,369 residents), White alone (1,706 residents), and Asian alone (197 residents). 10.7% of Bell residents speak English at home. 42.1% of Bell, CA residents are foreign-born (39.7% born in Latin America), which is 38.2% greater than the foreign-born rate of 26.0% across the entire state of California.
Race distribution in Bell
2000 2022
15,816,790 46.7% White alone 10,966,556 32.4% Hispanic 3,648,860 10.8% Asian alone 2,181,926 6.4% Black alone 903,115 2.7% Two or more races 178,984 0.5% American Indian alone 103,736 0.3% Native Hawaiian and Other 71,681 0.2% Other race alone
15,732,184 40.3% Hispanic 13,160,426 33.7% White alone 5,957,867 15.3% Asian alone 2,025,218 5.2% Black alone 1,663,222 4.3% Two or more races 251,618 0.6% Other race alone 135,777 0.3% Native Hawaiian and Other 103,030 0.3% American Indian alone
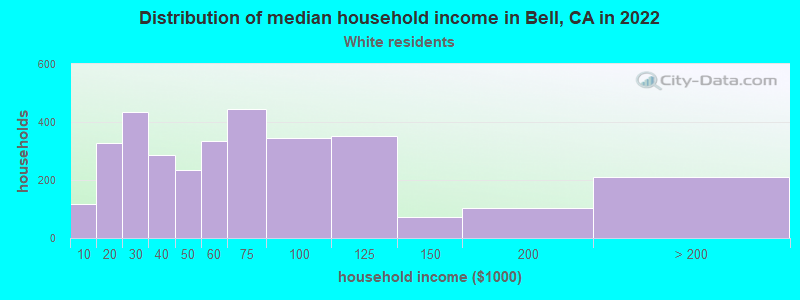
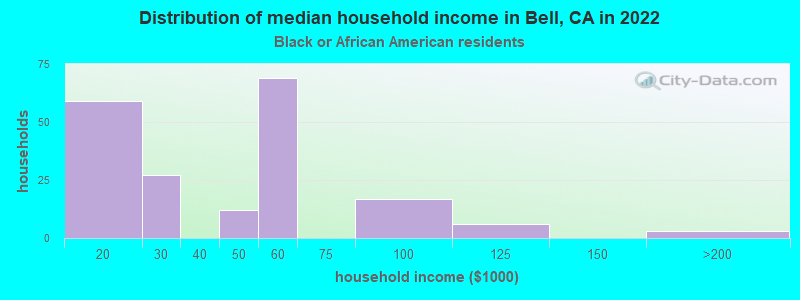
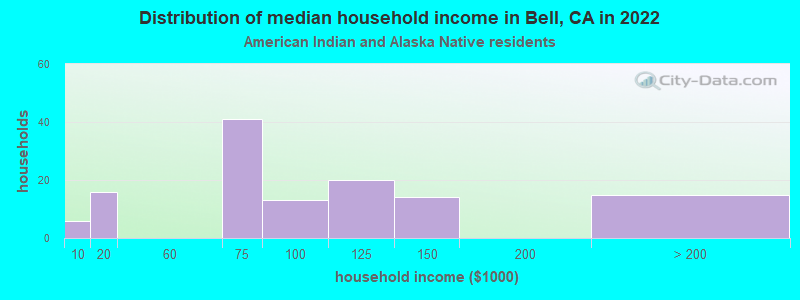
Income and house value in Bell Median household income in 2022 $38,649 White non-Hispanic householders$114,824 Black householders$187,675 American Indian and Alaska Native householders$34,104 Asian householders$96,341 Native Hawaiian and other Pacific Islander householders$62,988 Some other race householders$51,221 Two or more races householders$62,263 Hispanic or Latino race householdersMedian 2022 house value $607,561 White Non-Hispanic householders$404,920 Black or African American householders$626,997 American Indian or Alaska Native householders $537,014 Asian householders$616,559 Some other race householders$609,000 Two or more races householders$601,082 Hispanic or Latino householders
Median age by race in Bell
32.8 Median age for White residents31.3 34.3 52.4 Median age for Black or African American residents53.5 36.4 39.4 Median age for American Indian / Alaska Native residents38.6 46.5 52.9 Median age for Asian residents47.4 54.0 25.3 Median age for Native Hawaiian / Pacific Islander residents32.2 Median age for Other race residents30.6 33.1 28.9 Median age for Two or more races residents22.7 32.2 28.9 Median age for White alone residents29.6 28.5 32.5 Median age for Hispanic or Latino residents30.8 34.4
Owner/renter occupied households by race in Bell
House owners and renters - White residents 1,877 30.6% Owner occupied4,256 69.4% Renter occupiedHouse owners and renters - Black or African American residents 23 31.8% Owner occupied50 68.2% Renter occupiedHouse owners and renters - American Indian / Alaska Native residents 37 73.6% Owner occupied13 26.4% Renter occupiedHouse owners and renters - Asian residents 29 40.9% Owner occupied43 59.1% Renter occupiedHouse owners and renters - Native Hawaiian / Pacific Islander residents 33 100.0% Renter occupiedHouse owners and renters - Other race residents 520 29.0% Owner occupied1,271 71.0% Renter occupiedHouse owners and renters - Two or more races residents 193 49.1% Owner occupied200 50.9% Renter occupiedHouse owners and renters - White alone residents 133 31.4% Owner occupied290 68.6% Renter occupiedHouse owners and renters - Hispanic or Latino residents 2,733 30.9% Owner occupied6,112 69.1% Renter occupied
Language usage in Bell
English speakers - Total 10.7% of residents of Bell speak English at home.
84.4% of residents speak Spanish at home 16,321 58.5% Speak English very well11,597 41.5% Speak English less than very well3.4% of residents speak other language at home 769 68.4% Speak English very well356 31.6% Speak English less than very well
English speakers - Born in the United States 40.9% of residents of Bell speak English at home.
53.5% of residents speak Spanish at home 298 46.7% Speak English very well340 53.3% Speak English less than very well4.4% of residents speak other language at home 53 100.0% Speak English very well
English speakers - Native, born elsewhere 12.6% of residents of Bell speak English at home.
67.4% of residents speak Spanish at home 63 53.4% Speak English very well55 46.6% Speak English less than very well20.0% of residents speak other language at home 35 100.0% Speak English very well
English speakers - Foreign-born 2.3% of residents of Bell speak English at home.
90.1% of residents speak Spanish at home 3,300 25.1% Speak English very well9,852 74.9% Speak English less than very well3.9% of residents speak other language at home 265 46.6% Speak English very well304 53.4% Speak English less than very well
White (Caucasian) - Speak only English Native:
16.3% (1,990)Foreign-born:
2.4% (190)
White (Caucasian) - Speak another language Native:
66.0% (8,030)Foreign-born:
93.1% (7,240)
Black or African American - Speak another language Native:
8.0% (44)Foreign-born:
100.0% (5)
American Indian / Alaska Native - Speak only English Native:
34.2% (58)Foreign-born:
22.3% (49)
American Indian / Alaska Native - Speak another language Native:
82.2% (139)Foreign-born:
79.3% (173)
Asian - Speak another language Native:
65.3% (18)Foreign-born:
98.8% (182)
Other race - Speak only English Native:
11.1% (367)Foreign-born:
3.6% (98)
Other race - Speak another language Native:
85.9% (2,833)Foreign-born:
95.9% (2,626)
Two or more races - Speak another language Native:
100.0% (1,087)Foreign-born:
100.0% (654)
White alone - Speak another language Native:
58.9% (667)Foreign-born:
100.0% (399)
Hispanic or Latino - Speak only English Native:
13.3% (2,324)Foreign-born:
2.6% (346)
Hispanic or Latino - Speak another language Native:
84.1% (14,704)Foreign-born:
96.7% (12,905)
Foreign-born residents in Bell 14,980 residents are foreign born (39.7% Latin America ).
This city:
42.1%California:
100.0%
Marital status for residents in Bell Marital status - White (Caucasian) population 15 years and over
Males 50.6% Never married41.3% Now married1.8% Separated2.1% Widowed4.2% DivorcedFemales 43.7% Never married40.1% Now married3.7% Separated7.1% Widowed5.3% DivorcedWomen who gave birth in the past 12 months Now married:
63.2% (174)Unmarried:
36.8% (101)
Women who did not give birth in the past 12 months Now married:
38.5% (2,087)Unmarried:
61.5% (3,340)
Marital status - Black or African American population 15 years and over
Males 60.9% Never married14.8% Now married6.5% Separated2.3% Widowed15.5% DivorcedFemales 68.6% Never married0.0% Now married11.9% Separated16.1% Widowed3.4% DivorcedWomen who did not give birth in the past 12 months Now married:
0.0% (0)Unmarried:
100.0% (79)
Marital status - American Indian / Alaska Native population 15 years and over
Males 64.7% Never married19.8% Now married0.0% Separated0.0% Widowed15.5% DivorcedFemales 47.4% Never married52.6% Now married0.0% Separated0.0% Widowed0.0% DivorcedWomen who did not give birth in the past 12 months Now married:
37.8% (25)Unmarried:
62.2% (41)
Marital status - Asian population 15 years and over
Males 29.9% Never married54.5% Now married0.0% Separated0.0% Widowed15.6% DivorcedFemales 32.8% Never married27.9% Now married0.0% Separated39.3% Widowed0.0% DivorcedWomen who did not give birth in the past 12 months Now married:
47.5% (19)Unmarried:
52.5% (21)
Marital status - Native Hawaiian / Pacific Islander population 15 years and over
Males 75.6% Never married24.4% Now married0.0% Separated0.0% Widowed0.0% DivorcedFemales 0.0% Never married0.0% Now married0.0% Separated0.0% Widowed100.0% DivorcedWomen who did not give birth in the past 12 months Now married:
0.0% (0)Unmarried:
100.0% (17)
Marital status - Other race population 15 years and over
Males 50.1% Never married37.1% Now married2.2% Separated2.2% Widowed8.5% DivorcedFemales 45.4% Never married37.4% Now married6.4% Separated5.3% Widowed5.5% DivorcedWomen who gave birth in the past 12 months Now married:
19.6% (10)Unmarried:
80.4% (40)
Women who did not give birth in the past 12 months Now married:
40.0% (703)Unmarried:
60.0% (1,054)
Marital status - Two or more races population 15 years and over
Males 63.9% Never married36.1% Now married0.0% Separated0.0% Widowed0.0% DivorcedFemales 51.9% Never married30.4% Now married4.2% Separated8.4% Widowed5.1% DivorcedWomen who did not give birth in the past 12 months Now married:
30.3% (126)Unmarried:
69.7% (291)
Marital status - White alone, not Hispanic / Latino population 15 years and over
Males 48.1% Never married39.7% Now married3.1% Separated3.0% Widowed6.1% DivorcedFemales 25.9% Never married45.9% Now married2.7% Separated9.8% Widowed15.7% DivorcedWomen who gave birth in the past 12 months Now married:
100.0% (36)Unmarried:
0.0% (0)
Women who did not give birth in the past 12 months Now married:
47.8% (149)Unmarried:
52.2% (162)
Marital status - Hispanic or Latino population 15 years and over
Males 51.1% Never married40.4% Now married1.7% Separated2.0% Widowed4.7% DivorcedFemales 45.0% Never married39.2% Now married4.2% Separated6.7% Widowed4.9% DivorcedWomen who gave birth in the past 12 months Now married:
53.5% (191)Unmarried:
46.5% (166)
Women who did not give birth in the past 12 months Now married:
38.2% (3,201)Unmarried:
61.8% (5,174)
Ancestries in Bell
720 2.6% Lebanese471 1.7% American55 0.2% European35 0.1% English14 0.05% Irish14 0.05% Romanian13 0.05% British13 0.05% German13 0.05% African12 0.04% Jordanian12 0.04% Palestinian9 0.03% Slovak8 0.03% Russian7 0.02% Italian6 0.02% Basque3 0.01% Scottish
Geographical mobility in Bell Same house 1 year ago 21,901 96.3% White (Caucasian)397 70.2% Black or African American317 95.3% American Indian / Alaska Native164 75.5% Asian64 100.0% Native Hawaiian / Pacific Islander6,027 93.4% Other race1,621 100.0% Two or more races1,499 86.8% White alone, not Hispanic / Latino31,842 96.3% Hispanic or LatinoMoved within same county 860 3.8% White / Caucasian126 22.2% Black or African American22 6.5% American Indian / Alaska Native42 19.4% Asian412 6.4% Other race36 2.2% Two or more races174 10.1% White alone, not Hispanic / Latino1,275 3.9% Hispanic or LatinoMoved within same state 47 0.2% White / Caucasian10 0.2% Other race14 0.9% Two or more races30 1.7% White alone, not Hispanic / Latino52 0.2% Hispanic or LatinoMoved from different state 36 0.2% White / Caucasian31 5.5% Black or African American9 0.1% Other race20 1.2% White alone, not Hispanic / Latino28 0.1% Hispanic or LatinoMoved from abroad 51 0.2% White5 2.3% Asian13 0.2% Other race93 0.3% Hispanic or Latino
Children Nativity (place of birth) in Bell
Children under 6 years - Living with two parents Both parents native 481 99.9% Native0 0.1% Foreign-bornBoth parents foreign-born 502 94.6% Native29 5.4% Foreign-bornOne native, one foreign-born parent 697 100.0% NativeChildren under 6 years - Living with one parent Native parent 661 99.9% Native0 0.1% Foreign-bornForeign-born parent 444 96.4% Native17 3.6% Foreign-bornChildren 6 to 17 years - Living with two parents Both parents native 872 100.0% NativeBoth parents foreign-born 1,728 93.5% Native120 6.5% Foreign-bornOne native, one foreign-born parent 869 99.1% Native8 0.9% Foreign-bornChildren 6 to 17 years - Living with one parent Native parent 957 100.0% NativeForeign-born parent 1,363 53.9% Native1,167 46.1% Foreign-born
Grandparents responsible for own grandchildren in Bell
Grandparents (30 to 59 years) White / Caucasian 61 25.8% Responsible for grandchildren176 74.2% Not responsible for grandchildrenOther race 5 3.8% Responsible for grandchildren134 96.2% Not responsible for grandchildrenWhite alone, not Hispanic / Latino 11 50.2% Responsible for grandchildren11 49.8% Not responsible for grandchildrenHispanic or Latino 87 18.8% Responsible for grandchildren376 81.2% Not responsible for grandchildrenGrandparents (60 years and over) White / Caucasian 74 13.6% Responsible for grandchildren472 86.4% Not responsible for grandchildrenOther race 45 100.0% Not responsible for grandchildrenWhite alone, not Hispanic / Latino 25 77.1% Responsible for grandchildren8 22.9% Not responsible for grandchildrenHispanic or Latino 71 10.1% Responsible for grandchildren636 89.9% Not responsible for grandchildren