Races in Benton, Arkansas (AR) Detailed Stats
Data:
Races - White alone (%)
Races - White alone (% change since 2000)
Races - Black alone (%)
Races - Black alone (% change since 2000)
Races - American Indian alone (%)
Races - American Indian alone (% change since 2000)
Races - Asian alone (%)
Races - Asian alone (% change since 2000)
Races - Hispanic (%)
Races - Hispanic (% change since 2000)
Races - Native Hawaiian and Other Pacific Islander alone (%)
Races - Native Hawaiian and Other Pacific Islander alone (% change since 2000)
Races - Two or more races(%)
Races - Two or more races(% change since 2000)
Races - Other race alone (%)
Races - Other race alone (% change since 2000)
Racial diversity
Place of birth - Born in state of residence (%)
Place of birth - Born in state of residence (%) - White
Place of birth - Born in state of residence (%) - Black or African American
Place of birth - Born in state of residence (%) - Asian
Place of birth - Born in state of residence (%) - Hispanic or Latino
Place of birth - Born in state of residence (%) - American Indian and Alaska Native
Place of birth - Born in state of residence (%) - Multirace
Place of birth - Born in state of residence (%) - Other Race
Place of birth - Born in other state (%)
Place of birth - Born in other state (%) - White
Place of birth - Born in other state (%) - Black or African American
Place of birth - Born in other state (%) - Asian
Place of birth - Born in other state (%) - Hispanic or Latino
Place of birth - Born in other state (%) - American Indian and Alaska Native
Place of birth - Born in other state (%) - Multirace
Place of birth - Born in other state (%) - Other Race
Place of birth - Native, outside of US (%)
Place of birth - Native, outside of US (%) - White
Place of birth - Native, outside of US (%) - Black or African American
Place of birth - Native, outside of US (%) - Asian
Place of birth - Native, outside of US (%) - Hispanic or Latino
Place of birth - Native, outside of US (%) - American Indian and Alaska Native
Place of birth - Native, outside of US (%) - Multirace
Place of birth - Native, outside of US (%) - Other Race
Place of birth - Foreign born (%)
Place of birth - Foreign born (%) - White
Place of birth - Foreign born (%) - Black or African American
Place of birth - Foreign born (%) - Asian
Place of birth - Foreign born (%) - Hispanic or Latino
Place of birth - Foreign born (%) - American Indian and Alaska Native
Place of birth - Foreign born (%) - Multirace
Place of birth - Foreign born (%) - Other Race
Residents speaking English at home (%)
Residents speaking English at home - Born in the United States (%)
Residents speaking English at home - Native, born elsewhere (%)
Residents speaking English at home - Foreign born (%)
Residents speaking Spanish at home (%)
Residents speaking Spanish at home - Born in the United States (%)
Residents speaking Spanish at home - Native, born elsewhere (%)
Residents speaking Spanish at home - Foreign born (%)
Residents speaking other language at home (%)
Residents speaking other language at home - Born in the United States (%)
Residents speaking other language at home - Native, born elsewhere (%)
Residents speaking other language at home - Foreign born (%)
Marital status - Never married (%)
Marital status - Now married (%)
Marital status - Separated (%)
Marital status - Widowed (%)
Marital status - Divorced (%)
Ancestries Reported - Arab (%)
Ancestries Reported - Czech (%)
Ancestries Reported - Danish (%)
Ancestries Reported - Dutch (%)
Ancestries Reported - English (%)
Ancestries Reported - French (%)
Ancestries Reported - French Canadian (%)
Ancestries Reported - German (%)
Ancestries Reported - Greek (%)
Ancestries Reported - Hungarian (%)
Ancestries Reported - Irish (%)
Ancestries Reported - Italian (%)
Ancestries Reported - Lithuanian (%)
Ancestries Reported - Norwegian (%)
Ancestries Reported - Polish (%)
Ancestries Reported - Portuguese (%)
Ancestries Reported - Russian (%)
Ancestries Reported - Scotch-Irish (%)
Ancestries Reported - Scottish (%)
Ancestries Reported - Slovak (%)
Ancestries Reported - Subsaharan African (%)
Ancestries Reported - Swedish (%)
Ancestries Reported - Swiss (%)
Ancestries Reported - Ukrainian (%)
Ancestries Reported - United States (%)
Ancestries Reported - Welsh (%)
Ancestries Reported - West Indian (%)
Ancestries Reported - Other (%)
Geographical mobility - Same house 1 year ago (%)
Geographical mobility - Same house 1 year ago (%) - White
Geographical mobility - Same house 1 year ago (%) - Black or African American
Geographical mobility - Same house 1 year ago (%) - Asian
Geographical mobility - Same house 1 year ago (%) - Hispanic or Latino
Geographical mobility - Same house 1 year ago (%) - American Indian and Alaska Native
Geographical mobility - Same house 1 year ago (%) - Multirace
Geographical mobility - Same house 1 year ago (%) - Other Race
Geographical mobility - Moved within same county (%)
Geographical mobility - Moved within same county (%) - White
Geographical mobility - Moved within same county (%) - Black or African American
Geographical mobility - Moved within same county (%) - Asian
Geographical mobility - Moved within same county (%) - Hispanic or Latino
Geographical mobility - Moved within same county (%) - American Indian and Alaska Native
Geographical mobility - Moved within same county (%) - Multirace
Geographical mobility - Moved within same county (%) - Other Race
Geographical mobility - Moved from different county within same state (%)
Geographical mobility - Moved from different county within same state (%) - White
Geographical mobility - Moved from different county within same state (%) - Black or African American
Geographical mobility - Moved from different county within same state (%) - Asian
Geographical mobility - Moved from different county within same state (%) - Hispanic or Latino
Geographical mobility - Moved from different county within same state (%) - American Indian and Alaska Native
Geographical mobility - Moved from different county within same state (%) - Multirace
Geographical mobility - Moved from different county within same state (%) - Other Race
Geographical mobility - Moved from different state (%)
Geographical mobility - Moved from different state (%) - White
Geographical mobility - Moved from different state (%) - Black or African American
Geographical mobility - Moved from different state (%) - Asian
Geographical mobility - Moved from different state (%) - Hispanic or Latino
Geographical mobility - Moved from different state (%) - American Indian and Alaska Native
Geographical mobility - Moved from different state (%) - Multirace
Geographical mobility - Moved from different state (%) - Other Race
Geographical mobility - Moved from abroad (%)
Geographical mobility - Moved from abroad (%) - White
Geographical mobility - Moved from abroad (%) - Black or African American
Geographical mobility - Moved from abroad (%) - Asian
Geographical mobility - Moved from abroad (%) - Hispanic or Latino
Geographical mobility - Moved from abroad (%) - American Indian and Alaska Native
Geographical mobility - Moved from abroad (%) - Multirace
Geographical mobility - Moved from abroad (%) - Other Race
Place of birth for the foreign-born population - Ireland (%)
Place of birth for the foreign-born population - Denmark (%)
Place of birth for the foreign-born population - Norway (%)
Place of birth for the foreign-born population - Sweden (%)
Place of birth for the foreign-born population - United Kingdom (%)
Place of birth for the foreign-born population - England (%)
Place of birth for the foreign-born population - Scotland (%)
Place of birth for the foreign-born population - Other Northern Europe (%)
Place of birth for the foreign-born population - Austria (%)
Place of birth for the foreign-born population - Belgium (%)
Place of birth for the foreign-born population - France (%)
Place of birth for the foreign-born population - Germany (%)
Place of birth for the foreign-born population - Netherlands (%)
Place of birth for the foreign-born population - Switzerland (%)
Place of birth for the foreign-born population - Other Western Europe (%)
Place of birth for the foreign-born population - Greece (%)
Place of birth for the foreign-born population - Italy (%)
Place of birth for the foreign-born population - Portugal (%)
Place of birth for the foreign-born population - Spain (%)
Place of birth for the foreign-born population - Other Southern Europe (%)
Place of birth for the foreign-born population - Albania (%)
Place of birth for the foreign-born population - Belarus (%)
Place of birth for the foreign-born population - Bosnia and Herzegovina (%)
Place of birth for the foreign-born population - Bulgaria (%)
Place of birth for the foreign-born population - Croatia (%)
Place of birth for the foreign-born population - Czechoslovakia (%)
Place of birth for the foreign-born population - Hungary (%)
Place of birth for the foreign-born population - Latvia (%)
Place of birth for the foreign-born population - Lithuania (%)
Place of birth for the foreign-born population - North Macedonia (Macedonia) (%)
Place of birth for the foreign-born population - Moldova (%)
Place of birth for the foreign-born population - Poland (%)
Place of birth for the foreign-born population - Romania (%)
Place of birth for the foreign-born population - Russia (%)
Place of birth for the foreign-born population - Serbia (%)
Place of birth for the foreign-born population - Ukraine (%)
Place of birth for the foreign-born population - Other Eastern Europe (%)
Place of birth for the foreign-born population - China (%)
Place of birth for the foreign-born population - Hong Kong (%)
Place of birth for the foreign-born population - Taiwan (%)
Place of birth for the foreign-born population - Japan (%)
Place of birth for the foreign-born population - Korea (%)
Place of birth for the foreign-born population - Other Eastern Asia (%)
Place of birth for the foreign-born population - Afghanistan (%)
Place of birth for the foreign-born population - Bangladesh (%)
Place of birth for the foreign-born population - India (%)
Place of birth for the foreign-born population - Iran (%)
Place of birth for the foreign-born population - Kazakhstan (%)
Place of birth for the foreign-born population - Nepal (%)
Place of birth for the foreign-born population - Pakistan (%)
Place of birth for the foreign-born population - Sri Lanka (%)
Place of birth for the foreign-born population - Uzbekistan (%)
Place of birth for the foreign-born population - Other South Central Asia (%)
Place of birth for the foreign-born population - Burma (%)
Place of birth for the foreign-born population - Cambodia (%)
Place of birth for the foreign-born population - Indonesia (%)
Place of birth for the foreign-born population - Laos (%)
Place of birth for the foreign-born population - Malaysia (%)
Place of birth for the foreign-born population - Philippines (%)
Place of birth for the foreign-born population - Singapore (%)
Place of birth for the foreign-born population - Thailand (%)
Place of birth for the foreign-born population - Vietnam (%)
Place of birth for the foreign-born population - Other South Eastern Asia (%)
Place of birth for the foreign-born population - Armenia (%)
Place of birth for the foreign-born population - Iraq (%)
Place of birth for the foreign-born population - Israel (%)
Place of birth for the foreign-born population - Jordan (%)
Place of birth for the foreign-born population - Kuwait (%)
Place of birth for the foreign-born population - Lebanon (%)
Place of birth for the foreign-born population - Saudi Arabia (%)
Place of birth for the foreign-born population - Syria (%)
Place of birth for the foreign-born population - Turkey (%)
Place of birth for the foreign-born population - Yemen (%)
Place of birth for the foreign-born population - Other Western Asia (%)
Place of birth for the foreign-born population - Eritrea (%)
Place of birth for the foreign-born population - Ethiopia (%)
Place of birth for the foreign-born population - Kenya (%)
Place of birth for the foreign-born population - Somalia (%)
Place of birth for the foreign-born population - Uganda (%)
Place of birth for the foreign-born population - Zimbabwe (%)
Place of birth for the foreign-born population - Other Eastern Africa (%)
Place of birth for the foreign-born population - Cameroon (%)
Place of birth for the foreign-born population - Congo (%)
Place of birth for the foreign-born population - Democratic Republic of Congo (Zaire) (%)
Place of birth for the foreign-born population - Other Middle Africa (%)
Place of birth for the foreign-born population - Egypt (%)
Place of birth for the foreign-born population - Morocco (%)
Place of birth for the foreign-born population - Sudan (%)
Place of birth for the foreign-born population - Other Northern Africa (%)
Place of birth for the foreign-born population - South Africa (%)
Place of birth for the foreign-born population - Other Southern Africa (%)
Place of birth for the foreign-born population - Cabo Verde (%)
Place of birth for the foreign-born population - Ghana (%)
Place of birth for the foreign-born population - Liberia (%)
Place of birth for the foreign-born population - Nigeria (%)
Place of birth for the foreign-born population - Senegal (%)
Place of birth for the foreign-born population - Sierra Leone (%)
Place of birth for the foreign-born population - Other Western Africa (%)
Place of birth for the foreign-born population - Australia (%)
Place of birth for the foreign-born population - New Zealand (%)
Place of birth for the foreign-born population - Fiji (%)
Place of birth for the foreign-born population - Micronesia (%)
Place of birth for the foreign-born population - Bahamas (%)
Place of birth for the foreign-born population - Barbados (%)
Place of birth for the foreign-born population - Cuba (%)
Place of birth for the foreign-born population - Dominica (%)
Place of birth for the foreign-born population - Dominican Republic (%)
Place of birth for the foreign-born population - Grenada (%)
Place of birth for the foreign-born population - Haiti (%)
Place of birth for the foreign-born population - Jamaica (%)
Place of birth for the foreign-born population - St. Vincent and the Grenadines (%)
Place of birth for the foreign-born population - Trinidad and Tobago (%)
Place of birth for the foreign-born population - West Indies (%)
Place of birth for the foreign-born population - Other Caribbean (%)
Place of birth for the foreign-born population - Belize (%)
Place of birth for the foreign-born population - Costa Rica (%)
Place of birth for the foreign-born population - El Salvador (%)
Place of birth for the foreign-born population - Guatemala (%)
Place of birth for the foreign-born population - Honduras (%)
Place of birth for the foreign-born population - Mexico (%)
Place of birth for the foreign-born population - Nicaragua (%)
Place of birth for the foreign-born population - Panama (%)
Place of birth for the foreign-born population - Other Central America (%)
Place of birth for the foreign-born population - Argentina (%)
Place of birth for the foreign-born population - Bolivia (%)
Place of birth for the foreign-born population - Brazil (%)
Place of birth for the foreign-born population - Chile (%)
Place of birth for the foreign-born population - Colombia (%)
Place of birth for the foreign-born population - Ecuador (%)
Place of birth for the foreign-born population - Guyana (%)
Place of birth for the foreign-born population - Peru (%)
Place of birth for the foreign-born population - Uruguay (%)
Place of birth for the foreign-born population - Venezuela (%)
Place of birth for the foreign-born population - Other South America (%)
Place of birth for the foreign-born population - Canada (%)
Place of birth for the foreign-born population - Other Northern America (%)
Place of birth for the foreign-born population - Other (%)
Latest news about races in Benton, AR collected exclusively by city-data.com from local newspapers, TV, and radio stations
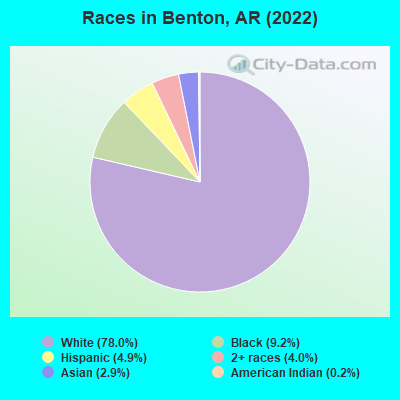
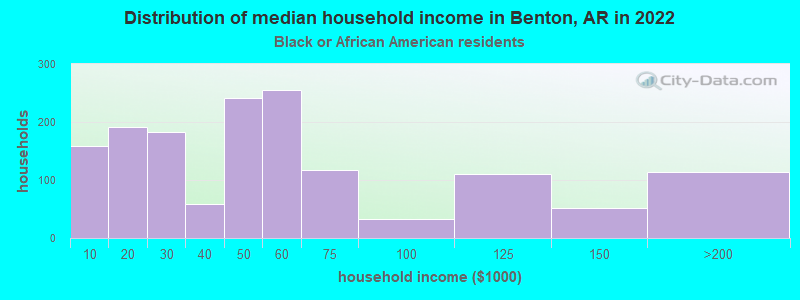
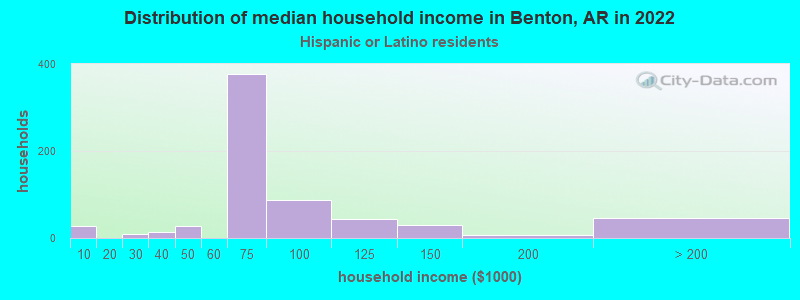
According to 2022 data, the most numerous races in Benton, AR are White alone (28,671 residents), Black alone (3,125 residents), and Hispanic (1,560 residents). 95.1% of Benton residents speak English at home. 3.3% of Benton, AR residents are foreign-born (1.4% born in Asia, 1.3% born in Latin America), which is 20.1% less than the foreign-born rate of 4.0% across the entire state of Arkansas.
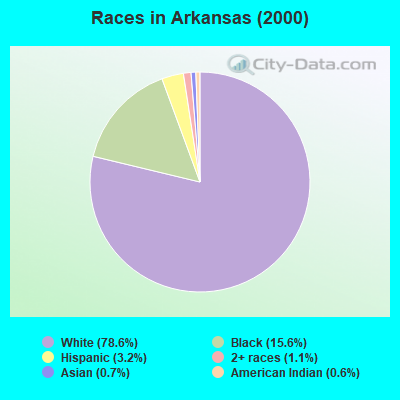
Race distribution in Benton
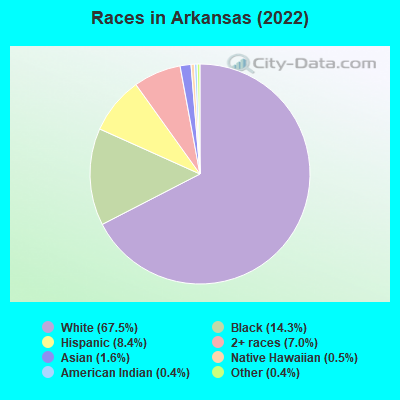
2000 2022
2,100,135 78.6% White alone 416,615 15.6% Black alone 86,866 3.2% Hispanic 30,364 1.1% Two or more races 19,892 0.7% Asian alone 16,702 0.6% American Indian alone 1,494 0.06% Native Hawaiian and Other 1,332 0.05% Other race alone
2,054,922 67.5% White alone 435,637 14.3% Black alone 255,416 8.4% Hispanic 213,684 7.0% Two or more races 47,592 1.6% Asian alone 14,176 0.5% Native Hawaiian and Other 12,680 0.4% American Indian alone 11,530 0.4% Other race alone
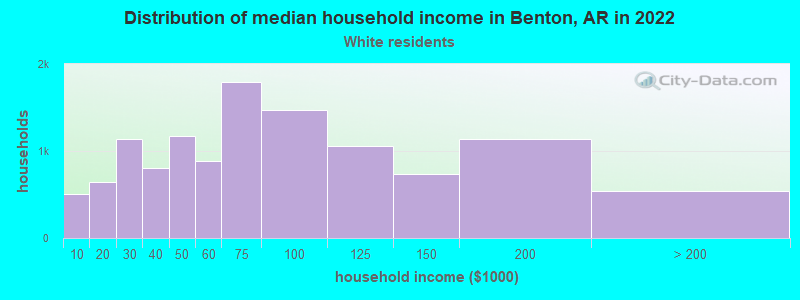
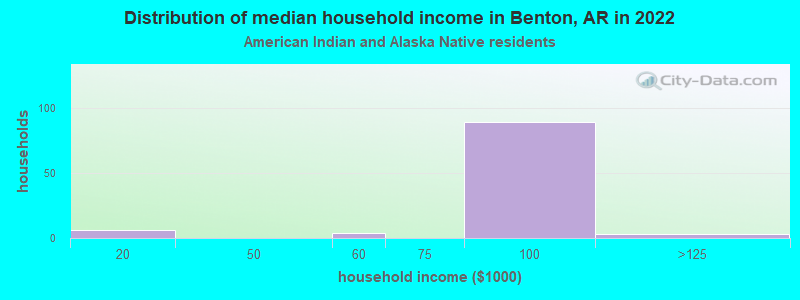
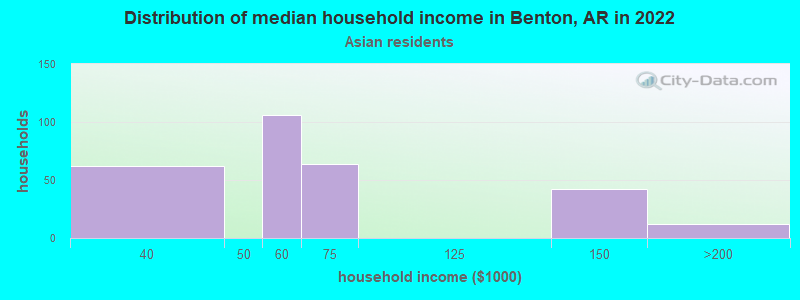
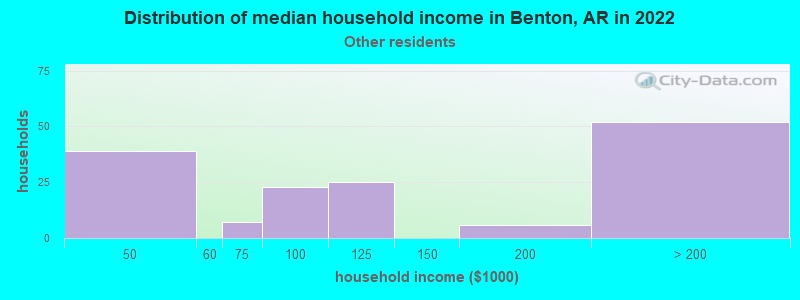
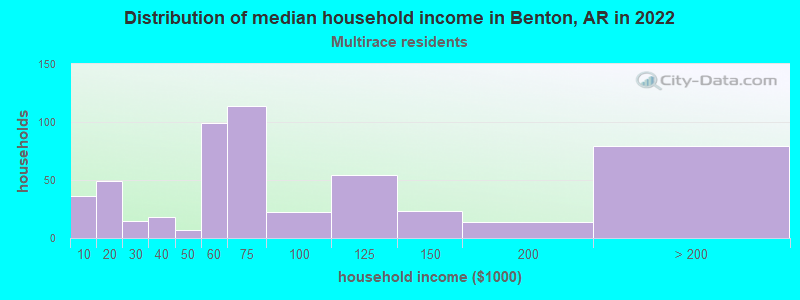
Income and house value in Benton Median household income in 2022 $78,660 White non-Hispanic householders$35,391 Black householders$51,145 American Indian and Alaska Native householders$153,452 Asian householders$61,054 Some other race householders$68,840 Two or more races householders$79,741 Hispanic or Latino race householdersMedian 2022 house value $235,020 White Non-Hispanic householders$100,570 Black or African American householders $120,044 Asian householders$200,074 Some other race householders$248,892 Two or more races householders$210,211 Hispanic or Latino householders
Median age by race in Benton
38.5 Median age for White residents37.4 39.6 27.5 Median age for Black or African American residents36.0 23.3 20.5 Median age for American Indian / Alaska Native residents21.1 17.9 34.0 Median age for Asian residents46.6 31.6 20.9 Median age for Native Hawaiian / Pacific Islander residents41.2 Median age for Other race residents15.1 50.1 14.9 Median age for Two or more races residents9.6 28.1 38.7 Median age for White alone residents37.7 40.8 19.7 Median age for Hispanic or Latino residents21.9 20.0
Owner/renter occupied households by race in Benton
House owners and renters - White residents 7,802 68.3% Owner occupied3,626 31.7% Renter occupiedHouse owners and renters - Black or African American residents 344 27.3% Owner occupied914 72.7% Renter occupiedHouse owners and renters - American Indian / Alaska Native residents 38 58.7% Owner occupied27 41.3% Renter occupiedHouse owners and renters - Asian residents 195 100.0% Owner occupiedHouse owners and renters - Native Hawaiian / Pacific Islander residents 14 100.0% Renter occupiedHouse owners and renters - Other race residents 62 59.2% Owner occupied43 40.8% Renter occupiedHouse owners and renters - Two or more races residents 440 72.4% Owner occupied168 27.6% Renter occupiedHouse owners and renters - White alone residents 7,790 68.0% Owner occupied3,666 32.0% Renter occupiedHouse owners and renters - Hispanic or Latino residents 295 66.7% Owner occupied147 33.3% Renter occupied
Language usage in Benton
English speakers - Total 95.1% of residents of Benton speak English at home.
2.9% of residents speak Spanish at home 535 54.3% Speak English very well450 45.7% Speak English less than very well1.8% of residents speak other language at home 233 37.8% Speak English very well384 62.2% Speak English less than very well
English speakers - Born in the United States 97.4% of residents of Benton speak English at home.
2.2% of residents speak Spanish at home 65 31.3% Speak English very well143 68.8% Speak English less than very well0.5% of residents speak other language at home 44 100.0% Speak English very well
English speakers - Native, born elsewhere 76.7% of residents of Benton speak English at home.
22.8% of residents speak Spanish at home 43 100.0% Speak English very well
English speakers - Foreign-born 23.0% of residents of Benton speak English at home.
38.3% of residents speak Spanish at home 160 34.0% Speak English very well310 66.0% Speak English less than very well37.5% of residents speak other language at home 80 17.4% Speak English very well381 82.6% Speak English less than very well
White (Caucasian) - Speak only English Native:
99.9% (27,684)Foreign-born:
18.9% (67)
White (Caucasian) - Speak another language Native:
0.6% (163)Foreign-born:
81.9% (289)
Black or African American - Speak only English Native:
96.7% (2,611)Foreign-born:
73.9% (80)
American Indian / Alaska Native - Speak another language Native:
16.9% (41)Foreign-born:
100.0% (79)
Asian - Speak another language Native:
88.5% (76)Foreign-born:
90.5% (462)
Other race - Speak another language Native:
65.8% (107)Foreign-born:
94.8% (99)
White alone - Speak only English Native:
99.6% (26,845)Foreign-born:
100.0% (123)
White alone - Speak another language Native:
0.4% (115)Foreign-born:
10.1% (12)
Hispanic or Latino - Speak another language Native:
45.1% (376)Foreign-born:
97.9% (501)
Foreign-born residents in Benton 1,226 residents are foreign born (1.4% Asia , 1.3% Latin America ).
This city:
3.3%Arkansas:
100.0%
Marital status for residents in Benton Marital status - White (Caucasian) population 15 years and over
Males 27.2% Never married56.3% Now married1.4% Separated3.2% Widowed11.9% DivorcedFemales 20.6% Never married47.4% Now married2.4% Separated11.9% Widowed17.7% DivorcedWomen who gave birth in the past 12 months Now married:
78.2% (261)Unmarried:
21.8% (73)
Women who did not give birth in the past 12 months Now married:
49.4% (3,392)Unmarried:
50.6% (3,478)
Marital status - Black or African American population 15 years and over
Males 41.0% Never married40.1% Now married4.1% Separated5.0% Widowed9.8% DivorcedFemales 48.2% Never married25.3% Now married0.0% Separated7.2% Widowed19.2% DivorcedWomen who gave birth in the past 12 months Now married:
0.0% (0)Unmarried:
100.0% (71)
Women who did not give birth in the past 12 months Now married:
25.0% (243)Unmarried:
75.0% (731)
Marital status - American Indian / Alaska Native population 15 years and over
Males 43.8% Never married52.1% Now married0.0% Separated0.0% Widowed4.2% DivorcedFemales 30.7% Never married43.9% Now married0.0% Separated0.0% Widowed25.4% DivorcedWomen who gave birth in the past 12 months Now married:
100.0% (22)Unmarried:
0.0% (0)
Women who did not give birth in the past 12 months Now married:
25.6% (17)Unmarried:
74.4% (49)
Marital status - Asian population 15 years and over
Males 5.3% Never married85.4% Now married0.0% Separated9.4% Widowed0.0% DivorcedFemales 12.9% Never married62.9% Now married0.0% Separated2.2% Widowed21.9% DivorcedWomen who gave birth in the past 12 months Now married:
100.0% (28)Unmarried:
0.0% (0)
Women who did not give birth in the past 12 months Now married:
57.6% (107)Unmarried:
42.4% (79)
Marital status - Other race population 15 years and over
Males 0.0% Never married70.9% Now married0.0% Separated0.0% Widowed29.1% DivorcedFemales 17.2% Never married82.8% Now married0.0% Separated0.0% Widowed0.0% DivorcedWomen who did not give birth in the past 12 months Now married:
82.8% (77)Unmarried:
17.2% (16)
Marital status - Two or more races population 15 years and over
Males 0.0% Never married10.3% Now married0.0% Separated13.2% Widowed76.5% DivorcedFemales 26.8% Never married63.1% Now married0.0% Separated6.1% Widowed4.0% DivorcedWomen who gave birth in the past 12 months Now married:
33.3% (17)Unmarried:
66.7% (35)
Women who did not give birth in the past 12 months Now married:
63.7% (210)Unmarried:
36.3% (119)
Marital status - White alone, not Hispanic / Latino population 15 years and over
Males 26.6% Never married56.6% Now married1.4% Separated3.3% Widowed12.1% DivorcedFemales 19.8% Never married47.6% Now married2.4% Separated12.1% Widowed18.1% DivorcedWomen who gave birth in the past 12 months Now married:
86.3% (265)Unmarried:
13.7% (42)
Women who did not give birth in the past 12 months Now married:
49.6% (3,357)Unmarried:
50.4% (3,405)
Marital status - Hispanic or Latino population 15 years and over
Males 37.6% Never married55.6% Now married0.0% Separated1.6% Widowed5.1% DivorcedFemales 43.0% Never married52.2% Now married0.0% Separated0.0% Widowed4.8% DivorcedWomen who gave birth in the past 12 months Now married:
32.7% (18)Unmarried:
67.3% (37)
Women who did not give birth in the past 12 months Now married:
55.8% (211)Unmarried:
44.2% (167)
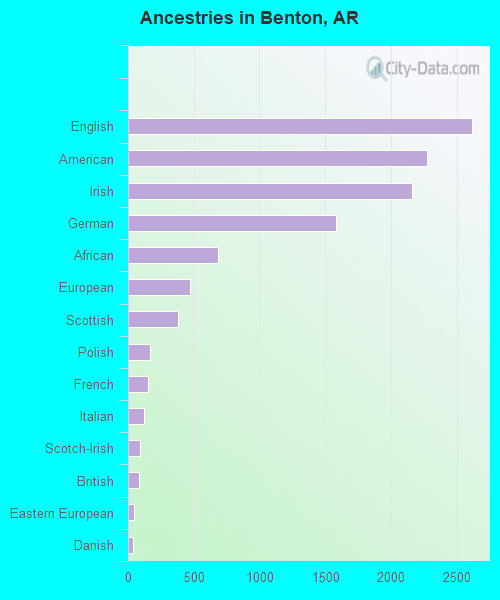
Ancestries in Benton
2,670 16.4% American2,236 13.7% English1,501 9.2% German1,363 8.4% European1,213 7.4% Irish1,017 6.2% African309 1.9% Scottish241 1.5% British150 0.9% Scotch-Irish98 0.6% French Canadian95 0.6% French78 0.5% Italian58 0.4% Czech48 0.3% Welsh43 0.3% Eastern European35 0.2% Polish33 0.2% Haitian29 0.2% Northern European27 0.2% Danish23 0.1% Dutch20 0.1% Canadian20 0.1% Czechoslovakian8 0.05% Assyrian6 0.04% Hungarian5 0.03% Arab4 0.02% Greek3 0.02% Armenian3 0.02% Swedish
Geographical mobility in Benton Same house 1 year ago 25,965 88.6% White (Caucasian)2,650 85.0% Black or African American86 35.6% American Indian / Alaska Native512 80.3% Asian84 100.0% Native Hawaiian / Pacific Islander282 96.5% Other race1,564 99.8% Two or more races24,642 86.7% White alone, not Hispanic / Latino1,132 78.2% Hispanic or LatinoMoved within same county 1,482 5.1% White / Caucasian205 6.6% Black or African American21 8.9% American Indian / Alaska Native1,893 6.7% White alone, not Hispanic / Latino21 1.4% Hispanic or LatinoMoved within same state 1,458 5.0% White / Caucasian318 10.2% Black or African American172 71.6% American Indian / Alaska Native15 5.3% Other race40 2.5% Two or more races1,251 4.4% White alone, not Hispanic / Latino304 21.0% Hispanic or LatinoMoved from different state 320 1.1% White / Caucasian1 0.0% Black or African American126 19.7% Asian44 2.8% Two or more races585 2.1% White alone, not Hispanic / Latino45 3.1% Hispanic or LatinoMoved from abroad 54 0.2% White4 0.6% Asian50 0.2% White alone, not Hispanic / Latino4 0.3% Hispanic or Latino
Children Nativity (place of birth) in Benton
Children under 6 years - Living with two parents Both parents native 1,874 100.0% NativeBoth parents foreign-born 71 100.0% NativeOne native, one foreign-born parent 63 100.0% NativeChildren under 6 years - Living with one parent Native parent 628 100.0% NativeForeign-born parent 151 100.0% NativeChildren 6 to 17 years - Living with two parents Both parents native 3,582 100.0% NativeBoth parents foreign-born 182 94.8% Native10 5.2% Foreign-bornOne native, one foreign-born parent 127 100.0% NativeChildren 6 to 17 years - Living with one parent Native parent 2,001 100.0% NativeForeign-born parent 9 51.3% Native8 48.7% Foreign-born
Grandparents responsible for own grandchildren in Benton
Grandparents (30 to 59 years) White / Caucasian 155 52.1% Responsible for grandchildren142 47.9% Not responsible for grandchildrenWhite alone, not Hispanic / Latino 148 49.3% Responsible for grandchildren152 50.7% Not responsible for grandchildrenHispanic or Latino 5 100.0% Responsible for grandchildrenGrandparents (60 years and over) White / Caucasian 245 57.1% Responsible for grandchildren184 42.9% Not responsible for grandchildrenWhite alone, not Hispanic / Latino 189 50.5% Responsible for grandchildren186 49.5% Not responsible for grandchildrenHispanic or Latino 87 100.0% Responsible for grandchildren