Races in Broward Estates, Florida (FL) Detailed Stats
Ancestries, Foreign-born residents, place of birth

Recent posts about races in Broward Estates, Florida on our local forum with over 2,400,000 registered users:
 | Can someone map out the ethnic groups in surrounding cities??? (8 replies) |
| Melrose Park? (24 replies) |
5.7% of Broward Estates, FL residents are foreign-born (5.2% born in Latin America), which is 269.8% less than the foreign-born rate of 21.0% across the entire state of Florida.
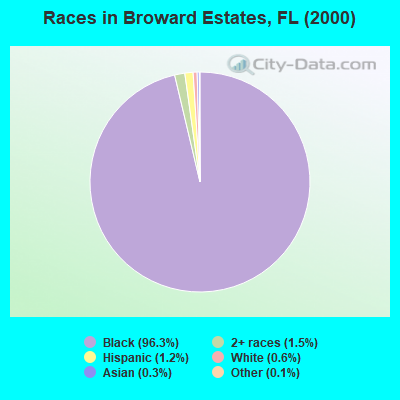
Race distribution in Broward Estates

- 3,28896.3%Black alone
- 521.5%Two or more races
- 421.2%Hispanic
- 190.6%White alone
- 100.3%Asian alone
- 40.1%Other race alone
- 10.03%American Indian alone
2000
2022
-
- 10,458,50965.4%White alone
- 2,682,71516.8%Hispanic
- 2,264,26814.2%Black alone
- 261,6931.6%Asian alone
- 236,9541.5%Two or more races
- 42,3580.3%American Indian alone
- 28,9940.2%Other race alone
- 6,8870.04%Native Hawaiian and Other
Pacific Islander alone

-
- 11,309,40350.8%White alone
- 6,025,03927.1%Hispanic
- 3,241,01514.6%Black alone
- 861,6303.9%Two or more races
- 623,6922.8%Asian alone
- 152,0540.7%Other race alone
- 22,5040.1%American Indian alone
- 9,4860.04%Native Hawaiian and Other
Pacific Islander alone

Income and house value in Broward Estates
- Median household income in 2022
- $93,780White non-Hispanic householders
- $60,660Black householders
- Median 2022 house value
- $301,172Black or African American householders
Household income for White non-Hispanic householders

Household income for Black householders

Foreign-born residents in Broward Estates
194 residents are foreign born (5.2% Latin America).
| This city: | 5.7% |
| Florida: | 16.7% |
Ancestries in Broward Estates

- 2,63087.8%Other
- 2297.6%West Indian
- 551.8%United States
- 501.7%Subsaharan African
- 150.5%English
- 80.3%Czech
- 70.2%Italian

Zip codes: 33311.