Races in Cairo, Georgia (GA) Detailed Stats
Data:
Races - White alone (%)
Races - White alone (% change since 2000)
Races - Black alone (%)
Races - Black alone (% change since 2000)
Races - American Indian alone (%)
Races - American Indian alone (% change since 2000)
Races - Asian alone (%)
Races - Asian alone (% change since 2000)
Races - Hispanic (%)
Races - Hispanic (% change since 2000)
Races - Native Hawaiian and Other Pacific Islander alone (%)
Races - Native Hawaiian and Other Pacific Islander alone (% change since 2000)
Races - Two or more races(%)
Races - Two or more races(% change since 2000)
Races - Other race alone (%)
Races - Other race alone (% change since 2000)
Racial diversity
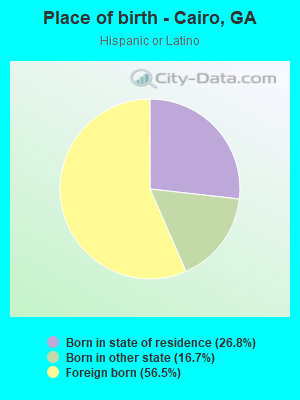
Place of birth - Born in state of residence (%)
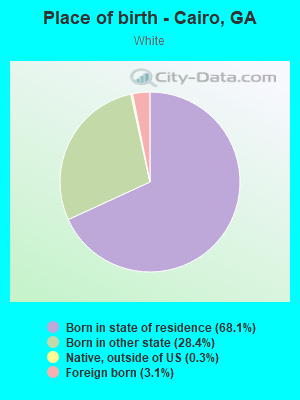
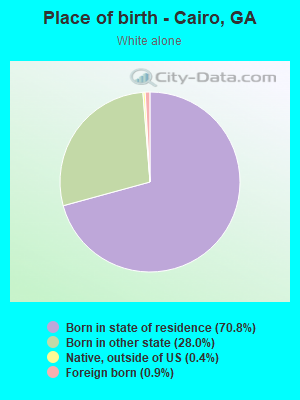
Place of birth - Born in state of residence (%) - White
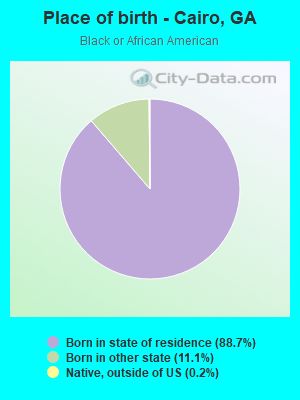
Place of birth - Born in state of residence (%) - Black or African American
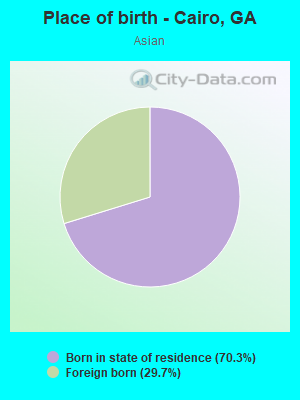
Place of birth - Born in state of residence (%) - Asian
Place of birth - Born in state of residence (%) - Hispanic or Latino
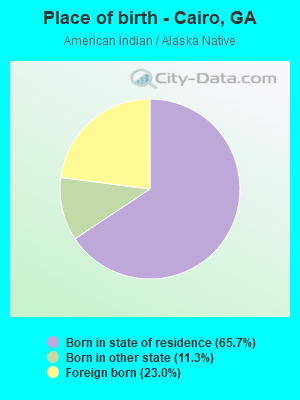
Place of birth - Born in state of residence (%) - American Indian and Alaska Native
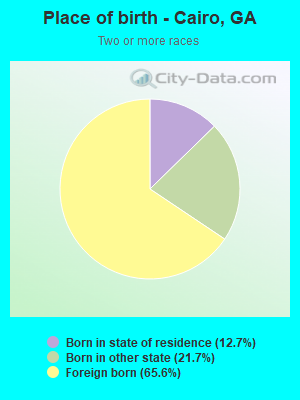
Place of birth - Born in state of residence (%) - Multirace
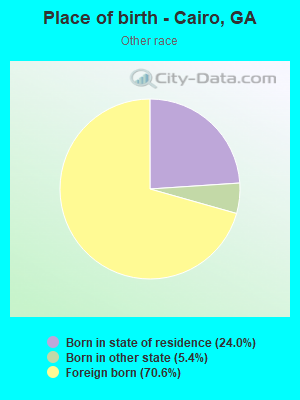
Place of birth - Born in state of residence (%) - Other Race
Place of birth - Born in other state (%)
Place of birth - Born in other state (%) - White
Place of birth - Born in other state (%) - Black or African American
Place of birth - Born in other state (%) - Asian
Place of birth - Born in other state (%) - Hispanic or Latino
Place of birth - Born in other state (%) - American Indian and Alaska Native
Place of birth - Born in other state (%) - Multirace
Place of birth - Born in other state (%) - Other Race
Place of birth - Native, outside of US (%)
Place of birth - Native, outside of US (%) - White
Place of birth - Native, outside of US (%) - Black or African American
Place of birth - Native, outside of US (%) - Asian
Place of birth - Native, outside of US (%) - Hispanic or Latino
Place of birth - Native, outside of US (%) - American Indian and Alaska Native
Place of birth - Native, outside of US (%) - Multirace
Place of birth - Native, outside of US (%) - Other Race
Place of birth - Foreign born (%)
Place of birth - Foreign born (%) - White
Place of birth - Foreign born (%) - Black or African American
Place of birth - Foreign born (%) - Asian
Place of birth - Foreign born (%) - Hispanic or Latino
Place of birth - Foreign born (%) - American Indian and Alaska Native
Place of birth - Foreign born (%) - Multirace
Place of birth - Foreign born (%) - Other Race
Residents speaking English at home (%)
Residents speaking English at home - Born in the United States (%)
Residents speaking English at home - Native, born elsewhere (%)
Residents speaking English at home - Foreign born (%)
Residents speaking Spanish at home (%)
Residents speaking Spanish at home - Born in the United States (%)
Residents speaking Spanish at home - Native, born elsewhere (%)
Residents speaking Spanish at home - Foreign born (%)
Residents speaking other language at home (%)
Residents speaking other language at home - Born in the United States (%)
Residents speaking other language at home - Native, born elsewhere (%)
Residents speaking other language at home - Foreign born (%)
Marital status - Never married (%)
Marital status - Now married (%)
Marital status - Separated (%)
Marital status - Widowed (%)
Marital status - Divorced (%)
Ancestries Reported - Arab (%)
Ancestries Reported - Czech (%)
Ancestries Reported - Danish (%)
Ancestries Reported - Dutch (%)
Ancestries Reported - English (%)
Ancestries Reported - French (%)
Ancestries Reported - French Canadian (%)
Ancestries Reported - German (%)
Ancestries Reported - Greek (%)
Ancestries Reported - Hungarian (%)
Ancestries Reported - Irish (%)
Ancestries Reported - Italian (%)
Ancestries Reported - Lithuanian (%)
Ancestries Reported - Norwegian (%)
Ancestries Reported - Polish (%)
Ancestries Reported - Portuguese (%)
Ancestries Reported - Russian (%)
Ancestries Reported - Scotch-Irish (%)
Ancestries Reported - Scottish (%)
Ancestries Reported - Slovak (%)
Ancestries Reported - Subsaharan African (%)
Ancestries Reported - Swedish (%)
Ancestries Reported - Swiss (%)
Ancestries Reported - Ukrainian (%)
Ancestries Reported - United States (%)
Ancestries Reported - Welsh (%)
Ancestries Reported - West Indian (%)
Ancestries Reported - Other (%)
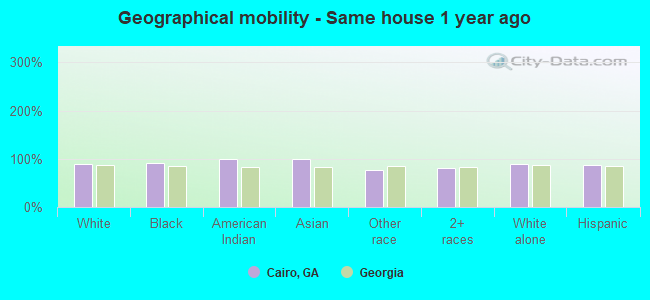
Geographical mobility - Same house 1 year ago (%)
Geographical mobility - Same house 1 year ago (%) - White
Geographical mobility - Same house 1 year ago (%) - Black or African American
Geographical mobility - Same house 1 year ago (%) - Asian
Geographical mobility - Same house 1 year ago (%) - Hispanic or Latino
Geographical mobility - Same house 1 year ago (%) - American Indian and Alaska Native
Geographical mobility - Same house 1 year ago (%) - Multirace
Geographical mobility - Same house 1 year ago (%) - Other Race
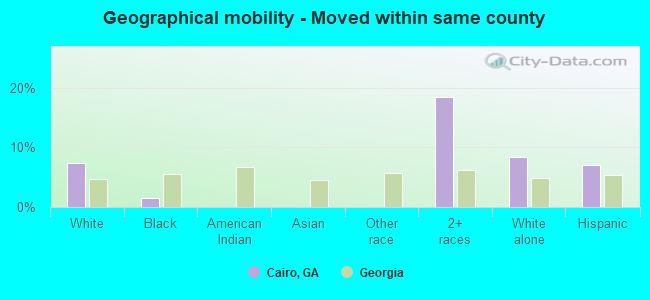
Geographical mobility - Moved within same county (%)
Geographical mobility - Moved within same county (%) - White
Geographical mobility - Moved within same county (%) - Black or African American
Geographical mobility - Moved within same county (%) - Asian
Geographical mobility - Moved within same county (%) - Hispanic or Latino
Geographical mobility - Moved within same county (%) - American Indian and Alaska Native
Geographical mobility - Moved within same county (%) - Multirace
Geographical mobility - Moved within same county (%) - Other Race
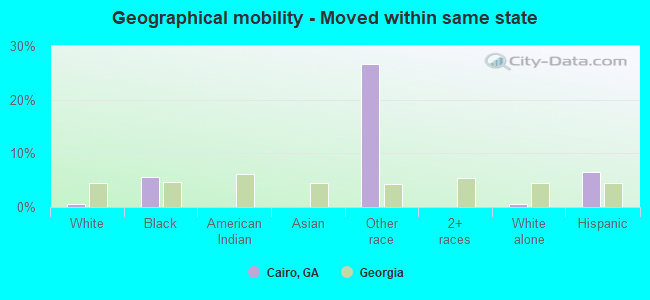
Geographical mobility - Moved from different county within same state (%)
Geographical mobility - Moved from different county within same state (%) - White
Geographical mobility - Moved from different county within same state (%) - Black or African American
Geographical mobility - Moved from different county within same state (%) - Asian
Geographical mobility - Moved from different county within same state (%) - Hispanic or Latino
Geographical mobility - Moved from different county within same state (%) - American Indian and Alaska Native
Geographical mobility - Moved from different county within same state (%) - Multirace
Geographical mobility - Moved from different county within same state (%) - Other Race
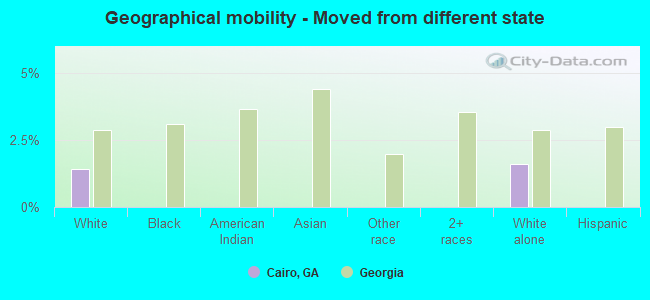
Geographical mobility - Moved from different state (%)
Geographical mobility - Moved from different state (%) - White
Geographical mobility - Moved from different state (%) - Black or African American
Geographical mobility - Moved from different state (%) - Asian
Geographical mobility - Moved from different state (%) - Hispanic or Latino
Geographical mobility - Moved from different state (%) - American Indian and Alaska Native
Geographical mobility - Moved from different state (%) - Multirace
Geographical mobility - Moved from different state (%) - Other Race
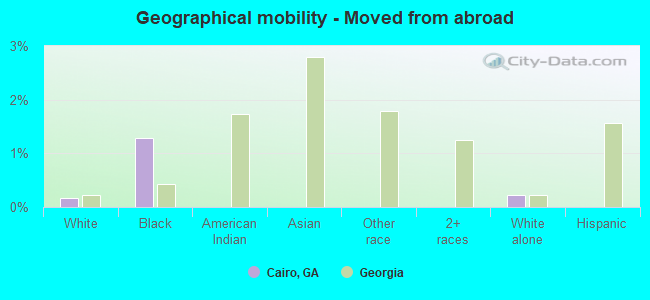
Geographical mobility - Moved from abroad (%)
Geographical mobility - Moved from abroad (%) - White
Geographical mobility - Moved from abroad (%) - Black or African American
Geographical mobility - Moved from abroad (%) - Asian
Geographical mobility - Moved from abroad (%) - Hispanic or Latino
Geographical mobility - Moved from abroad (%) - American Indian and Alaska Native
Geographical mobility - Moved from abroad (%) - Multirace
Geographical mobility - Moved from abroad (%) - Other Race
Place of birth for the foreign-born population - Ireland (%)
Place of birth for the foreign-born population - Denmark (%)
Place of birth for the foreign-born population - Norway (%)
Place of birth for the foreign-born population - Sweden (%)
Place of birth for the foreign-born population - United Kingdom (%)
Place of birth for the foreign-born population - England (%)
Place of birth for the foreign-born population - Scotland (%)
Place of birth for the foreign-born population - Other Northern Europe (%)
Place of birth for the foreign-born population - Austria (%)
Place of birth for the foreign-born population - Belgium (%)
Place of birth for the foreign-born population - France (%)
Place of birth for the foreign-born population - Germany (%)
Place of birth for the foreign-born population - Netherlands (%)
Place of birth for the foreign-born population - Switzerland (%)
Place of birth for the foreign-born population - Other Western Europe (%)
Place of birth for the foreign-born population - Greece (%)
Place of birth for the foreign-born population - Italy (%)
Place of birth for the foreign-born population - Portugal (%)
Place of birth for the foreign-born population - Spain (%)
Place of birth for the foreign-born population - Other Southern Europe (%)
Place of birth for the foreign-born population - Albania (%)
Place of birth for the foreign-born population - Belarus (%)
Place of birth for the foreign-born population - Bosnia and Herzegovina (%)
Place of birth for the foreign-born population - Bulgaria (%)
Place of birth for the foreign-born population - Croatia (%)
Place of birth for the foreign-born population - Czechoslovakia (%)
Place of birth for the foreign-born population - Hungary (%)
Place of birth for the foreign-born population - Latvia (%)
Place of birth for the foreign-born population - Lithuania (%)
Place of birth for the foreign-born population - North Macedonia (Macedonia) (%)
Place of birth for the foreign-born population - Moldova (%)
Place of birth for the foreign-born population - Poland (%)
Place of birth for the foreign-born population - Romania (%)
Place of birth for the foreign-born population - Russia (%)
Place of birth for the foreign-born population - Serbia (%)
Place of birth for the foreign-born population - Ukraine (%)
Place of birth for the foreign-born population - Other Eastern Europe (%)
Place of birth for the foreign-born population - China (%)
Place of birth for the foreign-born population - Hong Kong (%)
Place of birth for the foreign-born population - Taiwan (%)
Place of birth for the foreign-born population - Japan (%)
Place of birth for the foreign-born population - Korea (%)
Place of birth for the foreign-born population - Other Eastern Asia (%)
Place of birth for the foreign-born population - Afghanistan (%)
Place of birth for the foreign-born population - Bangladesh (%)
Place of birth for the foreign-born population - India (%)
Place of birth for the foreign-born population - Iran (%)
Place of birth for the foreign-born population - Kazakhstan (%)
Place of birth for the foreign-born population - Nepal (%)
Place of birth for the foreign-born population - Pakistan (%)
Place of birth for the foreign-born population - Sri Lanka (%)
Place of birth for the foreign-born population - Uzbekistan (%)
Place of birth for the foreign-born population - Other South Central Asia (%)
Place of birth for the foreign-born population - Burma (%)
Place of birth for the foreign-born population - Cambodia (%)
Place of birth for the foreign-born population - Indonesia (%)
Place of birth for the foreign-born population - Laos (%)
Place of birth for the foreign-born population - Malaysia (%)
Place of birth for the foreign-born population - Philippines (%)
Place of birth for the foreign-born population - Singapore (%)
Place of birth for the foreign-born population - Thailand (%)
Place of birth for the foreign-born population - Vietnam (%)
Place of birth for the foreign-born population - Other South Eastern Asia (%)
Place of birth for the foreign-born population - Armenia (%)
Place of birth for the foreign-born population - Iraq (%)
Place of birth for the foreign-born population - Israel (%)
Place of birth for the foreign-born population - Jordan (%)
Place of birth for the foreign-born population - Kuwait (%)
Place of birth for the foreign-born population - Lebanon (%)
Place of birth for the foreign-born population - Saudi Arabia (%)
Place of birth for the foreign-born population - Syria (%)
Place of birth for the foreign-born population - Turkey (%)
Place of birth for the foreign-born population - Yemen (%)
Place of birth for the foreign-born population - Other Western Asia (%)
Place of birth for the foreign-born population - Eritrea (%)
Place of birth for the foreign-born population - Ethiopia (%)
Place of birth for the foreign-born population - Kenya (%)
Place of birth for the foreign-born population - Somalia (%)
Place of birth for the foreign-born population - Uganda (%)
Place of birth for the foreign-born population - Zimbabwe (%)
Place of birth for the foreign-born population - Other Eastern Africa (%)
Place of birth for the foreign-born population - Cameroon (%)
Place of birth for the foreign-born population - Congo (%)
Place of birth for the foreign-born population - Democratic Republic of Congo (Zaire) (%)
Place of birth for the foreign-born population - Other Middle Africa (%)
Place of birth for the foreign-born population - Egypt (%)
Place of birth for the foreign-born population - Morocco (%)
Place of birth for the foreign-born population - Sudan (%)
Place of birth for the foreign-born population - Other Northern Africa (%)
Place of birth for the foreign-born population - South Africa (%)
Place of birth for the foreign-born population - Other Southern Africa (%)
Place of birth for the foreign-born population - Cabo Verde (%)
Place of birth for the foreign-born population - Ghana (%)
Place of birth for the foreign-born population - Liberia (%)
Place of birth for the foreign-born population - Nigeria (%)
Place of birth for the foreign-born population - Senegal (%)
Place of birth for the foreign-born population - Sierra Leone (%)
Place of birth for the foreign-born population - Other Western Africa (%)
Place of birth for the foreign-born population - Australia (%)
Place of birth for the foreign-born population - New Zealand (%)
Place of birth for the foreign-born population - Fiji (%)
Place of birth for the foreign-born population - Micronesia (%)
Place of birth for the foreign-born population - Bahamas (%)
Place of birth for the foreign-born population - Barbados (%)
Place of birth for the foreign-born population - Cuba (%)
Place of birth for the foreign-born population - Dominica (%)
Place of birth for the foreign-born population - Dominican Republic (%)
Place of birth for the foreign-born population - Grenada (%)
Place of birth for the foreign-born population - Haiti (%)
Place of birth for the foreign-born population - Jamaica (%)
Place of birth for the foreign-born population - St. Vincent and the Grenadines (%)
Place of birth for the foreign-born population - Trinidad and Tobago (%)
Place of birth for the foreign-born population - West Indies (%)
Place of birth for the foreign-born population - Other Caribbean (%)
Place of birth for the foreign-born population - Belize (%)
Place of birth for the foreign-born population - Costa Rica (%)
Place of birth for the foreign-born population - El Salvador (%)
Place of birth for the foreign-born population - Guatemala (%)
Place of birth for the foreign-born population - Honduras (%)
Place of birth for the foreign-born population - Mexico (%)
Place of birth for the foreign-born population - Nicaragua (%)
Place of birth for the foreign-born population - Panama (%)
Place of birth for the foreign-born population - Other Central America (%)
Place of birth for the foreign-born population - Argentina (%)
Place of birth for the foreign-born population - Bolivia (%)
Place of birth for the foreign-born population - Brazil (%)
Place of birth for the foreign-born population - Chile (%)
Place of birth for the foreign-born population - Colombia (%)
Place of birth for the foreign-born population - Ecuador (%)
Place of birth for the foreign-born population - Guyana (%)
Place of birth for the foreign-born population - Peru (%)
Place of birth for the foreign-born population - Uruguay (%)
Place of birth for the foreign-born population - Venezuela (%)
Place of birth for the foreign-born population - Other South America (%)
Place of birth for the foreign-born population - Canada (%)
Place of birth for the foreign-born population - Other Northern America (%)
Place of birth for the foreign-born population - Other (%)
Latest news about races in Cairo, GA collected exclusively by city-data.com from local newspapers, TV, and radio stations
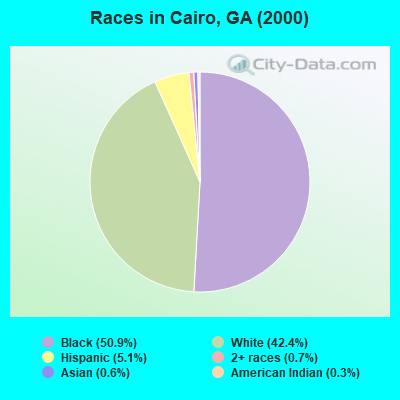
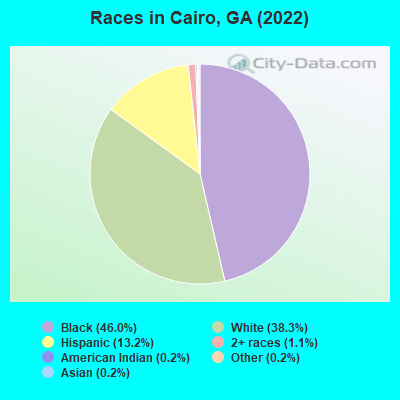
According to 2022 data, the most numerous races in Cairo, GA are White alone (3,934 residents), Black alone (4,726 residents), and Hispanic (1,354 residents). 87.7% of Cairo residents speak English at home. 7.8% of Cairo, GA residents are foreign-born (7.6% born in Latin America), which is 27.9% less than the foreign-born rate of 10.0% across the entire state of Georgia.
Race distribution in Cairo
2000 2022
5,128,661 62.6% White alone 2,331,465 28.5% Black alone 435,227 5.3% Hispanic 171,513 2.1% Asian alone 87,364 1.1% Two or more races 17,670 0.2% American Indian alone 11,275 0.1% Other race alone 3,278 0.04% Native Hawaiian and Other
5,415,657 49.6% White alone 3,349,240 30.7% Black alone 1,132,604 10.4% Hispanic 479,156 4.4% Asian alone 462,923 4.2% Two or more races 54,416 0.5% Other race alone 11,923 0.1% American Indian alone 6,957 0.06% Native Hawaiian and Other
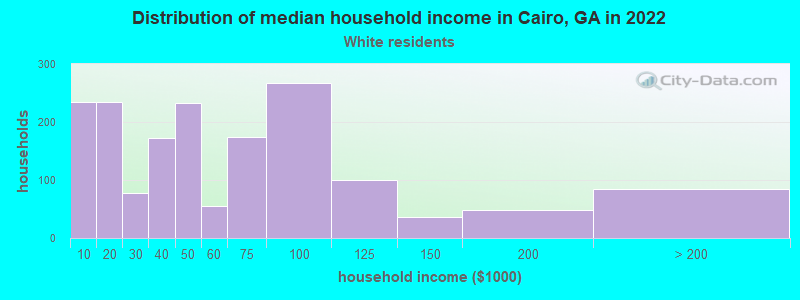
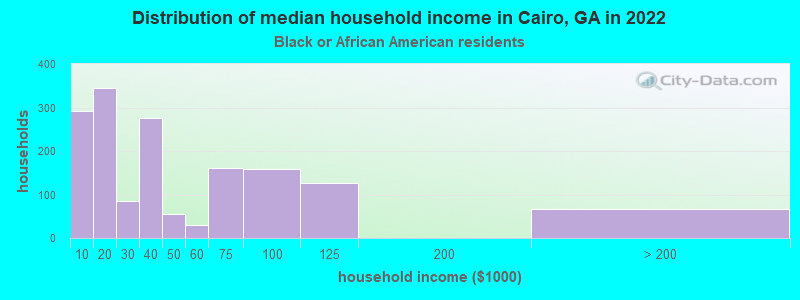
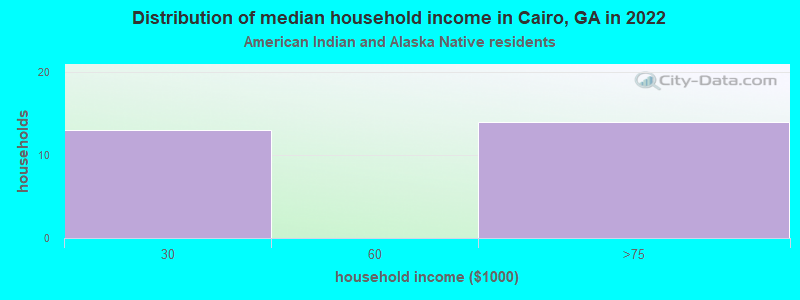
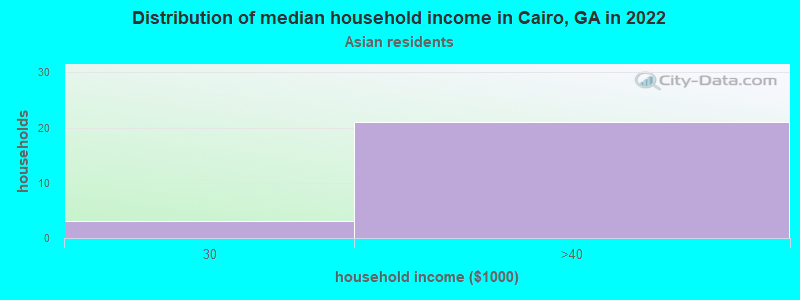
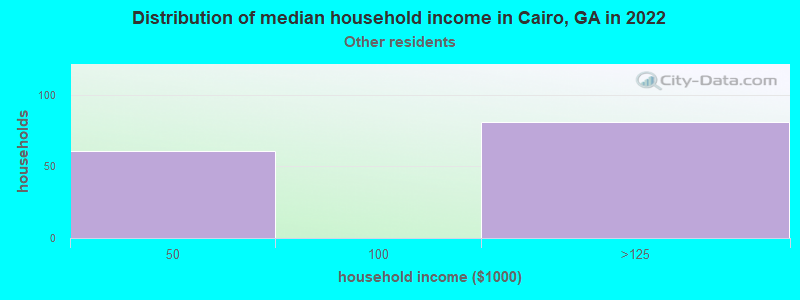
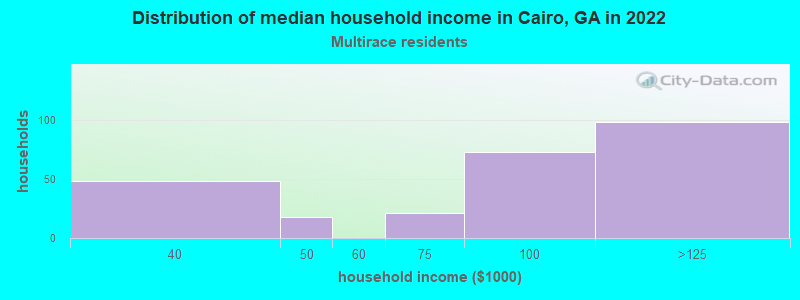
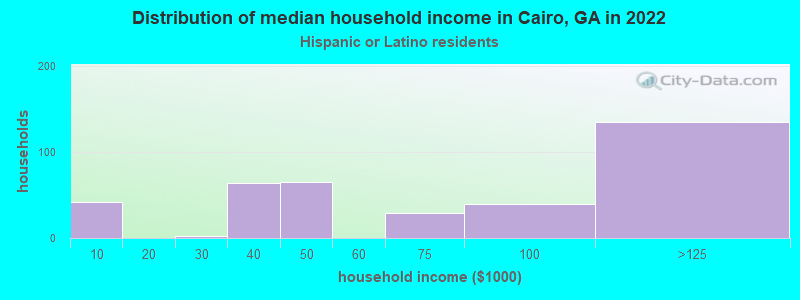
Income and house value in Cairo Median household income in 2022 $46,463 White non-Hispanic householders$32,141 Black householders$82,605 Two or more races householders$68,934 Hispanic or Latino race householdersMedian 2022 house value $190,893 White Non-Hispanic householders$100,003 Black or African American householders$155,880 Some other race householders$89,930 Two or more races householders$147,007 Hispanic or Latino householders
Median age by race in Cairo
36.5 Median age for White residents26.3 44.5 31.5 Median age for Black or African American residents27.4 32.4 29.5 Median age for American Indian / Alaska Native residents33.6 29.0 34.8 Median age for Asian residents49.3 34.5 -657,243,815.6 Median age for Native Hawaiian / Pacific Islander residents-693,227,090.9 -776,776,776.0 28.4 Median age for Other race residents20.7 28.7 38.2 Median age for Two or more races residents36.9 50.6 40.7 Median age for White alone residents30.9 48.1 28.1 Median age for Hispanic or Latino residents26.0 29.7
Owner/renter occupied households by race in Cairo
House owners and renters - White residents 1,034 60.5% Owner occupied676 39.5% Renter occupiedHouse owners and renters - Black or African American residents 669 42.3% Owner occupied913 57.7% Renter occupiedHouse owners and renters - American Indian / Alaska Native residents 38 100.0% Owner occupiedHouse owners and renters - Asian residents 22 100.0% Owner occupiedHouse owners and renters - Other race residents 15 11.9% Owner occupied112 88.1% Renter occupiedHouse owners and renters - Two or more races residents 52 21.7% Owner occupied187 78.3% Renter occupiedHouse owners and renters - White alone residents 1,050 63.5% Owner occupied603 36.5% Renter occupiedHouse owners and renters - Hispanic or Latino residents 55 14.6% Owner occupied319 85.4% Renter occupied
Language usage in Cairo
English speakers - Total 87.7% of residents of Cairo speak English at home.
11.4% of residents speak Spanish at home 279 25.3% Speak English very well822 74.7% Speak English less than very well0.4% of residents speak other language at home 22 57.9% Speak English very well16 42.1% Speak English less than very well
English speakers - Born in the United States 91.6% of residents of Cairo speak English at home.
8.2% of residents speak Spanish at home 153 100.0% Speak English very well
English speakers - Native, born elsewhere 95.8% of residents of Cairo speak English at home.
English speakers - Foreign-born 0.0% of residents of Cairo speak English at home.
98.4% of residents speak Spanish at home 20 2.5% Speak English very well771 97.5% Speak English less than very well
White (Caucasian) - Speak another language Native:
3.5% (138)Foreign-born:
89.1% (118)
American Indian / Alaska Native - Speak another language Native:
67.9% (48)Foreign-born:
100.0% (23)
Asian - Speak another language Native:
98.6% (22)Foreign-born:
100.0% (9)
Other race - Speak another language Native:
76.5% (33)Foreign-born:
99.0% (288)
Two or more races - Speak another language Native:
40.5% (97)Foreign-born:
99.4% (450)
White alone - Speak another language Native:
0.5% (20)Foreign-born:
99.6% (33)
Hispanic or Latino - Speak another language Native:
77.4% (327)Foreign-born:
99.8% (762)
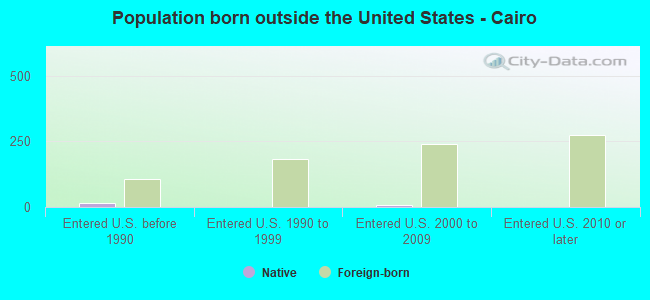
Foreign-born residents in Cairo 803 residents are foreign born (7.6% Latin America ).
This city:
7.8%Georgia:
10.4%
Marital status for residents in Cairo Marital status - White (Caucasian) population 15 years and over
Males 37.5% Never married54.4% Now married0.7% Separated2.7% Widowed4.6% DivorcedFemales 30.0% Never married36.4% Now married4.5% Separated15.4% Widowed13.7% DivorcedWomen who gave birth in the past 12 months Now married:
28.3% (16)Unmarried:
71.7% (41)
Women who did not give birth in the past 12 months Now married:
45.5% (435)Unmarried:
54.5% (521)
Marital status - Black or African American population 15 years and over
Males 44.2% Never married24.4% Now married2.3% Separated6.7% Widowed22.5% DivorcedFemales 52.1% Never married13.6% Now married8.7% Separated7.7% Widowed17.9% DivorcedWomen who did not give birth in the past 12 months Now married:
14.8% (173)Unmarried:
85.2% (998)
Marital status - American Indian / Alaska Native population 15 years and over
Males 0.0% Never married61.9% Now married0.0% Separated0.0% Widowed38.1% DivorcedFemales 0.0% Never married45.8% Now married0.0% Separated0.0% Widowed54.2% DivorcedWomen who did not give birth in the past 12 months Now married:
100.0% (17)Unmarried:
0.0% (0)
Marital status - Asian population 15 years and over
Males 71.4% Never married0.0% Now married0.0% Separated0.0% Widowed28.6% DivorcedFemales 15.0% Never married85.0% Now married0.0% Separated0.0% Widowed0.0% DivorcedWomen who gave birth in the past 12 months Now married:
100.0% (17)Unmarried:
0.0% (0)
Women who did not give birth in the past 12 months Now married:
0.0% (0)Unmarried:
100.0% (3)
Marital status - Other race population 15 years and over
Males 91.8% Never married8.2% Now married0.0% Separated0.0% Widowed0.0% DivorcedFemales 90.0% Never married10.0% Now married0.0% Separated0.0% Widowed0.0% DivorcedWomen who gave birth in the past 12 months Now married:
0.0% (0)Unmarried:
100.0% (39)
Women who did not give birth in the past 12 months Now married:
16.0% (10)Unmarried:
84.0% (54)
Marital status - Two or more races population 15 years and over
Males 24.3% Never married39.8% Now married32.0% Separated0.0% Widowed3.9% DivorcedFemales 6.2% Never married64.1% Now married23.4% Separated0.0% Widowed6.2% DivorcedWomen who did not give birth in the past 12 months Now married:
93.3% (83)Unmarried:
6.7% (6)
Marital status - White alone, not Hispanic / Latino population 15 years and over
Males 32.8% Never married58.5% Now married0.8% Separated2.9% Widowed5.0% DivorcedFemales 24.9% Never married38.6% Now married4.8% Separated16.8% Widowed14.9% DivorcedWomen who gave birth in the past 12 months Now married:
100.0% (17)Unmarried:
0.0% (0)
Women who did not give birth in the past 12 months Now married:
45.7% (435)Unmarried:
54.3% (517)
Marital status - Hispanic or Latino population 15 years and over
Males 56.5% Never married26.1% Now married17.1% Separated0.0% Widowed0.4% DivorcedFemales 71.4% Never married23.9% Now married4.7% Separated0.0% Widowed0.0% DivorcedWomen who gave birth in the past 12 months Now married:
0.0% (0)Unmarried:
100.0% (79)
Women who did not give birth in the past 12 months Now married:
55.8% (99)Unmarried:
44.2% (79)
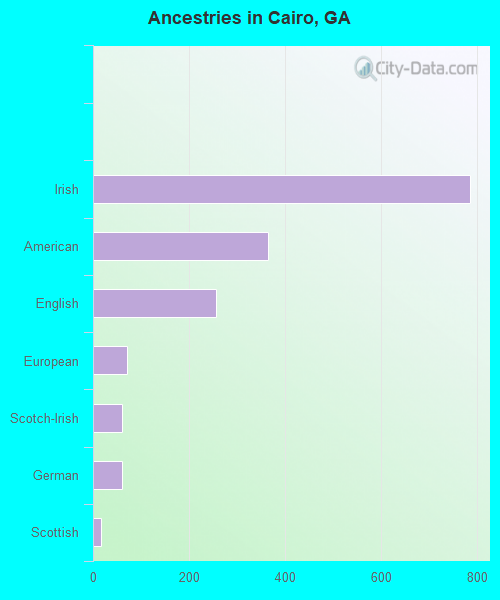
Ancestries in Cairo
786 11.8% Irish364 5.4% American256 3.8% English70 1.0% European61 0.9% Scotch-Irish60 0.9% German17 0.3% Scottish7 0.1% Norwegian6 0.09% British1 0.01% Russian
Children Nativity (place of birth) in Cairo
Children under 6 years - Living with two parents Both parents native 76 100.0% NativeBoth parents foreign-born 13 100.0% NativeChildren under 6 years - Living with one parent Native parent 454 100.0% NativeForeign-born parent 186 100.0% NativeChildren 6 to 17 years - Living with two parents Both parents native 989 100.0% NativeBoth parents foreign-born 52 100.0% NativeOne native, one foreign-born parent 29 100.0% NativeChildren 6 to 17 years - Living with one parent Native parent 756 100.0% NativeForeign-born parent 171 50.3% Native169 49.7% Foreign-born
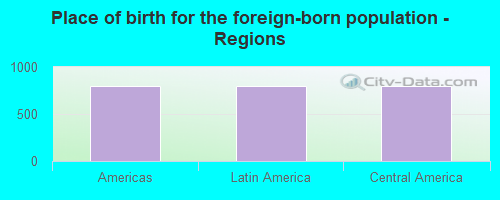
Place of birth for residents in Cairo 803 Americas803 Latin America796 Central America7 South America
Grandparents responsible for own grandchildren in Cairo
Grandparents (30 to 59 years) White / Caucasian 4 100.0% Responsible for grandchildrenBlack or African American 129 100.0% Responsible for grandchildrenWhite alone, not Hispanic / Latino 4 100.0% Responsible for grandchildrenGrandparents (60 years and over) White / Caucasian 36 73.5% Responsible for grandchildren13 26.5% Not responsible for grandchildrenBlack or African American 17 27.6% Responsible for grandchildren44 72.4% Not responsible for grandchildrenWhite alone, not Hispanic / Latino 36 72.5% Responsible for grandchildren14 27.5% Not responsible for grandchildren