Races in Callaway, Florida (FL) Detailed Stats
Data:
Races - White alone (%)
Races - White alone (% change since 2000)
Races - Black alone (%)
Races - Black alone (% change since 2000)
Races - American Indian alone (%)
Races - American Indian alone (% change since 2000)
Races - Asian alone (%)
Races - Asian alone (% change since 2000)
Races - Hispanic (%)
Races - Hispanic (% change since 2000)
Races - Native Hawaiian and Other Pacific Islander alone (%)
Races - Native Hawaiian and Other Pacific Islander alone (% change since 2000)
Races - Two or more races(%)
Races - Two or more races(% change since 2000)
Races - Other race alone (%)
Races - Other race alone (% change since 2000)
Racial diversity
Place of birth - Born in state of residence (%)
Place of birth - Born in state of residence (%) - White
Place of birth - Born in state of residence (%) - Black or African American
Place of birth - Born in state of residence (%) - Asian
Place of birth - Born in state of residence (%) - Hispanic or Latino
Place of birth - Born in state of residence (%) - American Indian and Alaska Native
Place of birth - Born in state of residence (%) - Multirace
Place of birth - Born in state of residence (%) - Other Race
Place of birth - Born in other state (%)
Place of birth - Born in other state (%) - White
Place of birth - Born in other state (%) - Black or African American
Place of birth - Born in other state (%) - Asian
Place of birth - Born in other state (%) - Hispanic or Latino
Place of birth - Born in other state (%) - American Indian and Alaska Native
Place of birth - Born in other state (%) - Multirace
Place of birth - Born in other state (%) - Other Race
Place of birth - Native, outside of US (%)
Place of birth - Native, outside of US (%) - White
Place of birth - Native, outside of US (%) - Black or African American
Place of birth - Native, outside of US (%) - Asian
Place of birth - Native, outside of US (%) - Hispanic or Latino
Place of birth - Native, outside of US (%) - American Indian and Alaska Native
Place of birth - Native, outside of US (%) - Multirace
Place of birth - Native, outside of US (%) - Other Race
Place of birth - Foreign born (%)
Place of birth - Foreign born (%) - White
Place of birth - Foreign born (%) - Black or African American
Place of birth - Foreign born (%) - Asian
Place of birth - Foreign born (%) - Hispanic or Latino
Place of birth - Foreign born (%) - American Indian and Alaska Native
Place of birth - Foreign born (%) - Multirace
Place of birth - Foreign born (%) - Other Race
Residents speaking English at home (%)
Residents speaking English at home - Born in the United States (%)
Residents speaking English at home - Native, born elsewhere (%)
Residents speaking English at home - Foreign born (%)
Residents speaking Spanish at home (%)
Residents speaking Spanish at home - Born in the United States (%)
Residents speaking Spanish at home - Native, born elsewhere (%)
Residents speaking Spanish at home - Foreign born (%)
Residents speaking other language at home (%)
Residents speaking other language at home - Born in the United States (%)
Residents speaking other language at home - Native, born elsewhere (%)
Residents speaking other language at home - Foreign born (%)
Marital status - Never married (%)
Marital status - Now married (%)
Marital status - Separated (%)
Marital status - Widowed (%)
Marital status - Divorced (%)
Ancestries Reported - Arab (%)
Ancestries Reported - Czech (%)
Ancestries Reported - Danish (%)
Ancestries Reported - Dutch (%)
Ancestries Reported - English (%)
Ancestries Reported - French (%)
Ancestries Reported - French Canadian (%)
Ancestries Reported - German (%)
Ancestries Reported - Greek (%)
Ancestries Reported - Hungarian (%)
Ancestries Reported - Irish (%)
Ancestries Reported - Italian (%)
Ancestries Reported - Lithuanian (%)
Ancestries Reported - Norwegian (%)
Ancestries Reported - Polish (%)
Ancestries Reported - Portuguese (%)
Ancestries Reported - Russian (%)
Ancestries Reported - Scotch-Irish (%)
Ancestries Reported - Scottish (%)
Ancestries Reported - Slovak (%)
Ancestries Reported - Subsaharan African (%)
Ancestries Reported - Swedish (%)
Ancestries Reported - Swiss (%)
Ancestries Reported - Ukrainian (%)
Ancestries Reported - United States (%)
Ancestries Reported - Welsh (%)
Ancestries Reported - West Indian (%)
Ancestries Reported - Other (%)
Geographical mobility - Same house 1 year ago (%)
Geographical mobility - Same house 1 year ago (%) - White
Geographical mobility - Same house 1 year ago (%) - Black or African American
Geographical mobility - Same house 1 year ago (%) - Asian
Geographical mobility - Same house 1 year ago (%) - Hispanic or Latino
Geographical mobility - Same house 1 year ago (%) - American Indian and Alaska Native
Geographical mobility - Same house 1 year ago (%) - Multirace
Geographical mobility - Same house 1 year ago (%) - Other Race
Geographical mobility - Moved within same county (%)
Geographical mobility - Moved within same county (%) - White
Geographical mobility - Moved within same county (%) - Black or African American
Geographical mobility - Moved within same county (%) - Asian
Geographical mobility - Moved within same county (%) - Hispanic or Latino
Geographical mobility - Moved within same county (%) - American Indian and Alaska Native
Geographical mobility - Moved within same county (%) - Multirace
Geographical mobility - Moved within same county (%) - Other Race
Geographical mobility - Moved from different county within same state (%)
Geographical mobility - Moved from different county within same state (%) - White
Geographical mobility - Moved from different county within same state (%) - Black or African American
Geographical mobility - Moved from different county within same state (%) - Asian
Geographical mobility - Moved from different county within same state (%) - Hispanic or Latino
Geographical mobility - Moved from different county within same state (%) - American Indian and Alaska Native
Geographical mobility - Moved from different county within same state (%) - Multirace
Geographical mobility - Moved from different county within same state (%) - Other Race
Geographical mobility - Moved from different state (%)
Geographical mobility - Moved from different state (%) - White
Geographical mobility - Moved from different state (%) - Black or African American
Geographical mobility - Moved from different state (%) - Asian
Geographical mobility - Moved from different state (%) - Hispanic or Latino
Geographical mobility - Moved from different state (%) - American Indian and Alaska Native
Geographical mobility - Moved from different state (%) - Multirace
Geographical mobility - Moved from different state (%) - Other Race
Geographical mobility - Moved from abroad (%)
Geographical mobility - Moved from abroad (%) - White
Geographical mobility - Moved from abroad (%) - Black or African American
Geographical mobility - Moved from abroad (%) - Asian
Geographical mobility - Moved from abroad (%) - Hispanic or Latino
Geographical mobility - Moved from abroad (%) - American Indian and Alaska Native
Geographical mobility - Moved from abroad (%) - Multirace
Geographical mobility - Moved from abroad (%) - Other Race
Place of birth for the foreign-born population - Ireland (%)
Place of birth for the foreign-born population - Denmark (%)
Place of birth for the foreign-born population - Norway (%)
Place of birth for the foreign-born population - Sweden (%)
Place of birth for the foreign-born population - United Kingdom (%)
Place of birth for the foreign-born population - England (%)
Place of birth for the foreign-born population - Scotland (%)
Place of birth for the foreign-born population - Other Northern Europe (%)
Place of birth for the foreign-born population - Austria (%)
Place of birth for the foreign-born population - Belgium (%)
Place of birth for the foreign-born population - France (%)
Place of birth for the foreign-born population - Germany (%)
Place of birth for the foreign-born population - Netherlands (%)
Place of birth for the foreign-born population - Switzerland (%)
Place of birth for the foreign-born population - Other Western Europe (%)
Place of birth for the foreign-born population - Greece (%)
Place of birth for the foreign-born population - Italy (%)
Place of birth for the foreign-born population - Portugal (%)
Place of birth for the foreign-born population - Spain (%)
Place of birth for the foreign-born population - Other Southern Europe (%)
Place of birth for the foreign-born population - Albania (%)
Place of birth for the foreign-born population - Belarus (%)
Place of birth for the foreign-born population - Bosnia and Herzegovina (%)
Place of birth for the foreign-born population - Bulgaria (%)
Place of birth for the foreign-born population - Croatia (%)
Place of birth for the foreign-born population - Czechoslovakia (%)
Place of birth for the foreign-born population - Hungary (%)
Place of birth for the foreign-born population - Latvia (%)
Place of birth for the foreign-born population - Lithuania (%)
Place of birth for the foreign-born population - North Macedonia (Macedonia) (%)
Place of birth for the foreign-born population - Moldova (%)
Place of birth for the foreign-born population - Poland (%)
Place of birth for the foreign-born population - Romania (%)
Place of birth for the foreign-born population - Russia (%)
Place of birth for the foreign-born population - Serbia (%)
Place of birth for the foreign-born population - Ukraine (%)
Place of birth for the foreign-born population - Other Eastern Europe (%)
Place of birth for the foreign-born population - China (%)
Place of birth for the foreign-born population - Hong Kong (%)
Place of birth for the foreign-born population - Taiwan (%)
Place of birth for the foreign-born population - Japan (%)
Place of birth for the foreign-born population - Korea (%)
Place of birth for the foreign-born population - Other Eastern Asia (%)
Place of birth for the foreign-born population - Afghanistan (%)
Place of birth for the foreign-born population - Bangladesh (%)
Place of birth for the foreign-born population - India (%)
Place of birth for the foreign-born population - Iran (%)
Place of birth for the foreign-born population - Kazakhstan (%)
Place of birth for the foreign-born population - Nepal (%)
Place of birth for the foreign-born population - Pakistan (%)
Place of birth for the foreign-born population - Sri Lanka (%)
Place of birth for the foreign-born population - Uzbekistan (%)
Place of birth for the foreign-born population - Other South Central Asia (%)
Place of birth for the foreign-born population - Burma (%)
Place of birth for the foreign-born population - Cambodia (%)
Place of birth for the foreign-born population - Indonesia (%)
Place of birth for the foreign-born population - Laos (%)
Place of birth for the foreign-born population - Malaysia (%)
Place of birth for the foreign-born population - Philippines (%)
Place of birth for the foreign-born population - Singapore (%)
Place of birth for the foreign-born population - Thailand (%)
Place of birth for the foreign-born population - Vietnam (%)
Place of birth for the foreign-born population - Other South Eastern Asia (%)
Place of birth for the foreign-born population - Armenia (%)
Place of birth for the foreign-born population - Iraq (%)
Place of birth for the foreign-born population - Israel (%)
Place of birth for the foreign-born population - Jordan (%)
Place of birth for the foreign-born population - Kuwait (%)
Place of birth for the foreign-born population - Lebanon (%)
Place of birth for the foreign-born population - Saudi Arabia (%)
Place of birth for the foreign-born population - Syria (%)
Place of birth for the foreign-born population - Turkey (%)
Place of birth for the foreign-born population - Yemen (%)
Place of birth for the foreign-born population - Other Western Asia (%)
Place of birth for the foreign-born population - Eritrea (%)
Place of birth for the foreign-born population - Ethiopia (%)
Place of birth for the foreign-born population - Kenya (%)
Place of birth for the foreign-born population - Somalia (%)
Place of birth for the foreign-born population - Uganda (%)
Place of birth for the foreign-born population - Zimbabwe (%)
Place of birth for the foreign-born population - Other Eastern Africa (%)
Place of birth for the foreign-born population - Cameroon (%)
Place of birth for the foreign-born population - Congo (%)
Place of birth for the foreign-born population - Democratic Republic of Congo (Zaire) (%)
Place of birth for the foreign-born population - Other Middle Africa (%)
Place of birth for the foreign-born population - Egypt (%)
Place of birth for the foreign-born population - Morocco (%)
Place of birth for the foreign-born population - Sudan (%)
Place of birth for the foreign-born population - Other Northern Africa (%)
Place of birth for the foreign-born population - South Africa (%)
Place of birth for the foreign-born population - Other Southern Africa (%)
Place of birth for the foreign-born population - Cabo Verde (%)
Place of birth for the foreign-born population - Ghana (%)
Place of birth for the foreign-born population - Liberia (%)
Place of birth for the foreign-born population - Nigeria (%)
Place of birth for the foreign-born population - Senegal (%)
Place of birth for the foreign-born population - Sierra Leone (%)
Place of birth for the foreign-born population - Other Western Africa (%)
Place of birth for the foreign-born population - Australia (%)
Place of birth for the foreign-born population - New Zealand (%)
Place of birth for the foreign-born population - Fiji (%)
Place of birth for the foreign-born population - Micronesia (%)
Place of birth for the foreign-born population - Bahamas (%)
Place of birth for the foreign-born population - Barbados (%)
Place of birth for the foreign-born population - Cuba (%)
Place of birth for the foreign-born population - Dominica (%)
Place of birth for the foreign-born population - Dominican Republic (%)
Place of birth for the foreign-born population - Grenada (%)
Place of birth for the foreign-born population - Haiti (%)
Place of birth for the foreign-born population - Jamaica (%)
Place of birth for the foreign-born population - St. Vincent and the Grenadines (%)
Place of birth for the foreign-born population - Trinidad and Tobago (%)
Place of birth for the foreign-born population - West Indies (%)
Place of birth for the foreign-born population - Other Caribbean (%)
Place of birth for the foreign-born population - Belize (%)
Place of birth for the foreign-born population - Costa Rica (%)
Place of birth for the foreign-born population - El Salvador (%)
Place of birth for the foreign-born population - Guatemala (%)
Place of birth for the foreign-born population - Honduras (%)
Place of birth for the foreign-born population - Mexico (%)
Place of birth for the foreign-born population - Nicaragua (%)
Place of birth for the foreign-born population - Panama (%)
Place of birth for the foreign-born population - Other Central America (%)
Place of birth for the foreign-born population - Argentina (%)
Place of birth for the foreign-born population - Bolivia (%)
Place of birth for the foreign-born population - Brazil (%)
Place of birth for the foreign-born population - Chile (%)
Place of birth for the foreign-born population - Colombia (%)
Place of birth for the foreign-born population - Ecuador (%)
Place of birth for the foreign-born population - Guyana (%)
Place of birth for the foreign-born population - Peru (%)
Place of birth for the foreign-born population - Uruguay (%)
Place of birth for the foreign-born population - Venezuela (%)
Place of birth for the foreign-born population - Other South America (%)
Place of birth for the foreign-born population - Canada (%)
Place of birth for the foreign-born population - Other Northern America (%)
Place of birth for the foreign-born population - Other (%)
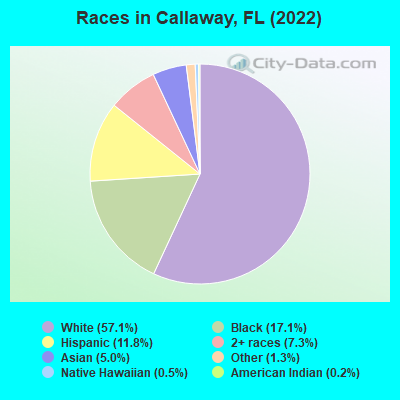
According to 2022 data, the most numerous races in Callaway, FL are White alone (7,858 residents), Hispanic (1,622 residents), and Black alone (2,359 residents). 86.1% of Callaway residents speak English at home. 11.1% of Callaway, FL residents are foreign-born (5.4% born in Latin America, 4.2% born in Asia), which is 89.2% less than the foreign-born rate of 21.0% across the entire state of Florida.
Race distribution in Callaway
2000 2022
10,458,509 65.4% White alone 2,682,715 16.8% Hispanic 2,264,268 14.2% Black alone 261,693 1.6% Asian alone 236,954 1.5% Two or more races 42,358 0.3% American Indian alone 28,994 0.2% Other race alone 6,887 0.04% Native Hawaiian and Other
11,309,403 50.8% White alone 6,025,039 27.1% Hispanic 3,241,015 14.6% Black alone 861,630 3.9% Two or more races 623,692 2.8% Asian alone 152,054 0.7% Other race alone 22,504 0.1% American Indian alone 9,486 0.04% Native Hawaiian and Other
Income and house value in Callaway Median household income in 2022 $78,487 White non-Hispanic householders$46,210 Black householders$30,400 Asian householders$35,136 Some other race householders$85,363 Two or more races householders$68,737 Hispanic or Latino race householdersMedian 2022 house value $259,943 White Non-Hispanic householders$264,131 Black or African American householders$265,248 American Indian or Alaska Native householders $256,592 Asian householders$195,446 Some other race householders$383,912 Two or more races householders$221,412 Hispanic or Latino householders
Median age by race in Callaway
43.2 Median age for White residents44.3 41.5 30.3 Median age for Black or African American residents32.3 26.3 -598,566,307.6 Median age for American Indian / Alaska Native residents-611,418,047.3 -594,925,633.7 52.9 Median age for Asian residents32.1 54.6 -679,849,340.2 Median age for Native Hawaiian / Pacific Islander residents-858,307,848.3 -443,298,968.6 20.0 Median age for Other race residents26.7 24.7 27.0 Median age for Two or more races residents23.1 27.9 43.1 Median age for White alone residents45.8 40.6 36.4 Median age for Hispanic or Latino residents32.9 36.5
Owner/renter occupied households by race in Callaway
House owners and renters - White residents 2,552 69.9% Owner occupied1,099 30.1% Renter occupiedHouse owners and renters - Black or African American residents 532 34.8% Owner occupied996 65.2% Renter occupiedHouse owners and renters - Asian residents 103 58.2% Owner occupied74 41.8% Renter occupiedHouse owners and renters - Other race residents 41 22.0% Owner occupied147 78.0% Renter occupiedHouse owners and renters - Two or more races residents 134 40.0% Owner occupied201 60.0% Renter occupiedHouse owners and renters - White alone residents 2,415 69.2% Owner occupied1,076 30.8% Renter occupiedHouse owners and renters - Hispanic or Latino residents 233 47.6% Owner occupied256 52.4% Renter occupied
Language usage in Callaway
English speakers - Total 86.1% of residents of Callaway speak English at home.
7.2% of residents speak Spanish at home 359 38.4% Speak English very well575 61.6% Speak English less than very well6.7% of residents speak other language at home 724 83.5% Speak English very well143 16.5% Speak English less than very well
English speakers - Born in the United States 93.8% of residents of Callaway speak English at home.
1.4% of residents speak Spanish at home 47 50.5% Speak English very well46 49.5% Speak English less than very well5.8% of residents speak other language at home 380 99.0% Speak English very well4 1.0% Speak English less than very well
English speakers - Native, born elsewhere 34.9% of residents of Callaway speak English at home.
61.2% of residents speak Spanish at home 147 37.1% Speak English very well249 62.9% Speak English less than very well10.2% of residents speak other language at home 57 86.4% Speak English very well9 13.6% Speak English less than very well
English speakers - Foreign-born 39.4% of residents of Callaway speak English at home.
26.7% of residents speak Spanish at home 42 11.8% Speak English very well315 88.2% Speak English less than very well30.4% of residents speak other language at home 286 70.3% Speak English very well121 29.7% Speak English less than very well
White (Caucasian) - Speak only English Native:
93.9% (7,066)Foreign-born:
70.0% (261)
White (Caucasian) - Speak another language Native:
5.1% (382)Foreign-born:
33.4% (124)
Black or African American - Speak only English Native:
99.8% (2,057)Foreign-born:
79.7% (240)
Asian - Speak only English Native:
53.0% (126)Foreign-born:
34.9% (152)
Asian - Speak another language Native:
34.4% (82)Foreign-born:
66.9% (292)
Other race - Speak another language Native:
10.9% (28)Foreign-born:
98.4% (315)
Two or more races - Speak another language Native:
37.2% (585)Foreign-born:
97.0% (48)
White alone - Speak only English Native:
94.8% (6,927)Foreign-born:
55.7% (73)
White alone - Speak another language Native:
4.8% (351)Foreign-born:
46.8% (62)
Hispanic or Latino - Speak only English Native:
48.8% (439)Foreign-born:
36.5% (204)
Hispanic or Latino - Speak another language Native:
52.0% (467)Foreign-born:
62.6% (350)
Foreign-born residents in Callaway 1,527 residents are foreign born (5.4% Latin America , 4.2% Asia ).
This city:
11.1%Florida:
21.1%
Marital status for residents in Callaway Marital status - White (Caucasian) population 15 years and over
Males 29.9% Never married50.7% Now married3.0% Separated1.2% Widowed15.2% DivorcedFemales 21.6% Never married52.5% Now married2.1% Separated8.4% Widowed15.4% DivorcedWomen who gave birth in the past 12 months Now married:
49.6% (65)Unmarried:
50.4% (66)
Women who did not give birth in the past 12 months Now married:
48.8% (728)Unmarried:
51.2% (763)
Marital status - Black or African American population 15 years and over
Males 50.9% Never married27.9% Now married7.7% Separated0.0% Widowed13.4% DivorcedFemales 60.6% Never married18.9% Now married2.3% Separated3.9% Widowed14.3% DivorcedWomen who did not give birth in the past 12 months Now married:
11.7% (84)Unmarried:
88.3% (635)
Marital status - Asian population 15 years and over
Males 37.9% Never married47.0% Now married15.2% Separated0.0% Widowed0.0% DivorcedFemales 19.1% Never married58.2% Now married5.9% Separated5.2% Widowed11.6% DivorcedWomen who gave birth in the past 12 months Now married:
100.0% (68)Unmarried:
0.0% (0)
Women who did not give birth in the past 12 months Now married:
20.6% (27)Unmarried:
79.4% (104)
Marital status - Other race population 15 years and over
Males 52.8% Never married36.5% Now married0.0% Separated0.0% Widowed10.7% DivorcedFemales 38.4% Never married49.7% Now married0.0% Separated0.0% Widowed11.9% DivorcedWomen who gave birth in the past 12 months Now married:
0.0% (0)Unmarried:
100.0% (97)
Women who did not give birth in the past 12 months Now married:
80.4% (123)Unmarried:
19.6% (30)
Marital status - Two or more races population 15 years and over
Males 61.0% Never married33.0% Now married0.0% Separated4.3% Widowed1.8% DivorcedFemales 17.6% Never married31.6% Now married0.0% Separated25.7% Widowed25.1% DivorcedWomen who gave birth in the past 12 months Now married:
100.0% (19)Unmarried:
0.0% (0)
Women who did not give birth in the past 12 months Now married:
24.5% (82)Unmarried:
75.5% (255)
Marital status - White alone, not Hispanic / Latino population 15 years and over
Males 30.1% Never married52.0% Now married3.2% Separated1.3% Widowed13.5% DivorcedFemales 20.4% Never married53.8% Now married2.2% Separated8.7% Widowed14.8% DivorcedWomen who gave birth in the past 12 months Now married:
49.6% (67)Unmarried:
50.4% (68)
Women who did not give birth in the past 12 months Now married:
50.5% (705)Unmarried:
49.5% (690)
Marital status - Hispanic or Latino population 15 years and over
Males 36.6% Never married38.8% Now married4.2% Separated0.0% Widowed20.5% DivorcedFemales 39.7% Never married38.6% Now married0.0% Separated2.4% Widowed19.2% DivorcedWomen who gave birth in the past 12 months Now married:
0.0% (0)Unmarried:
100.0% (79)
Women who did not give birth in the past 12 months Now married:
47.4% (140)Unmarried:
52.6% (155)
Ancestries in Callaway
807 10.9% American789 10.7% English357 4.8% German340 4.6% Irish281 3.8% French224 3.0% Italian161 2.2% Scottish144 1.9% European116 1.6% Scotch-Irish112 1.5% British West Indian69 0.9% Trinidadian and Tobagonian65 0.9% Moroccan49 0.7% Scandinavian47 0.6% French Canadian38 0.5% Polish38 0.5% Jamaican33 0.4% Norwegian22 0.3% British22 0.3% Eastern European13 0.2% Barbadian11 0.1% Hungarian11 0.1% Swedish10 0.1% Pennsylvania German8 0.1% Egyptian8 0.1% Syrian8 0.1% Dutch7 0.09% Latvian7 0.09% Welsh
Geographical mobility in Callaway Same house 1 year ago 6,359 77.9% White (Caucasian)1,611 66.3% Black or African American40 100.0% American Indian / Alaska Native654 97.1% Asian318 34.1% Other race1,150 68.8% Two or more races5,917 76.6% White alone, not Hispanic / Latino1,242 80.6% Hispanic or LatinoMoved within same county 591 7.2% White / Caucasian265 10.9% Black or African American6 0.9% Asian32 100.0% Native Hawaiian / Pacific Islander317 19.0% Two or more races583 7.5% White alone, not Hispanic / Latino58 3.8% Hispanic or LatinoMoved within same state 89 1.1% White / Caucasian321 13.2% Black or African American2 0.1% Two or more races85 1.1% White alone, not Hispanic / Latino7 0.5% Hispanic or LatinoMoved from different state 1,121 13.7% White / Caucasian296 12.2% Black or African American747 80.2% Other race205 12.2% Two or more races1,104 14.3% White alone, not Hispanic / Latino324 21.0% Hispanic or LatinoMoved from abroad 34 0.4% White110 4.5% Black or African American21 3.2% Asian39 2.3% Two or more races41 0.5% White alone, not Hispanic / Latino38 2.4% Hispanic or Latino
Children Nativity (place of birth) in Callaway
Children under 6 years - Living with two parents Both parents native 452 100.0% NativeBoth parents foreign-born 34 100.0% NativeOne native, one foreign-born parent 51 100.0% NativeChildren under 6 years - Living with one parent Native parent 259 100.0% NativeForeign-born parent 154 100.0% NativeChildren 6 to 17 years - Living with two parents Both parents native 726 100.0% Native0 0.0% Foreign-bornBoth parents foreign-born 184 100.0% NativeOne native, one foreign-born parent 66 80.1% Native16 19.9% Foreign-bornChildren 6 to 17 years - Living with one parent Native parent 626 100.0% NativeForeign-born parent 27 50.6% Native26 49.4% Foreign-born
Grandparents responsible for own grandchildren in Callaway
Grandparents (30 to 59 years) White / Caucasian 120 76.5% Responsible for grandchildren37 23.5% Not responsible for grandchildrenBlack or African American 9 39.4% Responsible for grandchildren13 60.6% Not responsible for grandchildrenTwo or more races 20 100.0% Not responsible for grandchildrenWhite alone, not Hispanic / Latino 118 71.1% Responsible for grandchildren48 28.9% Not responsible for grandchildrenHispanic or Latino 12 51.4% Responsible for grandchildren11 48.6% Not responsible for grandchildrenGrandparents (60 years and over) White / Caucasian 77 37.2% Responsible for grandchildren131 62.8% Not responsible for grandchildrenBlack or African American 62 100.0% Responsible for grandchildrenWhite alone, not Hispanic / Latino 77 31.9% Responsible for grandchildren166 68.1% Not responsible for grandchildren