Races in Castle Rock, Colorado (CO) Detailed Stats
Data:
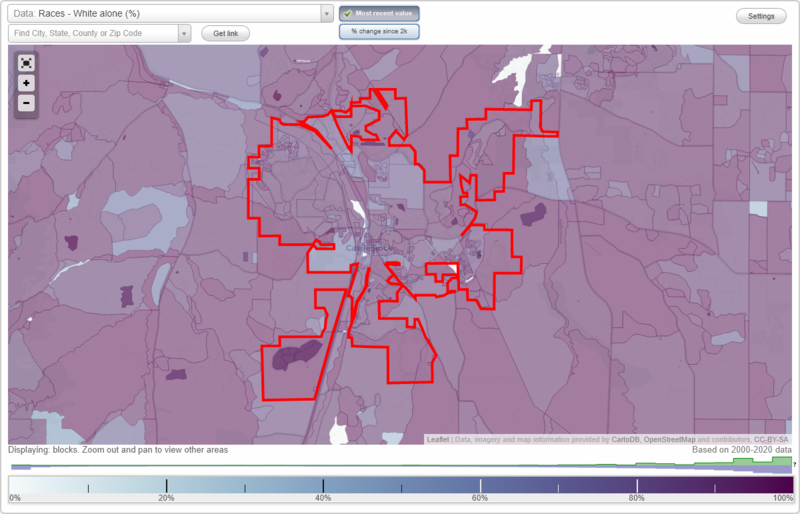
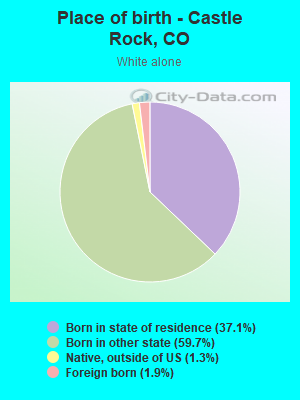
Races - White alone (%)
Races - White alone (% change since 2000)
Races - Black alone (%)
Races - Black alone (% change since 2000)
Races - American Indian alone (%)
Races - American Indian alone (% change since 2000)
Races - Asian alone (%)
Races - Asian alone (% change since 2000)
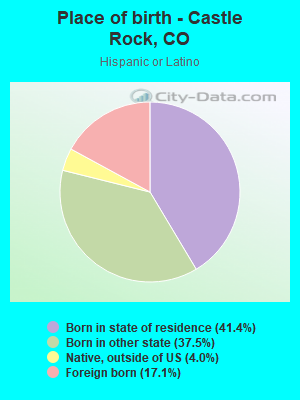
Races - Hispanic (%)
Races - Hispanic (% change since 2000)
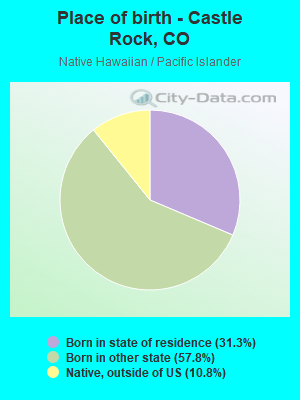
Races - Native Hawaiian and Other Pacific Islander alone (%)
Races - Native Hawaiian and Other Pacific Islander alone (% change since 2000)
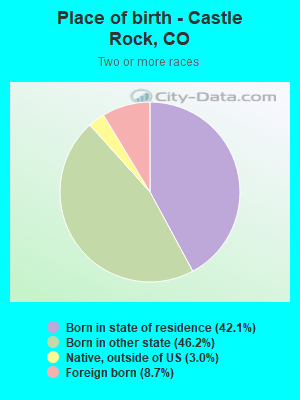
Races - Two or more races(%)
Races - Two or more races(% change since 2000)
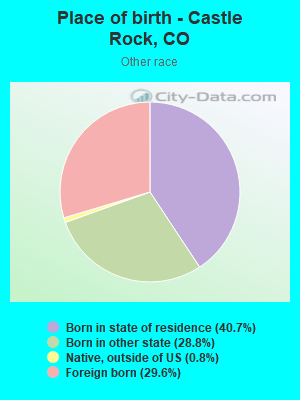
Races - Other race alone (%)
Races - Other race alone (% change since 2000)
Racial diversity
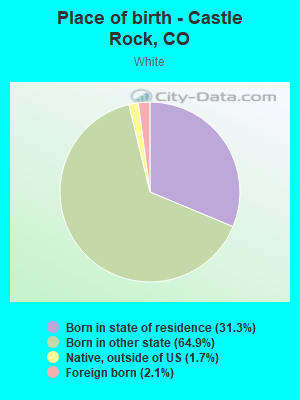
Place of birth - Born in state of residence (%)
Place of birth - Born in state of residence (%) - White
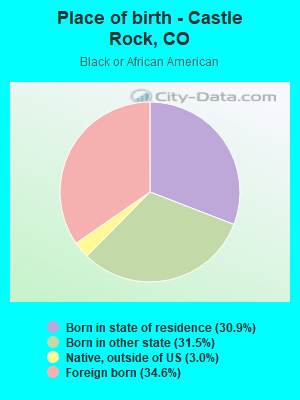
Place of birth - Born in state of residence (%) - Black or African American
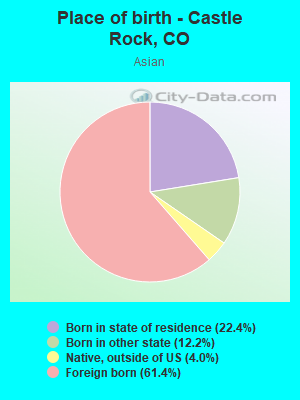
Place of birth - Born in state of residence (%) - Asian
Place of birth - Born in state of residence (%) - Hispanic or Latino
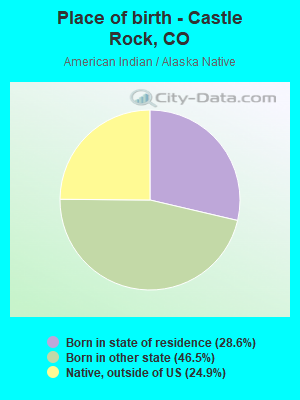
Place of birth - Born in state of residence (%) - American Indian and Alaska Native
Place of birth - Born in state of residence (%) - Multirace
Place of birth - Born in state of residence (%) - Other Race
Place of birth - Born in other state (%)
Place of birth - Born in other state (%) - White
Place of birth - Born in other state (%) - Black or African American
Place of birth - Born in other state (%) - Asian
Place of birth - Born in other state (%) - Hispanic or Latino
Place of birth - Born in other state (%) - American Indian and Alaska Native
Place of birth - Born in other state (%) - Multirace
Place of birth - Born in other state (%) - Other Race
Place of birth - Native, outside of US (%)
Place of birth - Native, outside of US (%) - White
Place of birth - Native, outside of US (%) - Black or African American
Place of birth - Native, outside of US (%) - Asian
Place of birth - Native, outside of US (%) - Hispanic or Latino
Place of birth - Native, outside of US (%) - American Indian and Alaska Native
Place of birth - Native, outside of US (%) - Multirace
Place of birth - Native, outside of US (%) - Other Race
Place of birth - Foreign born (%)
Place of birth - Foreign born (%) - White
Place of birth - Foreign born (%) - Black or African American
Place of birth - Foreign born (%) - Asian
Place of birth - Foreign born (%) - Hispanic or Latino
Place of birth - Foreign born (%) - American Indian and Alaska Native
Place of birth - Foreign born (%) - Multirace
Place of birth - Foreign born (%) - Other Race
Residents speaking English at home (%)
Residents speaking English at home - Born in the United States (%)
Residents speaking English at home - Native, born elsewhere (%)
Residents speaking English at home - Foreign born (%)
Residents speaking Spanish at home (%)
Residents speaking Spanish at home - Born in the United States (%)
Residents speaking Spanish at home - Native, born elsewhere (%)
Residents speaking Spanish at home - Foreign born (%)
Residents speaking other language at home (%)
Residents speaking other language at home - Born in the United States (%)
Residents speaking other language at home - Native, born elsewhere (%)
Residents speaking other language at home - Foreign born (%)
Marital status - Never married (%)
Marital status - Now married (%)
Marital status - Separated (%)
Marital status - Widowed (%)
Marital status - Divorced (%)
Ancestries Reported - Arab (%)
Ancestries Reported - Czech (%)
Ancestries Reported - Danish (%)
Ancestries Reported - Dutch (%)
Ancestries Reported - English (%)
Ancestries Reported - French (%)
Ancestries Reported - French Canadian (%)
Ancestries Reported - German (%)
Ancestries Reported - Greek (%)
Ancestries Reported - Hungarian (%)
Ancestries Reported - Irish (%)
Ancestries Reported - Italian (%)
Ancestries Reported - Lithuanian (%)
Ancestries Reported - Norwegian (%)
Ancestries Reported - Polish (%)
Ancestries Reported - Portuguese (%)
Ancestries Reported - Russian (%)
Ancestries Reported - Scotch-Irish (%)
Ancestries Reported - Scottish (%)
Ancestries Reported - Slovak (%)
Ancestries Reported - Subsaharan African (%)
Ancestries Reported - Swedish (%)
Ancestries Reported - Swiss (%)
Ancestries Reported - Ukrainian (%)
Ancestries Reported - United States (%)
Ancestries Reported - Welsh (%)
Ancestries Reported - West Indian (%)
Ancestries Reported - Other (%)
Geographical mobility - Same house 1 year ago (%)
Geographical mobility - Same house 1 year ago (%) - White
Geographical mobility - Same house 1 year ago (%) - Black or African American
Geographical mobility - Same house 1 year ago (%) - Asian
Geographical mobility - Same house 1 year ago (%) - Hispanic or Latino
Geographical mobility - Same house 1 year ago (%) - American Indian and Alaska Native
Geographical mobility - Same house 1 year ago (%) - Multirace
Geographical mobility - Same house 1 year ago (%) - Other Race
Geographical mobility - Moved within same county (%)
Geographical mobility - Moved within same county (%) - White
Geographical mobility - Moved within same county (%) - Black or African American
Geographical mobility - Moved within same county (%) - Asian
Geographical mobility - Moved within same county (%) - Hispanic or Latino
Geographical mobility - Moved within same county (%) - American Indian and Alaska Native
Geographical mobility - Moved within same county (%) - Multirace
Geographical mobility - Moved within same county (%) - Other Race
Geographical mobility - Moved from different county within same state (%)
Geographical mobility - Moved from different county within same state (%) - White
Geographical mobility - Moved from different county within same state (%) - Black or African American
Geographical mobility - Moved from different county within same state (%) - Asian
Geographical mobility - Moved from different county within same state (%) - Hispanic or Latino
Geographical mobility - Moved from different county within same state (%) - American Indian and Alaska Native
Geographical mobility - Moved from different county within same state (%) - Multirace
Geographical mobility - Moved from different county within same state (%) - Other Race
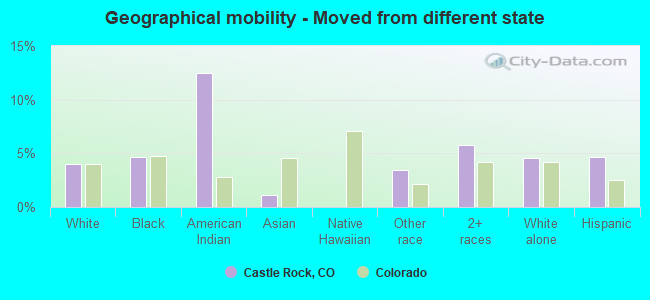
Geographical mobility - Moved from different state (%)
Geographical mobility - Moved from different state (%) - White
Geographical mobility - Moved from different state (%) - Black or African American
Geographical mobility - Moved from different state (%) - Asian
Geographical mobility - Moved from different state (%) - Hispanic or Latino
Geographical mobility - Moved from different state (%) - American Indian and Alaska Native
Geographical mobility - Moved from different state (%) - Multirace
Geographical mobility - Moved from different state (%) - Other Race
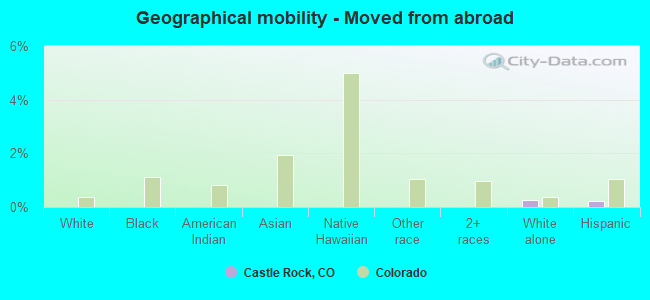
Geographical mobility - Moved from abroad (%)
Geographical mobility - Moved from abroad (%) - White
Geographical mobility - Moved from abroad (%) - Black or African American
Geographical mobility - Moved from abroad (%) - Asian
Geographical mobility - Moved from abroad (%) - Hispanic or Latino
Geographical mobility - Moved from abroad (%) - American Indian and Alaska Native
Geographical mobility - Moved from abroad (%) - Multirace
Geographical mobility - Moved from abroad (%) - Other Race
Place of birth for the foreign-born population - Ireland (%)
Place of birth for the foreign-born population - Denmark (%)
Place of birth for the foreign-born population - Norway (%)
Place of birth for the foreign-born population - Sweden (%)
Place of birth for the foreign-born population - United Kingdom (%)
Place of birth for the foreign-born population - England (%)
Place of birth for the foreign-born population - Scotland (%)
Place of birth for the foreign-born population - Other Northern Europe (%)
Place of birth for the foreign-born population - Austria (%)
Place of birth for the foreign-born population - Belgium (%)
Place of birth for the foreign-born population - France (%)
Place of birth for the foreign-born population - Germany (%)
Place of birth for the foreign-born population - Netherlands (%)
Place of birth for the foreign-born population - Switzerland (%)
Place of birth for the foreign-born population - Other Western Europe (%)
Place of birth for the foreign-born population - Greece (%)
Place of birth for the foreign-born population - Italy (%)
Place of birth for the foreign-born population - Portugal (%)
Place of birth for the foreign-born population - Spain (%)
Place of birth for the foreign-born population - Other Southern Europe (%)
Place of birth for the foreign-born population - Albania (%)
Place of birth for the foreign-born population - Belarus (%)
Place of birth for the foreign-born population - Bosnia and Herzegovina (%)
Place of birth for the foreign-born population - Bulgaria (%)
Place of birth for the foreign-born population - Croatia (%)
Place of birth for the foreign-born population - Czechoslovakia (%)
Place of birth for the foreign-born population - Hungary (%)
Place of birth for the foreign-born population - Latvia (%)
Place of birth for the foreign-born population - Lithuania (%)
Place of birth for the foreign-born population - North Macedonia (Macedonia) (%)
Place of birth for the foreign-born population - Moldova (%)
Place of birth for the foreign-born population - Poland (%)
Place of birth for the foreign-born population - Romania (%)
Place of birth for the foreign-born population - Russia (%)
Place of birth for the foreign-born population - Serbia (%)
Place of birth for the foreign-born population - Ukraine (%)
Place of birth for the foreign-born population - Other Eastern Europe (%)
Place of birth for the foreign-born population - China (%)
Place of birth for the foreign-born population - Hong Kong (%)
Place of birth for the foreign-born population - Taiwan (%)
Place of birth for the foreign-born population - Japan (%)
Place of birth for the foreign-born population - Korea (%)
Place of birth for the foreign-born population - Other Eastern Asia (%)
Place of birth for the foreign-born population - Afghanistan (%)
Place of birth for the foreign-born population - Bangladesh (%)
Place of birth for the foreign-born population - India (%)
Place of birth for the foreign-born population - Iran (%)
Place of birth for the foreign-born population - Kazakhstan (%)
Place of birth for the foreign-born population - Nepal (%)
Place of birth for the foreign-born population - Pakistan (%)
Place of birth for the foreign-born population - Sri Lanka (%)
Place of birth for the foreign-born population - Uzbekistan (%)
Place of birth for the foreign-born population - Other South Central Asia (%)
Place of birth for the foreign-born population - Burma (%)
Place of birth for the foreign-born population - Cambodia (%)
Place of birth for the foreign-born population - Indonesia (%)
Place of birth for the foreign-born population - Laos (%)
Place of birth for the foreign-born population - Malaysia (%)
Place of birth for the foreign-born population - Philippines (%)
Place of birth for the foreign-born population - Singapore (%)
Place of birth for the foreign-born population - Thailand (%)
Place of birth for the foreign-born population - Vietnam (%)
Place of birth for the foreign-born population - Other South Eastern Asia (%)
Place of birth for the foreign-born population - Armenia (%)
Place of birth for the foreign-born population - Iraq (%)
Place of birth for the foreign-born population - Israel (%)
Place of birth for the foreign-born population - Jordan (%)
Place of birth for the foreign-born population - Kuwait (%)
Place of birth for the foreign-born population - Lebanon (%)
Place of birth for the foreign-born population - Saudi Arabia (%)
Place of birth for the foreign-born population - Syria (%)
Place of birth for the foreign-born population - Turkey (%)
Place of birth for the foreign-born population - Yemen (%)
Place of birth for the foreign-born population - Other Western Asia (%)
Place of birth for the foreign-born population - Eritrea (%)
Place of birth for the foreign-born population - Ethiopia (%)
Place of birth for the foreign-born population - Kenya (%)
Place of birth for the foreign-born population - Somalia (%)
Place of birth for the foreign-born population - Uganda (%)
Place of birth for the foreign-born population - Zimbabwe (%)
Place of birth for the foreign-born population - Other Eastern Africa (%)
Place of birth for the foreign-born population - Cameroon (%)
Place of birth for the foreign-born population - Congo (%)
Place of birth for the foreign-born population - Democratic Republic of Congo (Zaire) (%)
Place of birth for the foreign-born population - Other Middle Africa (%)
Place of birth for the foreign-born population - Egypt (%)
Place of birth for the foreign-born population - Morocco (%)
Place of birth for the foreign-born population - Sudan (%)
Place of birth for the foreign-born population - Other Northern Africa (%)
Place of birth for the foreign-born population - South Africa (%)
Place of birth for the foreign-born population - Other Southern Africa (%)
Place of birth for the foreign-born population - Cabo Verde (%)
Place of birth for the foreign-born population - Ghana (%)
Place of birth for the foreign-born population - Liberia (%)
Place of birth for the foreign-born population - Nigeria (%)
Place of birth for the foreign-born population - Senegal (%)
Place of birth for the foreign-born population - Sierra Leone (%)
Place of birth for the foreign-born population - Other Western Africa (%)
Place of birth for the foreign-born population - Australia (%)
Place of birth for the foreign-born population - New Zealand (%)
Place of birth for the foreign-born population - Fiji (%)
Place of birth for the foreign-born population - Micronesia (%)
Place of birth for the foreign-born population - Bahamas (%)
Place of birth for the foreign-born population - Barbados (%)
Place of birth for the foreign-born population - Cuba (%)
Place of birth for the foreign-born population - Dominica (%)
Place of birth for the foreign-born population - Dominican Republic (%)
Place of birth for the foreign-born population - Grenada (%)
Place of birth for the foreign-born population - Haiti (%)
Place of birth for the foreign-born population - Jamaica (%)
Place of birth for the foreign-born population - St. Vincent and the Grenadines (%)
Place of birth for the foreign-born population - Trinidad and Tobago (%)
Place of birth for the foreign-born population - West Indies (%)
Place of birth for the foreign-born population - Other Caribbean (%)
Place of birth for the foreign-born population - Belize (%)
Place of birth for the foreign-born population - Costa Rica (%)
Place of birth for the foreign-born population - El Salvador (%)
Place of birth for the foreign-born population - Guatemala (%)
Place of birth for the foreign-born population - Honduras (%)
Place of birth for the foreign-born population - Mexico (%)
Place of birth for the foreign-born population - Nicaragua (%)
Place of birth for the foreign-born population - Panama (%)
Place of birth for the foreign-born population - Other Central America (%)
Place of birth for the foreign-born population - Argentina (%)
Place of birth for the foreign-born population - Bolivia (%)
Place of birth for the foreign-born population - Brazil (%)
Place of birth for the foreign-born population - Chile (%)
Place of birth for the foreign-born population - Colombia (%)
Place of birth for the foreign-born population - Ecuador (%)
Place of birth for the foreign-born population - Guyana (%)
Place of birth for the foreign-born population - Peru (%)
Place of birth for the foreign-born population - Uruguay (%)
Place of birth for the foreign-born population - Venezuela (%)
Place of birth for the foreign-born population - Other South America (%)
Place of birth for the foreign-born population - Canada (%)
Place of birth for the foreign-born population - Other Northern America (%)
Place of birth for the foreign-born population - Other (%)
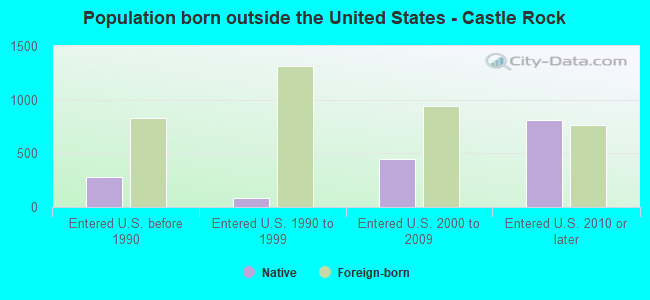
According to 2022 data, the most numerous races in Castle Rock, CO are White alone (54,013 residents), Hispanic (7,457 residents), and Two or more races (2,326 residents). 93.3% of Castle Rock residents speak English at home. 4.7% of Castle Rock, CO residents are foreign-born (2.0% born in Latin America, 1.2% born in Asia, 1.0% born in Europe), which is 90.8% less than the foreign-born rate of 9.0% across the entire state of Colorado.
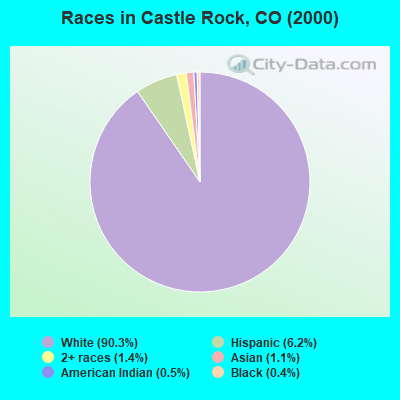
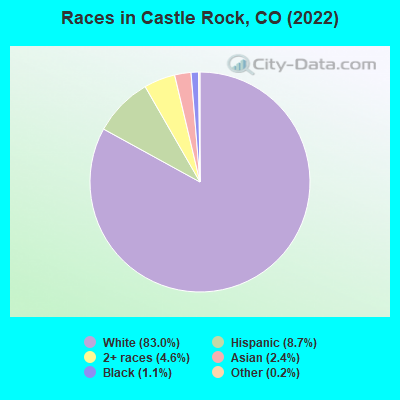
Race distribution in Castle Rock
2000 2022
3,202,880 74.5% White alone 735,601 17.1% Hispanic 158,443 3.7% Black alone 93,277 2.2% Asian alone 72,721 1.7% Two or more races 28,982 0.7% American Indian alone 5,512 0.1% Other race alone 3,845 0.09% Native Hawaiian and Other
3,793,270 65.0% White alone 1,314,962 22.5% Hispanic 268,754 4.6% Two or more races 220,756 3.8% Black alone 182,658 3.1% Asian alone 29,798 0.5% Other race alone 23,389 0.4% American Indian alone 6,339 0.1% Native Hawaiian and Other
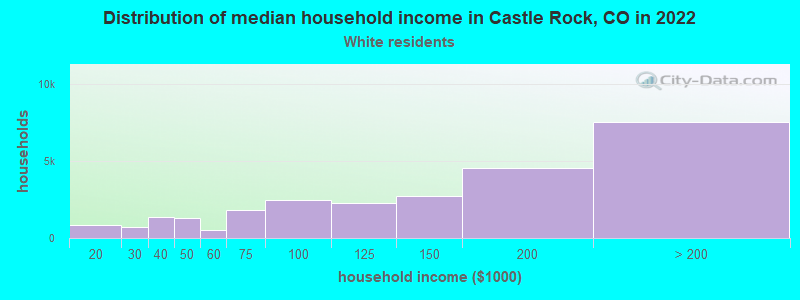
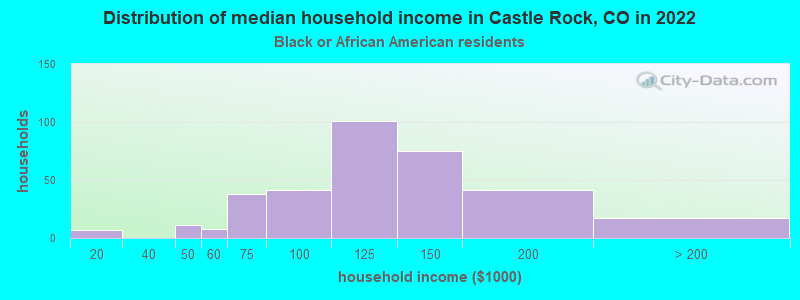
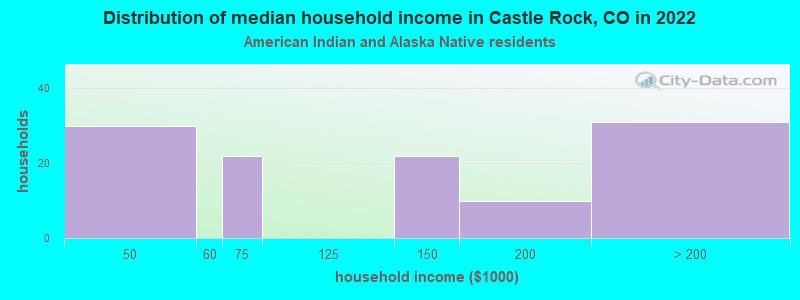
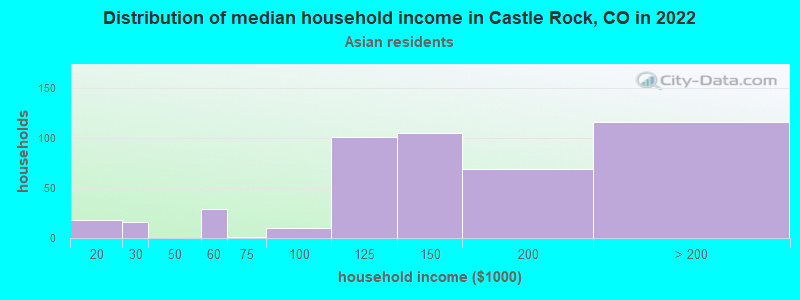
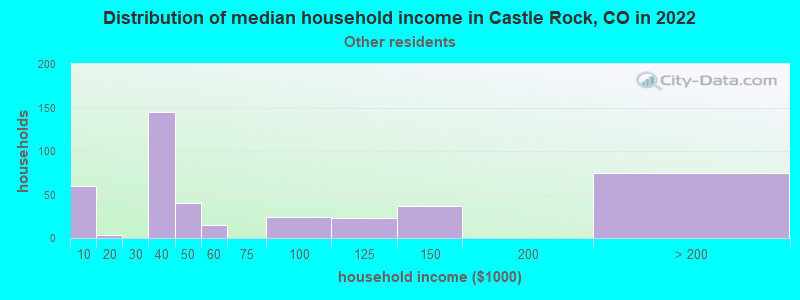
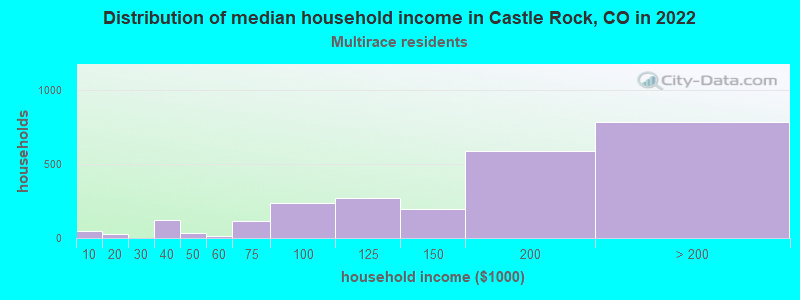
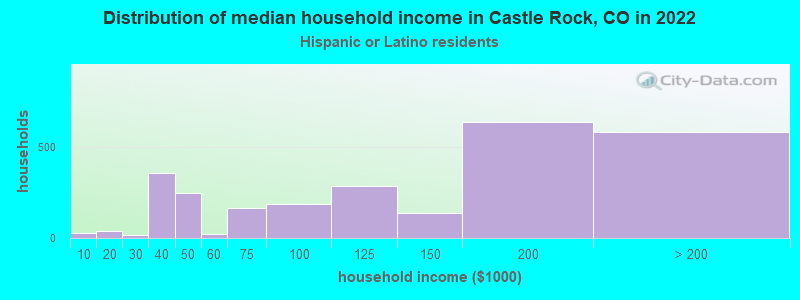
Income and house value in Castle Rock Median household income in 2022 $140,136 White non-Hispanic householders$102,457 Black householders$168,420 American Indian and Alaska Native householdersover $200,000 Asian householders$4,082 Native Hawaiian and other Pacific Islander householders$148,464 Some other race householders$161,946 Two or more races householders$129,825 Hispanic or Latino race householdersMedian 2022 house value $616,022 White Non-Hispanic householders$912,257 Black or African American householders$487,311 American Indian or Alaska Native householders $629,955 Asian householders$563,609 Some other race householders$638,580 Two or more races householders$608,061 Hispanic or Latino householders
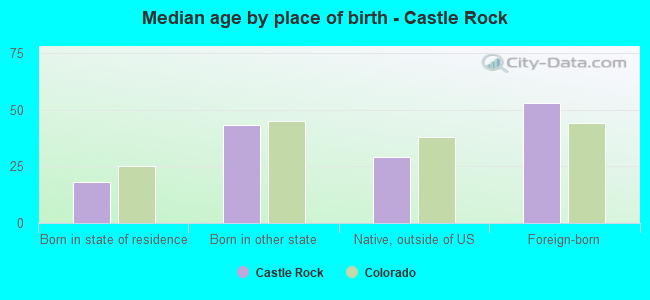
Median age by race in Castle Rock
38.5 Median age for White residents38.8 38.2 52.6 Median age for Black or African American residents17.2 Median age for American Indian / Alaska Native residents41.3 Median age for Asian residents37.1 46.4 48.9 Median age for Native Hawaiian / Pacific Islander residents27.2 Median age for Other race residents26.8 34.9 39.1 Median age for Two or more races residents42.9 14.9 37.7 Median age for White alone residents39.0 37.4 36.1 Median age for Hispanic or Latino residents29.4 39.2
Owner/renter occupied households by race in Castle Rock
House owners and renters - White residents 17,346 81.3% Owner occupied3,979 18.7% Renter occupiedHouse owners and renters - Black or African American residents 69 46.0% Owner occupied81 54.0% Renter occupiedHouse owners and renters - American Indian / Alaska Native residents 61 89.4% Owner occupied7 10.6% Renter occupiedHouse owners and renters - Asian residents 403 81.6% Owner occupied91 18.4% Renter occupiedHouse owners and renters - Native Hawaiian / Pacific Islander residents 49 100.0% Owner occupiedHouse owners and renters - Other race residents 332 63.5% Owner occupied191 36.5% Renter occupiedHouse owners and renters - Two or more races residents 1,538 87.2% Owner occupied226 12.8% Renter occupiedHouse owners and renters - White alone residents 16,653 81.0% Owner occupied3,898 19.0% Renter occupiedHouse owners and renters - Hispanic or Latino residents 1,735 66.5% Owner occupied875 33.5% Renter occupied
Language usage in Castle Rock
English speakers - Total 93.3% of residents of Castle Rock speak English at home.
4.5% of residents speak Spanish at home 1,764 66.3% Speak English very well895 33.7% Speak English less than very well2.8% of residents speak other language at home 1,363 82.9% Speak English very well281 17.1% Speak English less than very well
English speakers - Born in the United States 96.7% of residents of Castle Rock speak English at home.
2.3% of residents speak Spanish at home 701 86.7% Speak English very well108 13.3% Speak English less than very well1.1% of residents speak other language at home 329 85.0% Speak English very well58 15.0% Speak English less than very well
English speakers - Native, born elsewhere 71.6% of residents of Castle Rock speak English at home.
15.2% of residents speak Spanish at home 139 79.4% Speak English very well36 20.6% Speak English less than very well12.4% of residents speak other language at home 143 100.0% Speak English very well
English speakers - Foreign-born 36.2% of residents of Castle Rock speak English at home.
35.4% of residents speak Spanish at home 446 40.1% Speak English very well667 59.9% Speak English less than very well30.2% of residents speak other language at home 728 76.6% Speak English very well222 23.4% Speak English less than very well
White (Caucasian) - Speak only English Native:
97.0% (52,151)Foreign-born:
32.4% (395)
White (Caucasian) - Speak another language Native:
3.7% (2,014)Foreign-born:
69.1% (843)
Black or African American - Speak only English Native:
95.9% (434)Foreign-born:
66.0% (151)
Black or African American - Speak another language Native:
3.0% (14)Foreign-born:
28.3% (65)
Asian - Speak only English Native:
98.0% (483)Foreign-born:
49.8% (395)
Asian - Speak another language Native:
13.4% (66)Foreign-born:
58.7% (466)
Other race - Speak only English Native:
69.4% (828)Foreign-born:
8.9% (50)
Other race - Speak another language Native:
29.4% (351)Foreign-born:
90.8% (507)
Two or more races - Speak only English Native:
84.0% (3,676)Foreign-born:
36.5% (160)
Two or more races - Speak another language Native:
6.2% (272)Foreign-born:
40.4% (177)
White alone - Speak only English Native:
96.5% (51,366)Foreign-born:
39.0% (415)
White alone - Speak another language Native:
3.4% (1,788)Foreign-born:
61.1% (649)
Hispanic or Latino - Speak another language Native:
28.7% (1,285)Foreign-born:
97.8% (1,517)
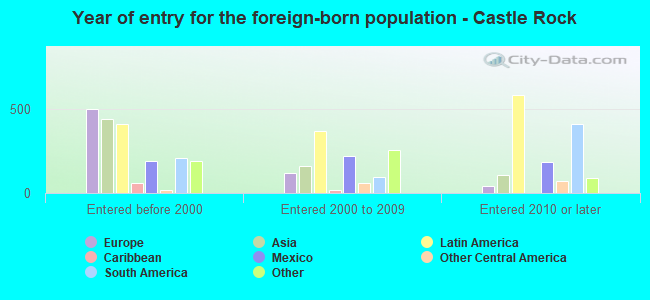
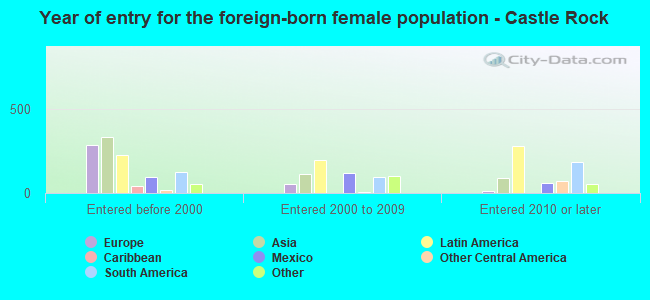
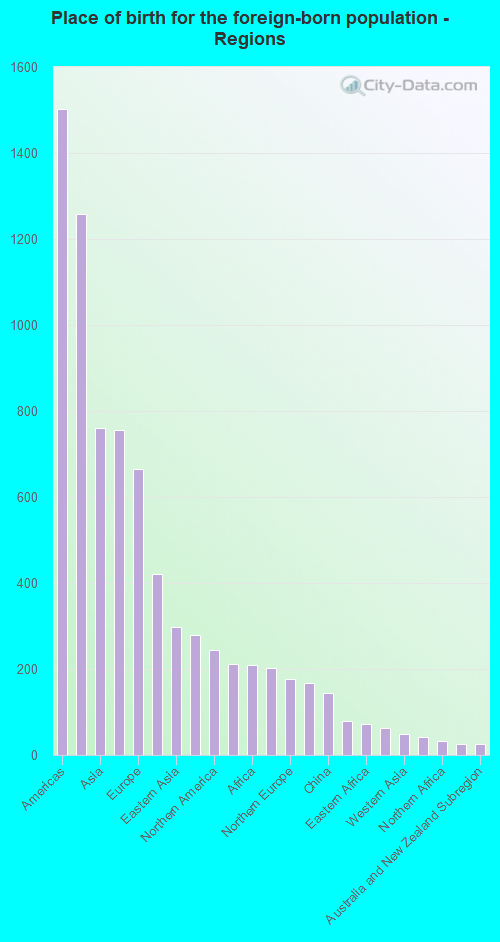
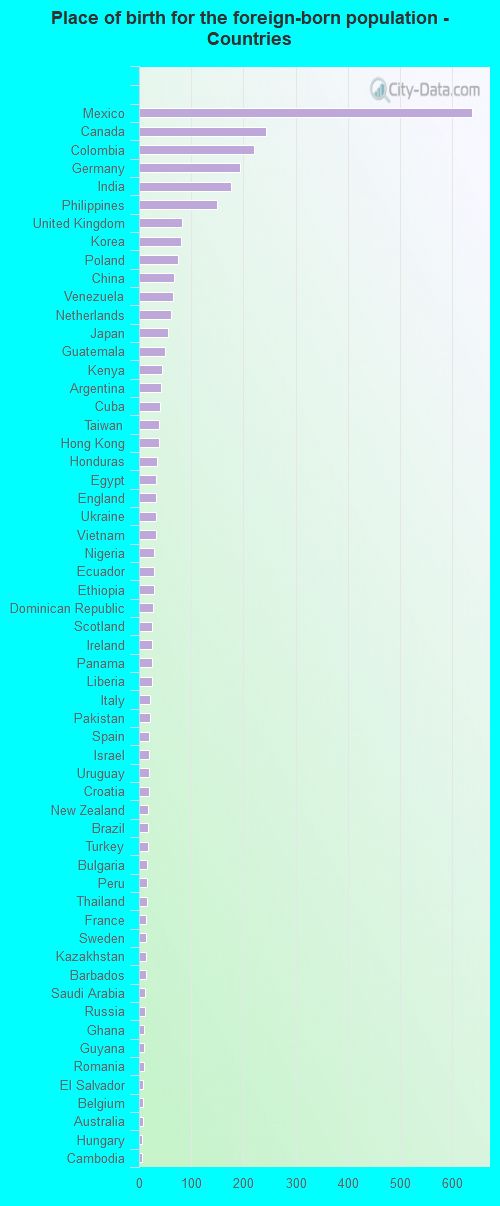
Foreign-born residents in Castle Rock 3,164 residents are foreign born (2.0% Latin America , 1.2% Asia , 1.0% Europe ).
This city:
4.7%Colorado:
100.0%
Marital status for residents in Castle Rock Marital status - White (Caucasian) population 15 years and over
Males 28.0% Never married62.8% Now married1.4% Separated1.5% Widowed6.3% DivorcedFemales 25.3% Never married59.0% Now married2.2% Separated5.1% Widowed8.5% DivorcedWomen who gave birth in the past 12 months Now married:
65.8% (296)Unmarried:
34.2% (153)
Women who did not give birth in the past 12 months Now married:
58.7% (8,353)Unmarried:
41.3% (5,885)
Marital status - Black or African American population 15 years and over
Males 17.4% Never married70.3% Now married0.0% Separated0.0% Widowed12.3% DivorcedFemales 34.6% Never married14.8% Now married3.5% Separated8.5% Widowed38.7% DivorcedWomen who did not give birth in the past 12 months Now married:
17.7% (46)Unmarried:
82.3% (211)
Marital status - American Indian / Alaska Native population 15 years and over
Males 8.5% Never married73.6% Now married0.0% Separated0.0% Widowed17.9% DivorcedFemales 20.7% Never married79.3% Now married0.0% Separated0.0% Widowed0.0% DivorcedWomen who did not give birth in the past 12 months Now married:
77.6% (55)Unmarried:
22.4% (16)
Marital status - Asian population 15 years and over
Males 19.0% Never married78.1% Now married0.0% Separated0.0% Widowed2.9% DivorcedFemales 12.0% Never married65.9% Now married0.0% Separated3.3% Widowed18.8% DivorcedWomen who gave birth in the past 12 months Now married:
51.8% (35)Unmarried:
48.2% (33)
Women who did not give birth in the past 12 months Now married:
70.0% (306)Unmarried:
30.0% (131)
Marital status - Native Hawaiian / Pacific Islander population 15 years and over
Males 0.0% Never married100.0% Now married0.0% Separated0.0% Widowed0.0% DivorcedFemales 0.0% Never married89.5% Now married0.0% Separated10.5% Widowed0.0% DivorcedMarital status - Other race population 15 years and over
Males 40.0% Never married55.1% Now married0.0% Separated1.9% Widowed3.0% DivorcedFemales 13.0% Never married50.3% Now married16.0% Separated0.0% Widowed20.7% DivorcedWomen who gave birth in the past 12 months Now married:
100.0% (48)Unmarried:
0.0% (0)
Women who did not give birth in the past 12 months Now married:
76.3% (320)Unmarried:
23.7% (99)
Marital status - Two or more races population 15 years and over
Males 37.0% Never married55.0% Now married0.0% Separated0.0% Widowed8.0% DivorcedFemales 27.8% Never married55.0% Now married0.0% Separated2.1% Widowed15.1% DivorcedWomen who gave birth in the past 12 months Now married:
100.0% (34)Unmarried:
0.0% (0)
Women who did not give birth in the past 12 months Now married:
48.1% (643)Unmarried:
51.9% (693)
Marital status - White alone, not Hispanic / Latino population 15 years and over
Males 27.7% Never married63.1% Now married1.5% Separated1.3% Widowed6.3% DivorcedFemales 25.6% Never married59.8% Now married1.6% Separated5.0% Widowed8.0% DivorcedWomen who gave birth in the past 12 months Now married:
62.2% (272)Unmarried:
37.8% (166)
Women who did not give birth in the past 12 months Now married:
58.7% (8,305)Unmarried:
41.3% (5,835)
Marital status - Hispanic or Latino population 15 years and over
Males 36.3% Never married53.9% Now married0.7% Separated1.9% Widowed7.3% DivorcedFemales 19.7% Never married56.4% Now married4.8% Separated4.2% Widowed14.9% DivorcedWomen who gave birth in the past 12 months Now married:
100.0% (56)Unmarried:
0.0% (0)
Women who did not give birth in the past 12 months Now married:
63.5% (1,142)Unmarried:
36.5% (656)
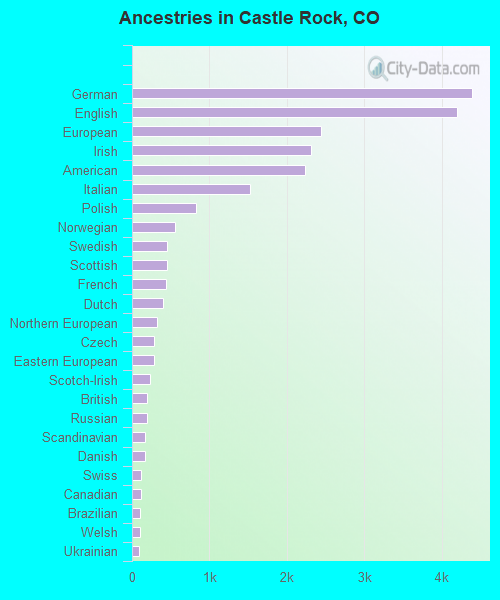
Ancestries in Castle Rock
3,721 14.0% German3,473 13.1% European2,665 10.0% English1,931 7.3% Irish1,727 6.5% American1,366 5.1% Italian589 2.2% Norwegian554 2.1% Polish441 1.7% Scottish439 1.7% Swedish198 0.7% Dutch187 0.7% Scotch-Irish184 0.7% Danish171 0.6% African167 0.6% Canadian161 0.6% Eastern European158 0.6% French Canadian156 0.6% British146 0.5% Northern European145 0.5% French132 0.5% Scandinavian109 0.4% Czech99 0.4% Ukrainian84 0.3% Russian79 0.3% Swiss77 0.3% Finnish58 0.2% Welsh46 0.2% Greek40 0.2% Egyptian37 0.1% Liberian36 0.1% Czechoslovakian34 0.1% Austrian34 0.1% Slovene33 0.1% Brazilian30 0.1% Portuguese30 0.1% Iranian27 0.1% Slovak26 0.10% Romanian19 0.07% Belgian17 0.06% Bulgarian17 0.06% Pennsylvania German15 0.06% Lebanese13 0.05% Croatian12 0.05% Barbadian11 0.04% Yugoslavian9 0.03% Serbian9 0.03% Arab5 0.02% Latvian5 0.02% Hungarian4 0.02% Slavic
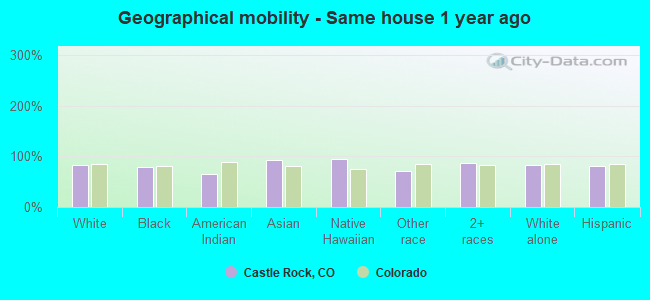
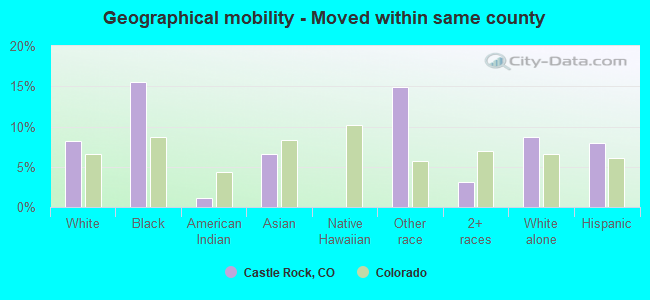
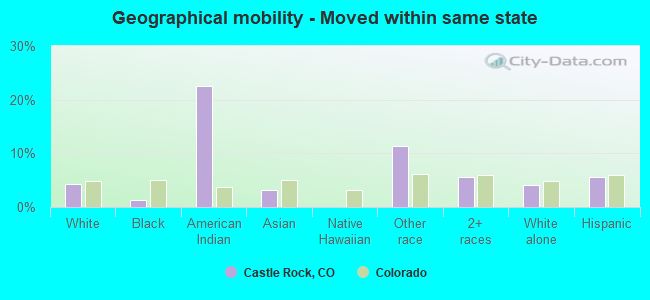
Geographical mobility in Castle Rock Same house 1 year ago 48,044 83.3% White (Caucasian)540 77.9% Black or African American160 64.8% American Indian / Alaska Native1,160 93.3% Asian97 94.1% Native Hawaiian / Pacific Islander1,378 71.1% Other race4,320 87.0% Two or more races42,629 82.2% White alone, not Hispanic / Latino5,537 81.8% Hispanic or LatinoMoved within same county 4,728 8.2% White / Caucasian108 15.5% Black or African American3 1.1% American Indian / Alaska Native81 6.5% Asian290 15.0% Other race153 3.1% Two or more races4,481 8.6% White alone, not Hispanic / Latino535 7.9% Hispanic or LatinoMoved within same state 2,505 4.3% White / Caucasian9 1.3% Black or African American56 22.5% American Indian / Alaska Native39 3.2% Asian221 11.4% Other race273 5.5% Two or more races2,139 4.1% White alone, not Hispanic / Latino376 5.6% Hispanic or LatinoMoved from different state 2,336 4.1% White / Caucasian32 4.6% Black or African American31 12.5% American Indian / Alaska Native14 1.1% Asian66 3.4% Other race285 5.7% Two or more races2,364 4.6% White alone, not Hispanic / Latino316 4.7% Hispanic or LatinoMoved from abroad 136 0.3% White alone, not Hispanic / Latino14 0.2% Hispanic or Latino
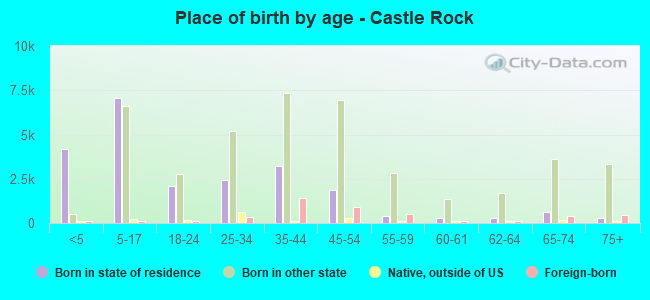
Children Nativity (place of birth) in Castle Rock
Children under 6 years - Living with two parents Both parents native 4,000 99.9% Native5 0.1% Foreign-bornBoth parents foreign-born 179 100.0% NativeOne native, one foreign-born parent 383 100.0% NativeChildren under 6 years - Living with one parent Native parent 598 100.0% NativeForeign-born parent 47 100.0% NativeChildren 6 to 17 years - Living with two parents Both parents native 9,425 100.0% NativeBoth parents foreign-born 212 83.4% Native42 16.6% Foreign-bornOne native, one foreign-born parent 699 97.2% Native20 2.8% Foreign-bornChildren 6 to 17 years - Living with one parent Native parent 1,454 100.0% NativeForeign-born parent 186 54.1% Native158 45.9% Foreign-born
Grandparents responsible for own grandchildren in Castle Rock
Grandparents (30 to 59 years) White / Caucasian 55 22.1% Responsible for grandchildren193 77.9% Not responsible for grandchildrenAsian 18 100.0% Not responsible for grandchildrenOther race 13 100.0% Not responsible for grandchildrenTwo or more races 70 59.2% Responsible for grandchildren48 40.8% Not responsible for grandchildrenWhite alone, not Hispanic / Latino 51 15.7% Responsible for grandchildren273 84.3% Not responsible for grandchildrenHispanic or Latino 11 100.0% Not responsible for grandchildrenGrandparents (60 years and over) White / Caucasian 71 10.8% Responsible for grandchildren587 89.2% Not responsible for grandchildrenAsian 24 100.0% Not responsible for grandchildrenOther race 63 100.0% Not responsible for grandchildrenWhite alone, not Hispanic / Latino 73 9.3% Responsible for grandchildren709 90.7% Not responsible for grandchildrenHispanic or Latino 11 13.4% Responsible for grandchildren73 86.6% Not responsible for grandchildren